
Submitted by jer5150 on Sat, 07/21/2012 - 23:09
I recently performed both of these ECGs a few days apart during the same work week. They were recorded on an outpatient basis. It wasn’t until I recorded the second ECG that I realized I had a good pair of ECGs to illustrate this comparison.
At a superficial glance, both of these appear to represent the same thing and some people might even argue that both of these ECGs have identical interpretations but they would be wrong. One of these represents a conventional example that is intrinsic to the heart and it's conduction system. The other is a lesser-known example and is extrinsic to the heart. Admittedly, they do share similar characteristics however there are several contrasting features as well.
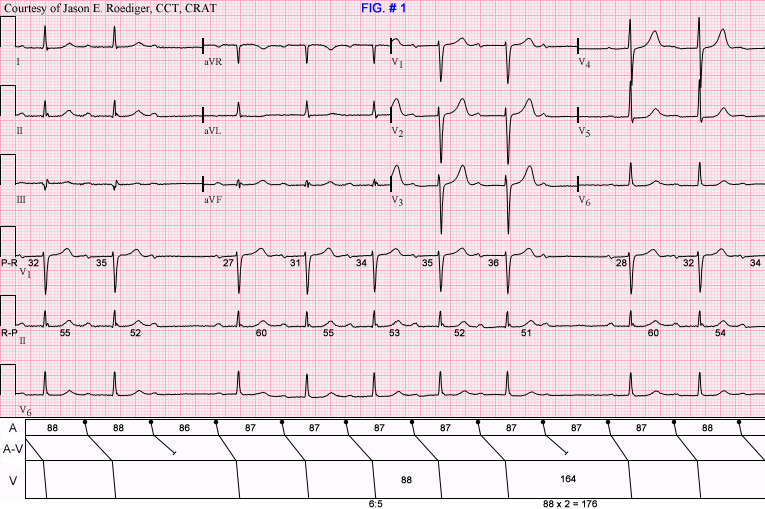
Fig. # 1
Patient's clinical data: 68-year-old white man. History of hypertension.
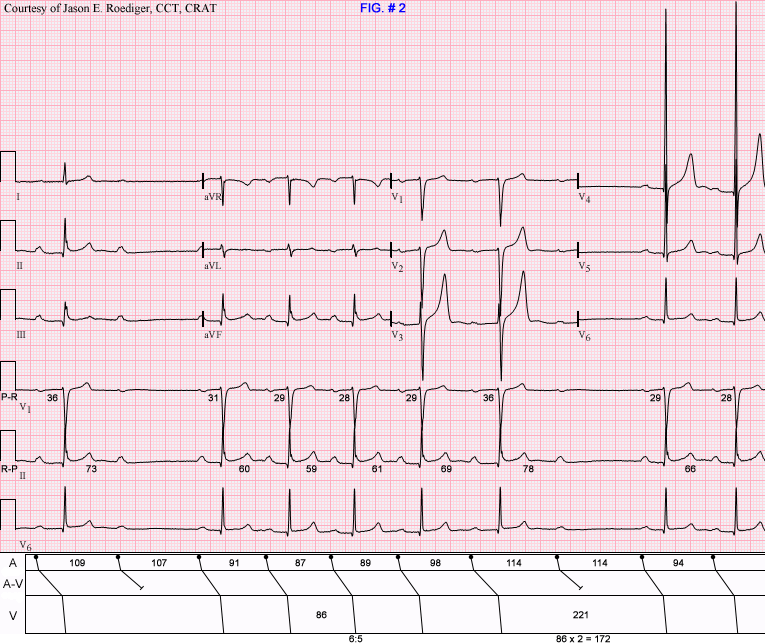
Fig. # 2
Patient's clinical data: 57-year-old black man.
The computer interpreted Fig. # 2 as:
|
Marked sinus bradycardia with marked sinus arrhythmia 1st degree AV block |
DO YOU AGREE WITH THE COMPUTER?
QUESTIONS:
What are the causes of the pauses and the "group beating"? Do either of these patients need a pacemaker?
Hint: In Fig. # 2, pay careful attention to the sinus P-P intervals and their correlation with the timing of the pauses. Compare the PR intervals and their corresponding RP intervals. Also contrast the lengths of the longest and shortest RR intervals. This will help to differentiate it from Fig. # 1.
Rate this content:
-

- jer5150's blog
- Log in or register to post comments
All our content is FREE & COPYRIGHT FREE for non-commercial use
Please be courteous and leave any watermark or author attribution on content you reproduce.
Comments
FUN
Hard ass EKG's #1Wenkibock 3:2-6:5, EKG #2 Sinus 1st degree, slows down like a sinus arryth. into av blk then back into its Sinus 1st degree. Inf changes, Big time T wave with LVH, poss ^K+ U wave seen in ^K+. Have fun folks. :)
HPS
Ecg1 is a normal Wenckebach, but ecg2 represents a more serious problem. There is a constant PR interval with sudden block in AV conduction, besides the conducted complexes show PR prolongation. AV block occurs when we have a PP interval lengthening. This is characteristic of paroxysmal AV block which is very dangerous and usually indicates block below the AV node level (in the His-Purkinje system). The mechanism of this block must be a phase 4 block. I think he patient 2 needs a permanent pacemaker.
Nice tracings
The first tracing shows fixed PP interval and PR interval except the first PR after the block. There is 2:1 AVB twice in this ECG. The RR interval in the block = 2 RR intervals during SR with 1:1 conduction. This is Mobitz type II AVB. This patient can be diagnosed bedside by simple exercise test which will increase the block, if yes then PPM is indicated.
The second ECG shows progressive PP prolongation associated with progressive PR interval and after the block the PR interval is short.There is 2:1 AVB twice in this ECG. RR interval during the block is > 2 RR intervals in SR with 1:1 conduction. This is typical vagal response. This is type I second degree AVB. No PPM is indicated.
INTERPRETATION
Honorable mention goes out to marionurse and gpapi for spotting the Wenckebach in Fig. # 1 and to dr rshama for expertly picking up on the typical vagal response in Fig. # 2.
* NOTE: All measurements on the ECGs and their respective laddergrams are in hundredths of a second.
Figures 1 and 2 both share some common ground: (1) QRS complexes measuring less than 0.12s in duration, (2) prolonged P-R intervals, and (3) 6:5 ratios, but that's where their similarities effectively end.
FIG. # 1
COMPUTER'S INTERPRETATION:
Sinus rhythm 2nd degree AV block (Mobitz i, Wenckebach)
Abnormal ECG
In this case, the computer made the right call but as you will see below, the computer quite often makes big blunders. This patient had only recently been newly documented in this A-V block a couple of weeks prior. In hindsight, I should have suspected Lyme disease and suggested that possibility to the patient's PCP. The PCP had a working theory that his atenolol was the offending drug causing this so it was discontinued. Even after being off his beta blocker for nearly two weeks, the A-V block continued to persist.
MY INTERPRETATION:
(1.) Normal sinus rhythm (rate about 69/min) with . . .
(2.) . . . Type I A-V block manifest in the form of a . . .
(3.) . . . 6:5 Wenckebach period. (see laddergram)
(4.) R-P/P-R reciprocity
COMMENTS:
(1.) The shorter the R-P interval, the longer it's associated P-R interval. Here the relationships are as follows: 138/27, 60/31, 55/34, 53/35, 52/36, and 51/---
(2.) Note the typical "footprints of the Wenckebach": The longest RR interval (164) encompassing the "dropped" beat is less than twice the shortest RR interval (88); 88 x 2 = 176.
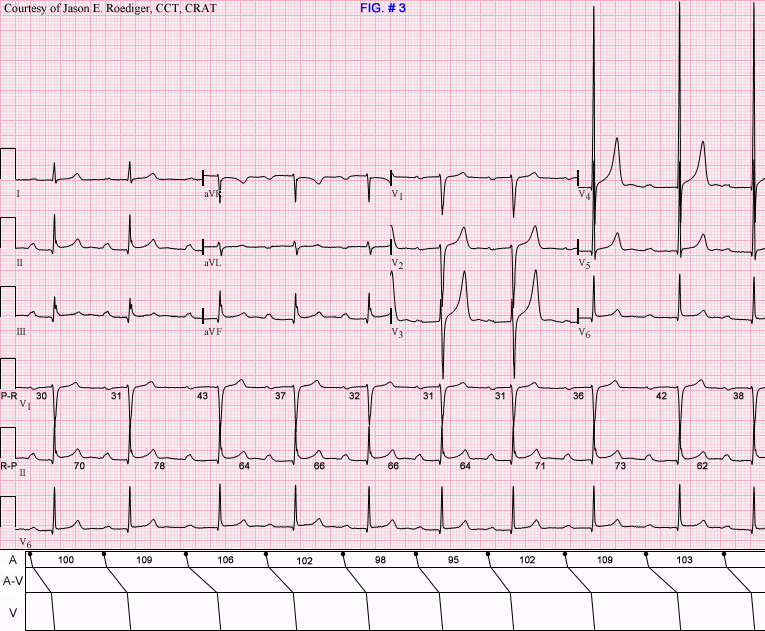
*NOTE: Figures 2 and 3 are from the same patient.
FIG. # 2
COMPUTER’ S INTERPRETATION: (see above)
MY INTERPRETATION:
(1.) Sinus bradycardia with arrhythmia (rate ranging from 53/min to 69/min)
(2.) "Vagotonic" A-V block (i.e., hypervagotonia). (see laddergram)
(3.) Left ventricular hypertrophy (LVH)
COMMENTS:
Inexplicably, the computer completely ignores the "dropped" beats. The computer is programmed not to make the statement of "marked" sinus bradycardia unless it calculates the sinus rate at 49/min or slower. Here the computer averaged the sinus rate at about 47/min, but none of the independent sinus cycles even come close to dropping that low much less do they collectively average at that slow of a rate. A few minutes later I recorded two additional ECGs that were incorrectly interpreted by the computer as atrial fibrillation and junctional rhythm. Both of them were equally of high quality.
Dr. Barold calls this vagally-mediated A-V block. Notice the complete lack of reciprocal relationships between the R-P interval and their associated P-R intervals. In other words, R-P/P-R reciprocity is not present here as it was in Fig. # 1. With a monumentally long R-P interval of 0.78s, one would have expected the 8th sinus impulse to have optimal opportunity to conduct, however it does not. The shortest R-P interval of 0.59s subsequently enjoys the best conducted P-R interval of 0.28s. These paradoxical relationships between the P-R intervals and their antecedent R-P intervals are not at all typical of normal A-V nodal behavior. The longest RR interval (221) encompassing the "dropped" beat is greater than twice the shortest RR interval (86); 86 x 2 = 172.
This patient had previously been documented as having chronic episodes of A-V block going as far back at a full decade ago so none of this was to be entirely unexpected. The patient did, however, complain of some dizziness a few hours earlier the same morning I performed these ECGs. In light of this new symptom, the on-call EP fellow was consulted at the request of the patient's PCP.
FIG. # 3
COMPUTER'S INTERPRETATION:
Junctional rhythm
Voltage criteria for left ventricular hypertrophy
Abnormal ECG
When compared with ECG of (deleted)
Junctional rhythm has replaced atrial fibrillation
This 12-lead ECG was not originally presented in the initial Case of the Week but I've included it here for provide further clarification. I recorded this ECG (Fig. # 3) just a couple of minutes after I recorded the ECG seen in Fig. # 2. Again, inexplicably, the computer has completely ignored the sinus P-waves and as a result has called this junctional rhythm. In between the recording of Fig. # 2 and Fig. # 3, I performed a 3rd additional ECG that was interpreted by the computer as atrial fibrillation but looked virtually identical to Fig. # 3.
MY INTERPRETATION:
(1.) Sinus bradycardia with arrhythmia (rate about 58/min) and . . .
(2.) . . . so-called "first-degree" A-V block (varying prolonged P-R intervals ranging from 0.64s to 0.78s); (see laddergram)
This is what's known as the "Floating P-R interval". The "waxing and waning" or “ebb and flow” of the P-R interval is undoubtedly due to cyclic fluctuations in vagal tone as it increases and then decreases. Again, there are three things that are "waxing and waning": (1.) the P-R interval; (2.) the R-P interval; and (3.) the P-P interval. These 3 intervals are synchronized and fairly predictable. Twice when the P-P interval lengthens out to 109, it corresponds with the two longest P-R intervals which are 0.43s and 0.42s respectively. These two longest P-R intervals are preceded by the two longest R-P intervals of 0.76s and 0.73s. The increased vagal tone was not enough to block the sinus impulses at the anatomic level of the A-V node, but it was enough to further lengthen the already prolonged P-R intervals.
This is what the cardiology attending said about the patient seen in Figures 2 and 3:
ON THE 12-LEAD ECGS THEMSELVES: "EKG tracing review with our electrophysiologists. Findings of prolonging P-P interval and prolongation of PR interval are felt to be consistent with high vagal tone."
IN HIS PATIENT’S PROGRESS NOTE: "Based on increasing P-P interval and some increase in the PR interval, findings are felt to be physiologic secondary to high vagal tone."
Most healthcare providers know what a P-R interval is and how to properly define it. It's been my experience that far less people have ever heard of an R-P interval which is just as easy to understand but is largely ignored. In order to fully understand the Wenckebach phenomenon, as it pertains to A-V block, it is imperative that one understand R-P intervals. They are no less important than the P-R intervals are. It’s for this very reason that I’ve included two key definitions below.
R-P INTERVAL DEFINITION: The duration measured from the beginning of the QRS complex to the beginning of the ensuing P-wave.
R-P / P-R RECIPROCITY DEFINITION: The inverse (i.e., reciprocal) relationship between the P-R interval and its antecedent R-P interval. In other words, the longer the P-R interval, the shorter it’s associated R-P interval and vice versa.
Lastly, the issue of whether either of these patients are suitable candidates for implantation of a permanent pacemaker (PPM). The answer is "no". The rational would be that both patients are asymptomatic and the anatomic level of the block is isolated to the A-V node (i.e., intranodal rather than infranodal). Type I A-V block and Vagotonic A-V block are not exactly the same thing. Electrocardiographically, they behave differently however electrophysiologically, they are both due to block in the A-V node. It’s an oversimplification, but I often describe them as being somewhat like distant cousins in that they are related.
Sources / References:
(1.) http://www.medscape.com/viewarticle/744028_2
(2.) http://books.google.com/books?id=LllhHMaju50C&pg=PA79&lpg=PA79&dq=%22floating+P-R+interval%22&source=bl&ots=jZAh6XipAe&sig=ulMu1hdAGRlYsNPX9pGhl4NgwrQ&hl=en#v=onepage&q=%22floating%20P-R%20interval%22&f=false
(3.) http://books.google.com/books?id=c7zwFXqyKSkC&pg=PT22&lpg=PT22&dq=vagotonic+hypervagotonia&source=bl&ots=6VKDGsKfcy&sig=W9cgCM05YLiCXIrPVUyuhQ-mJLg&hl=en&sa=X&ei=2k0LUPupC4Ln0gHomPiLBA&ved=0CFUQ6AEwCQ#v=onepage&q=vagotonic%20hypervagotonia&f=false
(4.) http://sitemaker.umich.edu/ecgtutorial/2nd_degree_av_block
(5.) http://circ.ahajournals.org/content/110/9/1162.full.pdf
(6.) http://bjsm.bmj.com/content/45/9/687/F2.large.jpg
Jason E. Roediger - Certified Cardiographic Technician (CCT)
[email protected]