Displaying 1 - 2 of 2
Dawn's picture

Atrial fibrillation and Type 2 M.I.

The Patient:     This excellent teaching case was donated to the ECG Guru by our friend, Sebastian Garay (who is an ECG Guru himself).  It was taken from a 33-year-old man who was complaining of chest pain and palpitations. He reported a similar episode about six months prior, but failed to follow up with cardiology. Was told by his medical care provider that he had atrial fib.

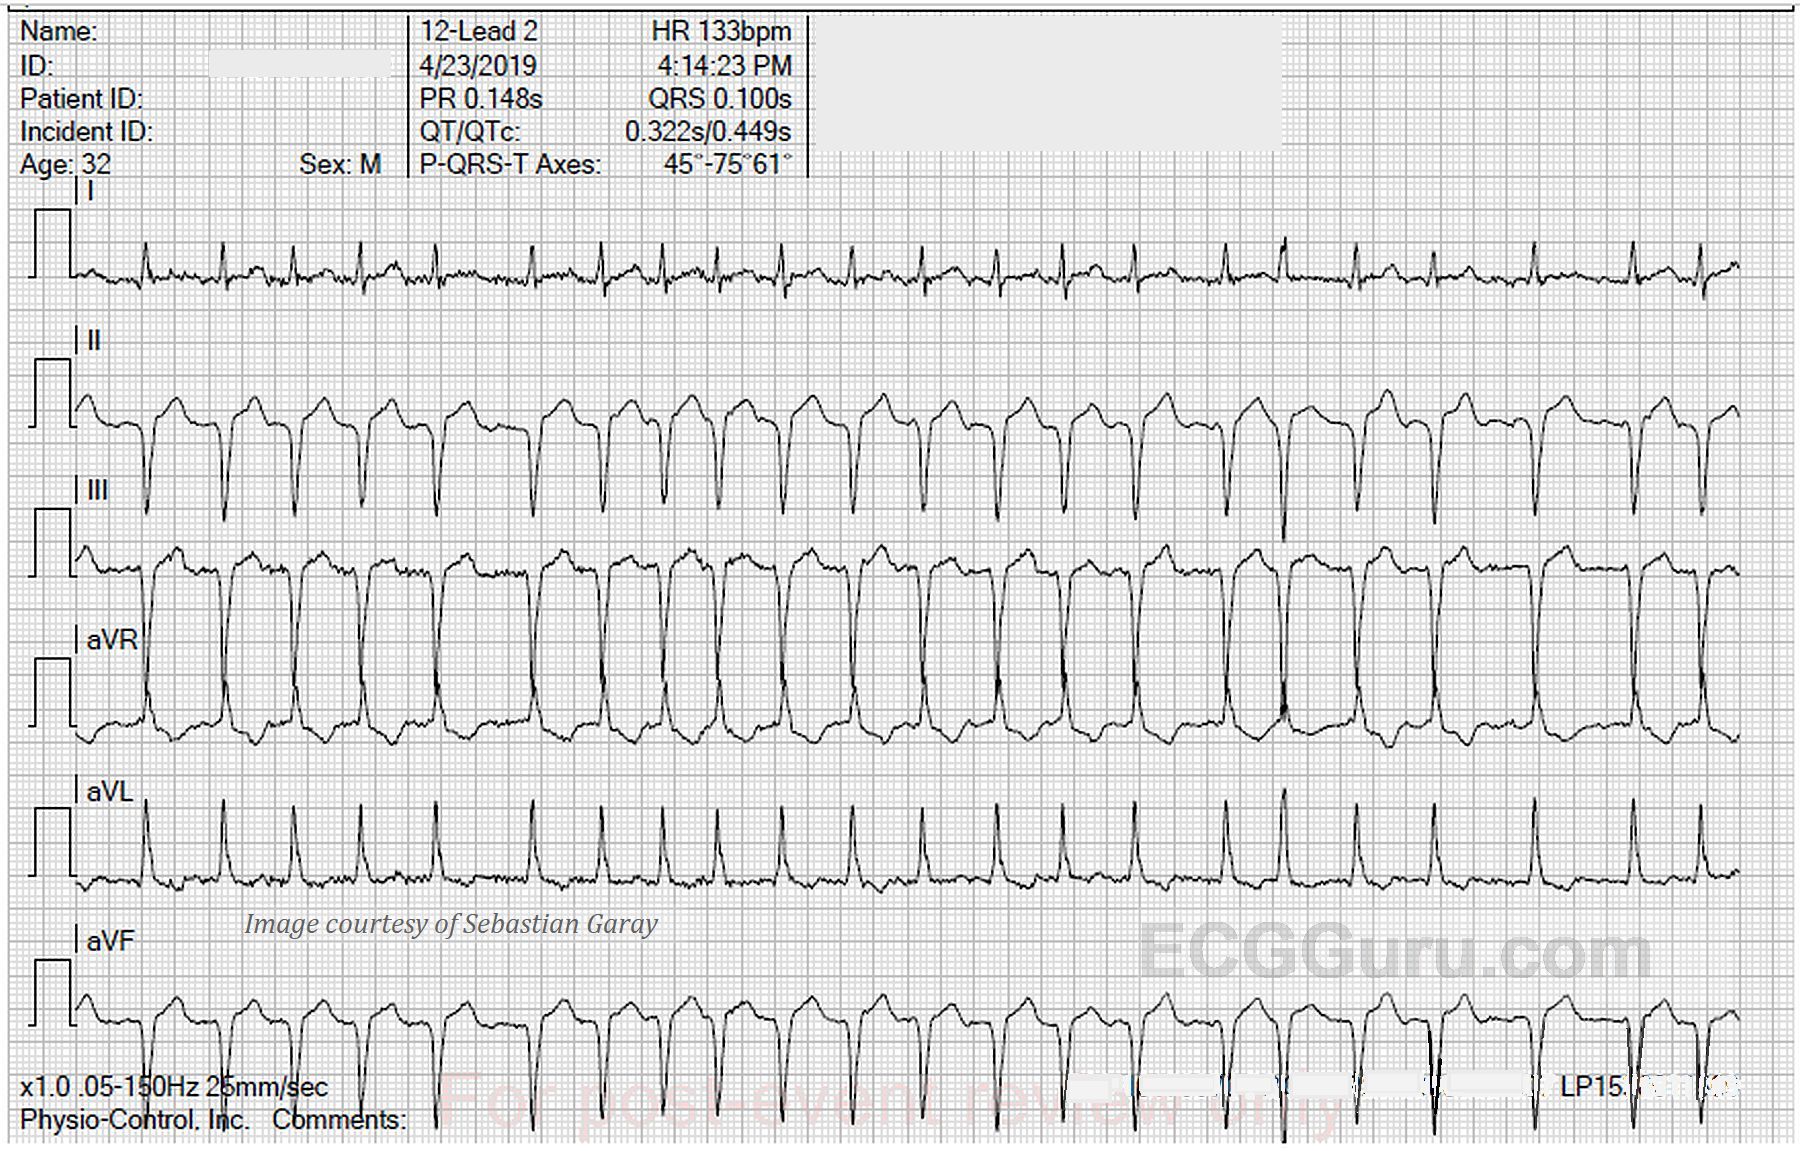
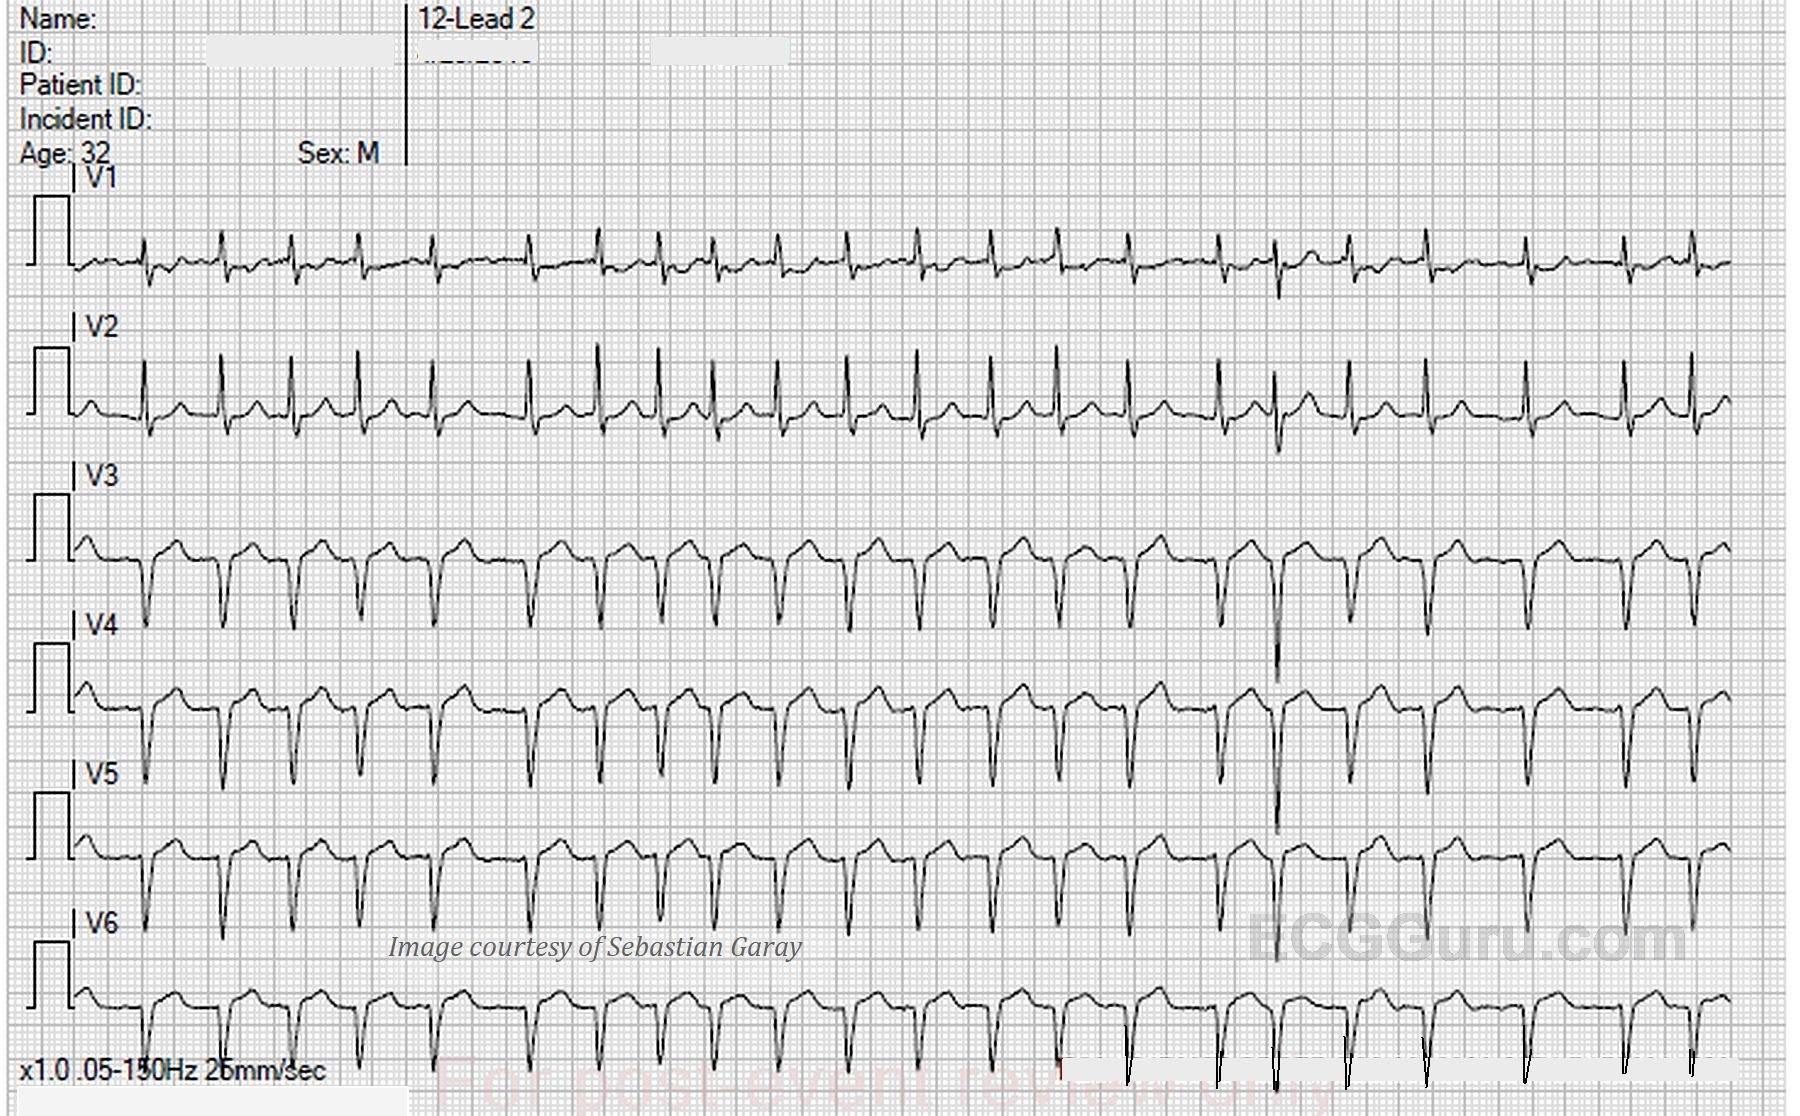
The ECG:      We are able in this case to provide a 12-lead ECG with each lead recorded for the entire width of the paper. This has the advantage of producing twelve ten-second rhythm strips.  Page one contains the limb leads, and page two shows us the precordial leads.

The rhythm is atrial fibrillation, with a heart rate of 133 bpm and an irregularly irregular rhythm. The QRS axis is extreme left at about -75 degrees.  This has caused Leads II, III, and aVF to be negatively deflected, and aVR and aVL to be positive. Lead I is biphasic, low voltage, and mostly positive, indicating that the axis travels almost perpendicular to Lead I, but slightly toward it.

The machine mistakenly gives us a reading for PR interval and P wave axis, even though there are no P waves.  The QRS is on the wide side without being abnormal at .10 seconds (100 ms). The QTc is within normal limits, although it might be considered “borderline”, with 431-450 usually considered borderline.

Dawn's picture

Myocardial Infarction With Non-obstructive Coronary Arteries

This ECG was obtained from a 37-year-old male who was complaining of non-radiating substernal chest pain.  He offered no significant medical history.  He denied taking any medications.  He was hypertensive and bradycardic on arrival in the Emergency Dept. He was alert and ambulatory.  Approximately 20 minutes after first being seen by paramedics, he suffered an episode of ventricular fibrillation in the E.D.  He was resuscitated and sent to the cath lab.  His coronary arteries were without lesions.  We do not know the results of any lab tests, including troponins.

What does the ECG show?  The rhythm is sinus bradycardia at a rate of 48 bpm. The PR, QTc, intervals and QRS duration are normal.  The QRS frontal plane axis is normal and there is good R wave progression in the precordial leads.  There is ST segment elevation in Leads I, aVL, V2, and V3, with reciprocal ST depression in Leads III and aVF.  The ST segments that are elevated retain a relatively “normal” shape, being concave upward. There are no abnormal T wave inversions or pathological Q waves.

All our content is FREE & COPYRIGHT FREE for non-commercial use

Please be courteous and leave any watermark or author attribution on content you reproduce.