
Submitted by Dawn on Sat, 03/07/2020 - 20:52
If you are an instructor, or a fairly new student, you don’t always need to see “challenging” ECGs. But, you may not want to see “standard” ECGs from an arrhythmia generator, either. Every ECG contains subtle and not, so subtle characteristics of the person it belongs to. Take a minute to look at this ECG before reading the discussion, and ask yourself what you might surmise about the patient.
The Patient: We don’t know much about the actual patient this ECG came from. What we do know is that he is an elderly man with a history of heart disease who was hospitalized sometime in the past with an acute M.I. He is now on beta blocker medication and is on a diet, as he is approaching the “morbidly obese” classification. He is now in the ER with shortness of breath and mild chest pain. What does his ECG tell us?
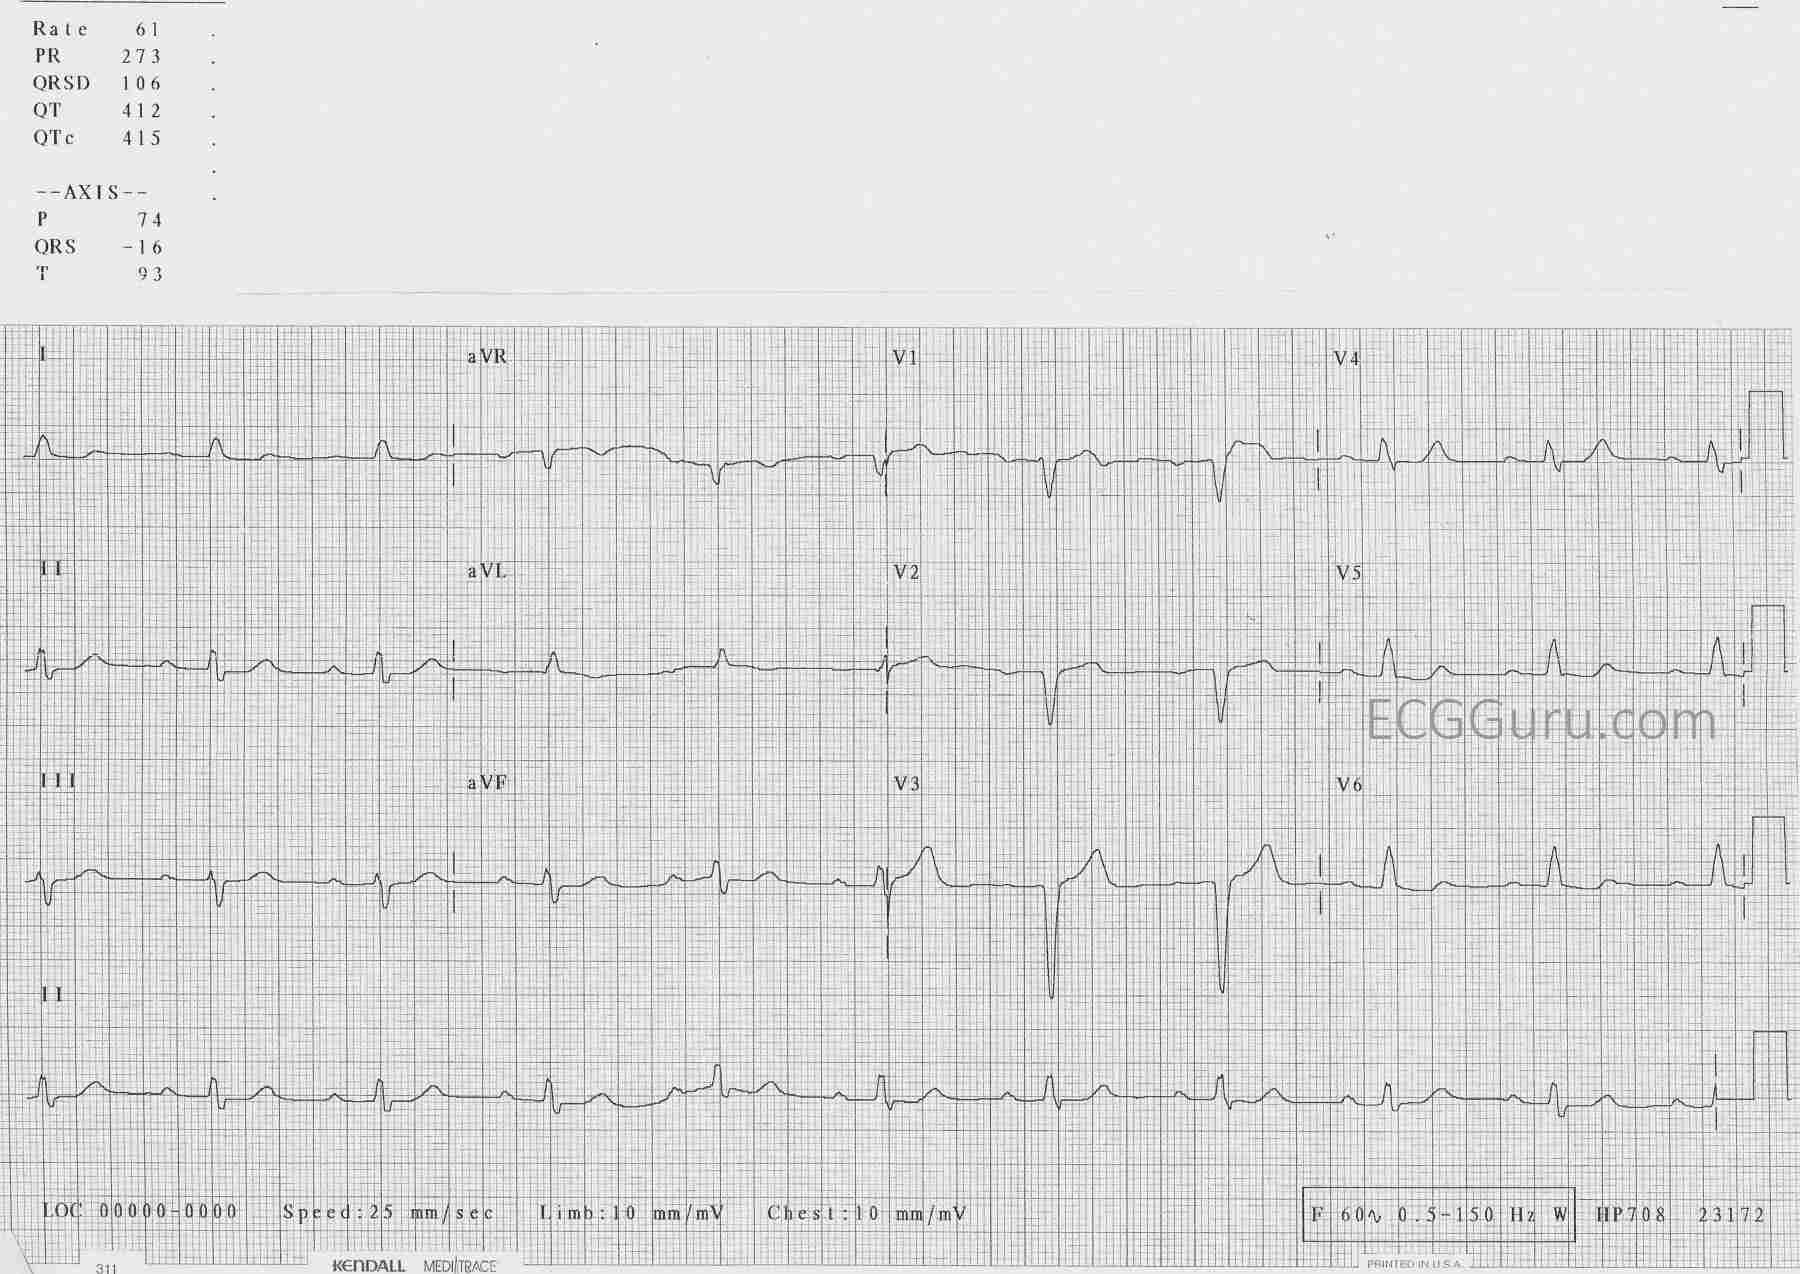
The ECG: The rhythm is sinus at a rate of 60 bpm. Not quite “sinus brady”. His PR interval is 273 ms, or .27 seconds: first-degree AV block. Both of these findings can be attributed to the beta blocker, which slows the heart rate and slows conduction through the AV node. His QRS is slightly widened, at 106 ms, or .11 seconds. Not wide enough for a diagnosis of bundle branch block, but indicative of some delay through the interventricular conduction system. This could be due to multiple causes, including, but not limited to, his medication or his previous M.I. The QRS axis is -16 degrees, or very slightly to the left, which is normal. The R wave progression in the chest leads is appropriately from negative in V1 to positive in V6. However, he has lost the usual “RS” pattern in V2 and V3. The normal small “r” waves have gone, leaving pathological Q waves, a sign of the permanent damage done by his previous anterior-septal wall M.I. There is no ST elevation or depression, and his T waves are upright except in aVR, a normal finding. A perfectionist might not find the shapes of all of the ST segments to be perfect, but he does have coronary artery disease and advanced age. His QTc is within normal limits. The voltage in almost all leads is low. When not localized to one area, this can be a sign of excess tissue in between the heart and the ECG electrodes, which this man did have.
While the ECG does not tell us everything we need to know about this patient, it is able to point us in the direction of what questions to ask and what other tests to do. And it shows us a rate and rhythm that do not require immediate intervention.
Related Terms:
Rate this content:
All our content is FREE & COPYRIGHT FREE for non-commercial use
Please be courteous and leave any watermark or author attribution on content you reproduce.
Comments
An “Uninteresting” ECG that is REALLY Interesting!
Excellent case for discussion — that turns out to be a REALLY interesting tracing. As is often the case when we lack clinical details — we can speculate to bring out important points. That said, we DO know the “essentials” in this case — which is that this patient is an elderly man with known coronary disease, who is on a rate-slowing medication (beta-blocker) — and who presents with some chest pain that seems to be new.
I agree with the main points in Dawn’s interpretation. To this, I will play “Devil’s Advocate”, and point out the clinical relevance of additional findings.
The 1st question to address is whether there are any technical issues? For example, because of the slow heart rate — we only see 2 or 3 QRST complexes in each set of 3 simultaneous leads. In lead V1 — is the 1st complex ( = A) or the 2nd complex ( = B) the one we should be looking at to assess ST-T wave changes? (Please see the attached tracing that I have labeled.) If we used B — then wouldn’t there be worrisome ST elevation! Since we only have 2 complexes to judge by, answering this question is potentially problematic. In short, I believe complex A is the valid one in lead V1 — but it sure would be nice to have additional complexes to verify this!
As per Dawn — the rhythm is sinus at a rate ~60/minute — and the PR interval is clearly prolonged (I agree with the computer measurement = 0.27 second).
The QRS complex looks wide. The RED arrow in the upper left corner of my labeled tracing indicates that the computer measured a QRS duration = .106 second, which I agree with (vertical RED lines I’ve drawn in several leads illustrate my measurements of QRS duration — all of which show the QRS to be less than .11 second). As per Dawn, .106 second is simply not long enough to qualify as LBBB (Left Bundle Branch Block). That said — QRS morphology looks like LBBB. The entity of incomplete LBBB is extremely uncommon — but it may be present here. That said, in order to confidently make a diagnosis of incomplete LBBB — you almost have to capture a prior tracing before the stage of QRS widening — then the incomplete LBBB tracing — and at some later point, a tracing on the patient that documents evolution to complete LBBB.
This is relevant — because assessment of QRS and ST-T wave morphology in a patient with true incomplete LBBB is extremely challenging to interpret. It is normal (and expected) with complete LBBB to see very poor R wave progression, and possibly no initial anterior r waves at all. Interpretation of QRS and ST-T wave morphology with incomplete LBBB is subject to identical constraints as exist with complete LBBB. Therefore — IF rather than just “slight QRS widening", there is really an incomplete LBBB — then those QS complexes in leads V2 and V3 can not be interpreted as indicative of anterior infarction at some point in time.
ST-T waves in association with typical complete LBBB should be oppositely directed to the last QRS deflection in the 3 KEY leads ( = leads I, V1 and V6). This means that since there is a monophasic R wave in lateral leads I and V6 — both the ST segment and the T wave should be oppositely directed (ie, negative) in these leads if all that is going on is a “typical” LBBB. But the terminal T wave is positive in both leads I and V6. That this does in fact represent a primary ST-T wave change (ie, potentially due to ischemia and/or infarction) — is supported by the lead that I find to be the most obviously abnormal in this tracing = lead V4. As per the short, horizontal BLUE line I added to lead V4 — the ST segment in this lead is clearly too flat, with abrupt angulation of a pointed T wave with a wider-than-expected T wave base. I therefore believe that the T waves in leads I, V5 and V6 (lateral leads) all show terminal T wave positivity (that shouldn’t be present with “typical” LBBB) + the clearly abnormal ST-T wave in lead V4.
Finally — please note the abnormal ST segment in lead aVL (within the dotted BLUE oval). As per the curved BLUE line I’ve drawn — this ST segment is coved, as well as appearing to be slightly elevated (it is elevated considering how tiny the QRS complex is in this lead). This is definitely abnormal — because (as stated above) — the ST-T wave is typically oppositely directed to the last QRS deflection in left-sided leads when there is typical LBBB (ie, the ST-T wave should be negative in lead aVL — and not coved and slightly elevated).
BOTTOM LINE: This tracing shows sinus rhythm at 60/minute, marked 1st-degree AV block + slight QRS widening with morphology consistent with incomplete LBBB. In the context of an older patient with known coronary disease who is presenting with new chest pain — the above noted ST-T wave changes are not normal! I suspect these ST-T wave changes are not acute, but there is NO way that I could know this for certain without more clinical information, close follow-up, finding a prior ECG for comparison, and/or serial ECGs + serial troponins. Isn’t this case interesting after all?
Ken Grauer, MD www.kg-ekgpress.com [email protected]