Dawn's picture

Ask The Expert

Dr. Jerry W. Jones, MD, FACEP, FAAEM has graciously shared with us his four-part article on the topic of “Delays & Blocks Involving the Bundle Branches”.

Dr. Jones is a talented instructor who makes difficult topics easy.  Please feel free to post your comments and questions for Dr. Jones and our other ECG Gurus. 

Click THIS LINK for a downloadable pdf of Part 1: Non-Specific Intraventricular Conduction Delays. 

Click THIS LINK for a downloadable pdf of Part 2: Left Bundle Branch Block.

Click THIS LINK for a downloadable pdf of Part 3: Right Bundle Branch Block.

Click THIS LINK for a downloadable pdf of Part 4: The Fascicles of the Left Bundle Branch 

Dawn's picture

Ask The Expert

Today's Expert is Dr. Jerry Jones, MD, FACEP, FAAEM                                                                                                                                                             

 Jerry W. Jones, MD FACEP FAAEM is a diplomate of the American Board of Emergency Medicine who has practiced internal medicine and emergency medicine for 35 years.    

Dr. Jones has been on the teaching faculties of the University of Oklahoma and The University of Texas Medical Branch in Galveston. He is a published author who has also been featured in the New York Times and the Annals of Emergency Medicine for his work in the developing field of telemedicine. He is also a Fellow of the American College of Emergency Physicians and a Fellow of the American Academy of Emergency Medicine and, in addition, a member of the European Society of Emergency Medicine. 

 Dr. Jones is the CEO of Medicus of Houston and the principal instructor for the Advanced ECG Interpretation Boot Camp and the Advanced Dysrhythmia Boot Camp.                                                                                                                                                                                                                                                                                                                    


Question:  I teach beginner students. How can I explain the complex subject of “AV Blocks”?  I don’t want to teach incorrect information while trying to simplify the subject.


 Answer:  AV Blocks Article By Dr. Jerry Jones  (click link)


Dawn's picture

Ask The Expert

Today’s expert is Dr. Jerry W. Jones, MD, FACEP, FAAEM

Jerry W. Jones, MD FACEP FAAEM is a diplomate of the American Board of Emergency Medicine who has practiced internal medicine and emergency medicine for 35 years. Dr. Jerry JonesDr. Jones has been on the teaching faculties of the University of Oklahoma and The University of Texas Medical Branch in Galveston. He is a published author who has also been featured in the New York Times and the Annals of Emergency Medicine for his work in the developing field of telemedicine. He is also a Fellow of the American College of Emergency Physicians and a Fellow of the American Academy of Emergency Medicine and, in addition, a member of the European Society of Emergency Medicine. 

 Dr. Jones is the CEO of Medicus of Houston and the principal instructor for the Advanced ECG Interpretation Boot Camp and the Advanced Dysrhythmia Boot Camp. 

QUESTION:  How can I explain to students that injury from an M.I. “localizes” on the ECG, but subendocardial ischemia/injury does not?

ANSWER:                 Allegory of Subendocardial Ischemia

 For many years we have misunderstood the concept of subendocardial ischemia as it manifests on the 12-lead ECG.  Previously, if one saw ST depression in leads II, III, and aVF, it would be labelled "inferior subendocardial ischemia" and, if the patient were momentarily having little or no chest pain, the patiet would be sent home.  The same thing happened with ST depression in leads V4 - V6; "anterolateral subendocardial ischemia," probably chronic and again, the patient may be sent home.  And of course, ST depression in leads V1-V4: "anteroseptal subendocardial ischemia" and often the patient was sent home.

Then a number of years ago, some disturbing information began to surface in various medical journals around the globe.  Sometimes ST depression that was limited to just leads II, III, and aVF, for example, did not reveal any actual subendocardial ischemia in the inferior wall of the left ventricle.  In some cases, subendocardial ischemia was indeed present but very little involved the inferior wall and most of the ischemia was elsewhere; but... the only ST depression present was in the inferior leads.  Some articles began mentioning the same findings regarding ST depression in other leads as well.

What we have learned is that when ST depression indicates subendocardial ischemia, IT DOES NOT LOCALIZE!  Just because there is ST depression in leads II, III, and aVF does NOT necessarily mean that the ischemia is located in the inferior wall of the left ventricle.  It MAY be there, or there may be SOME ischemia there but most of it elsewhere, or there may be NO ISCHEMIA AT ALL there.

Some people still have difficulty conceptualizing this, so I developed an allegory of subendocardial ischemia using the concept of a vacant house at night.


Imagine you have gone out for a walk one pleasant evening in your neighborhood.  As you stroll down the street, you come upon a vacant house.  You know it is vacant because the family that lived there moved out recently.  However, you can see light coming from some of the windows of the house. You wonder what's going on, so you walk up to the house and look through a window into the living room.  The room is illuminated but you don't actually see a light on there.  You move around to another window and look into the dining room.  Again, there is enough light for you to see everything in the room but you don't actually see any light fixture that is on. Finally, you move around to the window that looks into the kitchen.  It's illuminated as well and you can see everything but, once again, the source of the light is not there.  Is the light in a room that you cannot see or is it perhaps a closet light that has been left on somewhere in the house?

That - in essence - is subendocardial ischemia.  Just because you see ischemia through the "windows" of leads II, III or aVF or the "windows" of leads V4 - V6 doesn't mean that the "source of the ischemia is in those "rooms."

Subendocardial ischemia manifested by ST depression does NOT localize reliably.  So how should you report such ischemia?  This is what I would say if I saw (for instance) ST depression in leads V4 - V6:  "There is subendocardial ischemia present indicated by ST depression in leads V4 - V6."  I would NOT call it "anterolateral ischemia."

Actually, this information has been available for a number of years.  So, if you are reading textbooks, journal articles or posts on websites that still refer to "inferior ischemia", "high lateral ischemia", "anteriorlateral ischemia" etc., then you are reading information that is OUTDATED. If it was recently written, then you are reading information from someone who is NOT staying current with advances in electrocardiography.


Dawn's picture

Ask The Expert

Today’s expert is Dr. Jerry W. Jones, MD, FACEP, FAAEM

Jerry W. Jones, MD FACEP FAAEM is a diplomate of the American Board of Emergency Medicine who has practiced internal medicine and emergency medicine for 35 years. Dr. Jerry JonesDr. Jones has been on the teaching faculties of the University of Oklahoma and The University of Texas Medical Branch in Galveston. He is a published author who has also been featured in the New York Times and the Annals of Emergency Medicine for his work in the developing field of telemedicine. He is also a Fellow of the American College of Emergency Physicians and a Fellow of the American Academy of Emergency Medicine and, in addition, a member of the European Society of Emergency Medicine. 

 Dr. Jones is the CEO of Medicus of Houston and the principal instructor for the Advanced ECG Interpretation Boot Camp and the Advanced Dysrhythmia Boot Camp. 


Question:   What is the cause of an apparent right bundle branch block pattern in a paced rhythm?

Answer:  Is There a Pacemaker Wire Problem… or Not?

 During one of my orientations as a young internal medicine house officer, the cardiologist lectured to us on the essentials of how to check pacemakers. Since none of us had any ECG interpretation background our comprehension was less than sterling. But I remember him stressing the point that a properly paced pacemaker lead would result in a left bundle branch block pattern on the ECG. A right bundle branch block pattern in V1, on the other hand, meant that the pacemaker wire had inadvertently wandered into the left ventricle – a highly undesirable situation. 

“Not to worry,” he said. “Such things rarely happen and you will probably retire before seeing such a thing!” That evening I saw my first pacemaker 12-lead ECG with a right bundle branch block pattern in V1. Fate wasted no time with me.

I ordered a 3-view chest x-ray and as far as I could see, the wire looked like it was in the right ventricle where it was supposed to be. I called the cardiologist on-call who happened to be in the hospital at the time and he dropped by the ward. Back then, we didn’t have ultrasound or echo available. But he, too, was convinced the pacemaker wire was in the right ventricle. It really was and so I still hadn’t seen a RBBB pattern due to a pacer wire in the left ventricle. I still haven’t, but I have seen a number of pacemaker ECGs with a RBBB pattern in V1.

How do we know if such a finding represents a real left ventricular pacer wire or a pseudo-malplacement?

First, just be aware that a wire that really IS in the left ventricle is going to present with a RBBB pattern in V1. It will NOT ever present with a LBBB pattern. However, a wire that has been correctly placed in the RIGHT ventricle can – from time to time – present with a RBBB pattern in V1. In my years as an attending in the emergency department, I saw this seven or eight times.

Second, the axis of the pseudo-malplacement tends to demonstrate a significant left axis deviation, between -30 ° and    -90 °. Since the right ventricle is activated first, the vector finishes by pointing up and to the left. If the wire were actually located in the left ventricle, the mean frontal axis would be to the right of +90 °

Third, when we look in the precordial leads, we know that Leads V1 and V2 overlie the right ventricle and leads V5 and V6 overlie the left ventricle. Leads V3 and V4 are in between. If the pacemaker wire is in the right ventricle, whatever is causing it to have an RBBB pattern in V1 will disappear before V3. A pacemaker wire in the right ventricle will show a LBBB pattern (QS) by Lead V3. If the wire is truly in the left ventricle, the RBBB pattern will extend to V3 and usually beyond. So a quick check is this: if you see a RBBB pattern in V1 in a pacemaker patient, look at V3. If the RBBB pattern is in V3 also, the wire is truly in the left ventricle. If V3 has a predominately negative QRS (QS), the wire is safely in the right ventricle where it is supposed to be. 

A fourth check is to look for an S wave in Lead I. Remember: one of the most characteristic features of RBBB is that slurred S wave in Lead I (as well as the other left-sided leads). If the ECG shows an RBBB pattern in V1 and an S wave is present in Lead I, then that is most likely a real RBBB pattern and the wire has somehow made its way into the left ventricle.

Pseudo Malplacement of Pacemaker Wire


Dawn's picture

Ask the Expert

Question:


Dr. Jones,

I am confused about the repolarization abnormalities that occur in conditions other than acute M.I. (Bundle branch block and hypertrophy, for example). I have been taught that the repolarization abnormalities should point opposite the MAIN part of the QRS, but also I have been told that they should point opposite the TERMINAL deflection of the QRS.  Which is right?


Today’s expert is Dr. Jerry W. Jones, MD, FACEP, FAAEM

Jerry W. Jones, MD FACEP FAAEM is a diplomate of the American Board of Emergency Medicine who has practiced internal medicine and emergency medicine for 35 years. Dr. Jones has been on the teaching faculties of the University of Oklahoma and The University of Texas Medical Branch in Galveston. He is a published author who has also been featured in the New York Times and the Annals of Emergency Medicine for his work in the developing field of telemedicine. He is also a Fellow of the American College of Emergency Physicians and a Fellow of the American Academy of Emergency Medicine and, in addition, a member of the European Society of Emergency Medicine. Dr. Jones is the CEO of Medicus of Houston and the principal instructor for the Advanced ECG Interpretation Boot Camp and the Advanced Dysrhythmia Boot Camp. 


Answer:


Which Direction Should the Repolarization Abnormality Point?

OK. You've got an abnormal QRS complex followed by a repolarization abnormality (RA). Which direction should the repolarization abnormality point? As a young resident, I was taught that the RA should point in the direction opposite the terminal deflection of the QRS complex. But years later, I see other physicians stating that the repolarization abnormality should point opposite the main deflection of the QRS complex. Which is correct?

The answer is both are correct. Why? How?

The reason is that the repolarization abnormality is connected to the ventricle in which the problem is located - not the QRS complex itself. To better understand this, let's look at some of the major causes of repolarization abnormalities (you can find examples in the illustration at the top of this page):

Right Bundle Branch Block (RBBB) - When you look at the QRS complex in V1, you see an R and an R'. The R represents left ventricular activation while the R' represents right ventricular activation. So, the problem lies in the right ventricle represented by the R'. The repolarization abnormality reflects the problem in the RV so it should be opposite the R' which is always the last deflection in V1 in the presence of RBBB. Therefore, in cases of RBBB, the repolarization abnormality is always opposite the terminal deflection of the QRS.

Left Bundle Branch Block (LBBB) - When you look at the QRS complex from V6 which has a LBBB, we see a relatively tall, upright monophasic QRS complex. Part of that QRS represents right ventricular depolarization and part represents left ventricular depolarization. But how much of which? We don't know, but all we need to know is that this is a monophasic complex and it is upright. Therefore, since the repolarization abnormality reflects the problem in the left ventricle, and the LV is represented somewhere in that monophasic R, the repolarization abnormality should be opposite the main deflection. Therefore, in cases of LBBB, the repolarization abnormality is always opposite the main deflection of the QRS.

Left Ventricular Hypertrophy (LVH) - When you look at the QRS complexes from V5 and V6, we see a relatively tall, upright monophasic QRS complex. Part of that QRS represents right ventricular depolarization and part represents left ventricular depolarization. But how much of which? Again, we don't know, but all we need to know is that this is a monophasic complex and it is upright. Therefore, since the repolarization abnormality reflects the problem in the left ventricle, and the LV is represented somewhere in that monophasic R, the repolarization abnormality should be opposite the main deflection. Therefore, in cases of LVH, the repolarization abnormality is always opposite the main deflection of the QRS.

Right Ventricular Hypertrophy (RVH) - The same concept discussed regarding LVH applies in cases of RVH. Therefore, in cases of RVH, the repolarization abnormality is always opposite the main deflection of the QRS.

Ventricular Pre-excitation - Most people reading ECGs don't realize that ventricular pre-excitation can also produce a repolarization abnormality. Just as repolarization abnormalities are not always present in cases of LVH and RVH, they are not always present in cases of ventricular pre-excitation, either. However, the repolarization abnormality IS present in some cases. The RA is connected to the ventricle containing the accessory pathway, but don't worry: you don't have to determine which ventricle that is. If a repolarization abnormality is present in a lead, it should be negative if the delta wave is positive and vice versa. Therefore, the repolarization abnormality points opposite to the direction of the delta wave.


So, the question really isn't whether the repolarization abnormality should be opposite the terminal or the main deflection of the QRS. It should be opposite the deflection that represents the involved ventricle.

Dawn's picture

Ask the Expert

Dr. Jerry Jones

Question:

Dr. Jones, can you help me understand refractory periods better? I find that a difficult topic to teach, and there are so many different terms used to describe refractory periods.

Today’s expert is Dr. Jerry W. Jones, MD, FACEP, FAAEM

Jerry W. Jones, MD FACEP FAAEM is a diplomate of the American Board of Emergency Medicine who has practiced internal medicine and emergency medicine for 35 years. Dr. Jones has been on the teaching faculties of the University of Oklahoma and The University of Texas Medical Branch in Galveston. He is a published author who has also been featured in the New York Times and the Annals of Emergency Medicine for his work in the developing field of telemedicine. He is also a Fellow of the American College of Emergency Physicians and a Fellow of the American Academy of Emergency Medicine and, in addition, a member of the European Society of Emergency Medicine. 

Dr. Jones is the CEO of Medicus of Houston and the principal instructor for the Advanced ECG Interpretation Boot Camp and the Advanced Dysrhythmia Boot Camp. 


Answer:


                          Refractory Periods: Absolute/Relative and Effective/Functional


 If you do any reading of the vast amount of literature regarding ECG interpretation, you have certainly encountered the terms effective refractory period and functional refractory period. In introductory courses, we learn about the absolute refractory period and the relative refractory period, but no one ever teaches the effective and functional refractory periods. Most definitions are confusing and incomplete, so I have written a short monograph on this topic.


The effective refractory period  is basically the same as the absolute refractory period – but there is a slight difference!

The absolute refractory period is a physiologic state – it begins with the onset of the action potential at Phase 0 and represents the period involving all of depolarization and that part of repolarization during which no amount of stimulus can result in another action potential.

The effective refractory period tries to define the absolute refractory period in more realistic, practical terms. The effective refractory period also represents the period during which a typical impulse cannot produce another action potential. So how does this differ from the absolute refractory period? To understand this, we must now jump to a better understanding of the relative refractory period.

The relative refractory period begins at the point that a maximal stimulus is able to initiate another action potential. The key phrase here is maximal stimulus. If a maximal stimulus occurs one-millionth of one millisecond after the end of the absolute refractory period, another action potential will be generated. But for that action potential to occur, that stimulus will have to be at its maximum amplitude because the threshold potential will be much closer to zero potential than it usually is, thus requiring much greater amplitude to initiate the action potential.

But most Phase 0 depolarizations do not result in maximal voltage. Many times, the arriving impulse does not have a full complement of sodium channels to open, so even though the “all-or-nothing” threshold is reached and an action potential is generated, that action potential has less-than-maximal amplitude. When that is the case, the impulse will have to occur further and further into the relative refractory period before threshold is reached and an action potential is generated. So while there is most definitely an absolute refractory period with a definite end to it, as far as an individual patient is concerned, the “absolute refractory period” may not end until some point well into the relative refractory period. So, for that patient, his/her effective refractory period may be a bit longer than the actual absolute refractory period.

The absolute and relative refractory periods are real phenomena. They are also observable phenomena: we can see that an atrial impulse arrived during the absolute refractory period of the AV node or His bundle because it failed to conduct in spite of more than adequate voltage. We can see that an atrial impulse arrived during the relative refractory period of the AV node or His bundle because it conducted with a prolonged PR interval. But observing these phenomena doesn’t really tell us exactly where the absolute refractory period ends and the relative refractory period begins.

The effective refractory period begins with a programmed stimulus (S1) and ends with a programmed stimulus (S2). S1 marks the beginning of Phase 0 of the action potential and S2 marks the longest interval from S1 that fails to result in a depolarization. Note that I did not restrict the longest interval to “within the absolute refractory period.”

In the diagram above, there are 5 equal, vertical lines representing paced impulses (S2) following Phase 0 (S1) of the action potential. Only a line crossing through the curved line representing the relative refractory period has reached threshold and will result in an action potential. Here, only the 5th line breaches the relative refractory curve, so it conducted.

The length of the effective refractory period depends on the strength of the stimulus being used and the length of the coupling interval (number of msec between S1 and S2). If the stimulus is not very strong, the effective refractory period will be measured well into the actual relative refractory period before a depolarization appears (as in the diagram above). If a stronger stimulus is used, a depolarization will be produced earlier and the effective refractory period will be shorter and more representative of the absolute refractory period. Also, if the coupling interval is rather long, the last non-conducted S2 may occur well before the end of the absolute refractory period. So it’s possible that the effective refractory period may actually be measured as being longer or shorter than the absolute refractory period. Although the effective refractory period and the absolute refractory period are not always exactly equal, for practical purposes they can be considered almost the same (since the electrophysiologist’s attempts to measure the effective refractory period are obviously much more precise than depicted in the diagram above). The terms are frequently used interchangeably in the literature but now you understand the subtle difference.

Many people make the mistake of thinking that if the effective refractory period is “basically” the same as the absolute refractory period, then the functional refractory period is the same as the relative refractory period. Nothing could be further from the truth! The functional refractory period and the relative refractory period are not at all the same, though they both relate to the point during the action potential in which an extra-strong stimulus can result in a depolarization. The functional refractory period is the electrophysiologist’s attempt to measure the distance from the onset of the action potential to the onset of the relative refractory period – not the duration of the relative refractory period! It actually represents the shortest interval between two consecutively conducted, paced impulses (S1 and S2). The relative refractory period begins at the point during repolarization that an exceptionally strong stimulus can initiate a depolarization and it ends (usually, but not always) with the onset of Phase 4. This is not what the functional refractory period measures!

The electrophysiologist, however, finds it more practical to measure from a programmed stimulus (S1) that initiates an action potential to the earliest point at which a sufficiently strong stimulus (S2) is able to initiate another depolarization. Thus, the functional refractory period is a measurement between two programmed stimuli – once again, S1 and S2 – and covers all the same territory as the effective refractory period. But again, this determination is voltage- and time-dependent with the strength of the stimulus and the coupling interval (the interval between S1 and S2) affecting where the first depolarization occurs.

But note that while the effective refractory period and the absolute refractory period are virtually the same, the functional refractory period and the relative refractory period are measurements of different sections of the action potential. What we think of as the relative refractory period begins, basically, where the functional refractory period ends. 

Note:

1.       The effective refractory period is – by definition –shorter than the functional refractory period if the same stimulus strength and the same coupling intervals of S1 and S2 are used in both measurements.

2.       The effective refractory period is (presumably) completely overlapped by the absolute refractory period while the functional refractory period and relative refractory periods overlap very little!

3.       Both the effective refractory period and the functional refractory period begin and end with a programmed stimulus. The absolute refractory period and the relative refractory period are surmised based on the duration of the action potential (QT interval) and the response of the heart to the following sinus or ectopic impulse.

4.       The effective refractory period essentially determines the end of the absolute refractory period while the functional refractory period determines the beginning of the relative refractory period. 


The absolute refractory period ends around the time the membrane potential has returned to about -60°. Likewise, that is approximately where the relative refractory period begins.


Dawn's picture

Ask the Expert

Dr. Jerry W. Jones, MD, FACEP, FAAEM

Question:

Dr. Jones, do you have any tips to help me teach axis determination to my students?

Today’s expert is Dr. Jerry W. Jones, MD, FACEP, FAAEM

Jerry W. Jones, MD FACEP FAAEM is a diplomate of the American Board of Emergency Medicine who has practiced internal medicine and emergency medicine for 35 years. Dr. Jones has been on the teaching faculties of the University of Oklahoma and The University of Texas Medical Branch in Galveston. He is a published author who has also been featured in the New York Times and the Annals of Emergency Medicine for his work in the developing field of telemedicine. He is also a Fellow of the American College of Emergency Physicians and a Fellow of the American Academy of Emergency Medicine and, in addition, a member of the European Society of Emergency Medicine. 

Dr. Jones is the CEO of Medicus of Houston and the principal instructor for the Advanced ECG Interpretation Boot Camp and the Advanced Dysrhythmia Boot Camp. 

Answer:

Frontal Plane Axis Shortcuts

 When we speak of axes and vectors, we are usually referring to the mean QRS axis in the frontal plane – much more so than in the horizontal plane (where it’s more properly called “rotation” rather than “axis”). We are also concerned with the P axis and the T axis in the frontal plane. And, at times, we are even concerned with the ST (segment) axis!


That can be a lot of drawing of lines and angles and expenditure of brain power – especially after being awake and on duty most of the night. Well… relax! It doesn’t have to be difficult at all. And you don’t have to draw any diagrams!

Before we start, let’s be certain that we are speaking the same language: in electrocardiography, when we say “left” we mean the PATIENT’S “left;” when we say “right” we mean the PATIENT’s “right.” We are not referring to the right side of the diagram or ECG tracing in front of you. The positive pole of Lead I may be on the right side of the drawing of Einthoven’s triangle, but it is on the PATIENT’S left! OK, let’s proceed…

First of all there are three generalizations about axes that you should know:

FIRST, forget about axes of +23 degrees, -14 degrees or +61 degrees. You never – let me repeat – NEVER have to be so exact in electrocardiography unless you are calculating the QRS-T angle (and most healthcare providers don’t need to do that). 99 % of the time if you are within 15° to 30° of the correct mean axis you are doing JUST FINE! The reason is because 99 % of the time we just want to know if the axis is normal or not, or if it is located closer to one of the extremes of axis (the “extremes” being left axis deviation or right axis deviation). Besides, the mean QRS axis is very labile – just taking a deep breath can change it considerably!

SECOND, knowing that an axis is “normal” really doesn’t tell you a whole lot since both normal and abnormal hearts can have perfectly normal mean QRS axes in the frontal plane. However, very, very few normal hearts will have an abnormal axis. So, although knowing that the mean QRS axis in the frontal plane is normal really doesn’t help much, knowing that the axis falls outside the normal range is an extremely good indication of cardiovascular pathology.

The first axis we are concerned about is the mean QRS axis in the frontal plane. There are four leads that we use to tell us what we need to know.

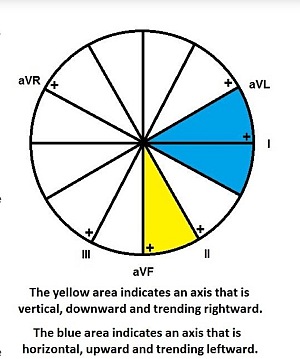
First of all, to decide whether the axis is normal or not, we look at leads I and II. If the QRS is negative in I (but positive in II), then there is a right axis deviation. If the QRS is negative in II (but positive in I), then there is left axis deviation. If it is upright in both, then the mean QRS axis in the frontal plane is perfectly normal. But again – “normal” really doesn’t tell us a lot. Forget about aVF! We no longer use it in determining the mean QRS axis in the frontal plane other than to diagnose an axis in the northwest quadrant (“no man’s land”), which is very rare.

Second, we often want to know if the “normal” mean axis is tending rightward or leftward. We do that by looking at leads aVL and III. If the QRS complex is predominantly negative in aVL, then it has to be more positive than +60° (rightward). If the QRS is predominantly negative in III, then it has to be more negative than +30° (leftward). If the QRS complexes in leads aVL and III are both positive, then the mean QRS axis in the frontal plane will lie between +60° and +30° and could not be more “NORMAL!”

Axis illustration Dr. JonesTall, thin people usually have long, elongated hearts that seem to just “hang” in their chest (and some actually do!). We would expect these individuals to have hearts that are nearly vertical, so we would also expect to see a QRS complex in aVL that is predominantly negative or maybe equiphasic. If the QRS in aVL were very positive, we would wonder about the presence of a conduction disturbance that sends the terminal depolarization upwards. (FYI, in electrocardiography, when we say an impulse is traveling “upwards,” we really mean “to the left.” If we say it’s traveling “downwards, we really mean “to the right.”)

Short, stocky people tend to have hearts that lie a bit more horizontally on the diaphragm, so we would expect their mean QRS axis in the frontal plane to be more horizontal. Therefore, we shouldn’t be surprised to see that lead III is predominantly negative or equiphasic.

So if we look at a 12-lead ECG and quickly see that the QRS complexes in both leads I and II are positive but the QRS complex in lead III is negative, we would say that although the mean QRS axis (or vector) in the frontal plane is normal, it is also somewhat leftward or horizontal. If the QRS in aVL were negative instead, then we would report the mean QRS axis as somewhat rightward or vertical.

Rightward means downward and leftward means upward (and vice versa, respectively).

Years ago, we were taught that any axis more negative than 0° was left axis deviation. Then, it was decided that the axis could be up to -30° and still be normal. This presented a lot of confusion regarding how to refer to a normal axis. Basically, if the mean QRS axis in the frontal plane falls between -30° and +90° call it NORMAL. If it falls between -30° and -90° call it LEFT AXIS DEVIATION. Some people still want to refer to the area from 0° to -30° as left axis deviation but with a normal axis and they do make a good argument. The issue of how to refer to that section between 0° and -30° still isn’t completely resolved.

Let’s talk about P waves. Anytime I mention “P wave axis” or “P wave vector” I usually see eyes rolling up to the ceiling. But the P wave axis is determined exactly the same way as the QRS axis!

A good pearl to remember is that any P wave axis, QRS axis or T wave axis that is located between 0° and +90° is NORMAL! Of course, a QRS axis located between 0° and -30° is also NORMAL. The vast majority of P wave axes and T wave axes are going to be found within a more narrow range within that 90° spread between 0° and +90°, but they are still NORMAL as long as they are between 0° and +90°.

That being said, we usually want to know the general direction of the P wave axis (I’m going to stop repeating “mean axis” and “in the frontal plane”). Abnormal P wave axes tend to be vertically oriented.

Normally, the P wave axis is almost parallel to the lead II axis and so it tends to cluster around +60°. A P wave in the frontal plane that is moving rightward – i.e., more inferiorly or vertically – is very characteristic of chronic lung disease such as COPD or an acute strain on the right side of the heart such as a pulmonary embolus.

If the P wave vector becomes more vertically oriented, what happens to the P wave in lead I? Lead I is perfectly horizontal on the Einthoven triangle, so if the P axis is vertical, then it must be perpendicular to lead I. When a vector is perpendicular to a lead it can be either isoelectric or equiphasic. In the case of the P wave, it is usually isoelectric – or nearly so. In any case, a P wave with a vertical axis will be very small or totally isoelectric in lead I. Obviously, we normally do see P waves in lead I so equally obviously the P wave axis is usually not particularly vertical.

The T wave axis can be handled exactly the same way as the QRS and P wave axes. However, we really don’t look at the T wave axis that much. When we do, it’s usually in reference to the angle formed between the T wave axis and the QRS axis (on the hexaxial reference grid) called the QRS-T angle. In calculating the QRS-T angle, we really do want to use axes that are as accurate as possible. However, determining those axes to the nearest degree isn’t really as difficult as you might imagine. Here’s my method:

I use the R and T axes printed on the ECG printout. Seriously… this is how 98% of all physicians calculate the QRS-T angle (and the other 2% are liars!).

Joking aside, advanced electrocardiographers do sometimes use the T wave axis to interpret 12-lead ECGs, but most healthcare providers need only note that the T wave is inverted in certain leads under certain conditions.

I said there were three generalizations about axes, so here’s the third…

THREE, most healthcare providers reading ECGs at a beginners’ or low-intermediate level tend to focus on positive deflections and really don’t pay that much attention to negative deflections (except for Q waves and deeply inverted T waves). But there’s a lot of information to be gathered from negative deflections.

Let’s focus on S waves. Let’s say we are dealing with a heart that has a nearly vertical QRS axis with predominantly negative QRS complexes in leads II, III and aVF. That means that the ventricular depolarization is heading straight up. But what if the deepest S wave is in lead III? That would tell us that the preponderance of the electrical force is pointing up and to the left (around -60° and parallel to the lead III axis) which would point to the basal-lateral area of the left ventricle. Therefore, we likely have a heart with a problem in the left ventricle – perhaps in the area served by the LAD, LCx or ramus intermedius. One would also like to see what’s happening in lead aVL because it’s up in that area also. Usually the problem will be LVH or LAFB (anterior hemiblock). And what if lead II has the deepest S wave? That would indicate that the QRS axis is likely parallel (or nearly so) to lead II and traveling away from its positive pole which would be up and to the right (around -120°) – likely a problem in the right ventricle or the RCA circulation. If that were the case, one would want to look at lead aVR because it’s up there in that vicinity, too.

Just remember that when we speak of positivity or negativity of a deflection in any of the frontal leads, we are talking about vertical or horizontal axis. Positivity or negativity in lead I is considered the “gold standard” for determining “rightwardness” or “leftwardness,” but it often really isn’t that useful for the simple reason that it is rather unusual to see predominantly negative complexes in lead I. That’s because axes in the frontal plane are typically normal. So we have to look at other leads that indicate a rightward tendency or leftward tendency within the context of a normal axis and those leads are lead III (negativity indicates “leftwardness”) and lead aVL (negativity indicates “rightwardness”). The inferior leads – II, III and aVF – indicate verticality (downward or rightward if positive, upward or leftward if negative).


So, in the final analysis, you usually just want to know if you have a vertical axis or a horizontal axis, if the axis is outside the limits of normality and occasionally, when the axis is normal, you may want to know if it is trending leftward or rightward. Now you know how to determine this information without doing any diagraming or calculating.

Dawn's picture

Ask the Expert

Dr. Jerry W. Jones, MD, FACEP, FAAEM

QUESTION:

Dr. Jones, what advice do you have for teaching ECG beginners? 


Today’s expert is Dr. Jerry W. Jones, MD, FACEP, FAAEM
 

Jerry W. Jones, MD FACEP FAAEM is a diplomate of the American Board of Emergency Medicine who has practiced internal medicine and emergency medicine for 35 years. Dr. Jones has been on the teaching faculties of the University of Oklahoma and The University of Texas Medical Branch in Galveston. He is a published author who has also been featured in the New York Times and the Annals of Emergency Medicine for his work in the developing field of telemedicine. He is also a Fellow of the American College of Emergency Physicians and a Fellow of the American Academy of Emergency Medicine and, in addition, a member of the European Society of Emergency Medicine. 

Dr. Jones is the CEO of Medicus of Houston and the principal instructor for the Advanced ECG Interpretation Boot Camp and the Advanced Dysrhythmia Boot Camp. 

ANSWER: 

Even in my advanced classes I begin with "normal" ECGs. Throughout my residency in internal medicine, I was never up at 3 am wondering if an ECG was ABNORMAL ... I was always trying to decide if a finding was really NORMAL instead.

Here are a few of my thoughts...

A biphasic P wave in V1 is basically the norm. Even when there is only a monophasic deflection, it's usually because the other half of the biphasic deflection is isoelectric.

In my advanced courses we always begin with a normal tracing and I have all the participants measure the R-R intervals with ECG calipers to demonstrate that there is often considerable variation in the rhythm and that there is very rarely a perfectly regular sinus rhythm (and when there is - it's only for a few moments!). This comes in handy occasionally in deciding whether a tachycardia is sinus or not.

I often find that beginners have the impression that the R waves in the precordial leads increase in size from V1 through V6 - and that should never be the case in a "normal" ECG. Typically the tallest R wave peaks at V4 or V5. Because the V6 electrode is the furthest of all the regular precordial leads from the surface of the heart, it actually diminishes in amplitude. When the R wave in V6 is the tallest across the precordium, it means that the heart has enlarged enough to extend its surface a lot closer to the V6 electrode. That alone is a very good indication of cardiac enlargement.

One other thing I would really emphasize to a newbie is that the ST segment should rise gently into the upslope of the T wave and that there should never be a perceptible angle indicating where the ST ends and the T wave begins - it should be smooth and without a discernible margin. And the T wave should always be asymmetrical - NOT symmetrical. However, when the downslope of the T wave returns to the baseline it CAN create a noticeable angle. 

I hope some of these comments help you teach those who are just beginning to read ECGs.

Dawn's picture

Ask The Expert

Dr. Ken Grauer

QUESTION: 

Can you provide some guidelines on how to convey the large body of information associated with clinical evaluation and management of cardiac arrhythmias from a primary care perspective? 

Today’s Expert is the ECG Guru’s Contributing Expert, Dr. Ken Grauer. 

KEN GRAUER, MD is Professor Emeritus (Dept. Community Health/Family Medicine, College of Medicine, University of Florida in Gainesville).

Dr. Grauer has been a leading family physician educator for over 30 years. During that time he has published (as principal author) more than 10 books and numerous study aids on the topics of ECG interpretation, cardiac arrhythmias, and ACLS (including an ongoing Educational ECG Blog) . Dr. Grauer is the Contributing Expert for the ECG Guru. 

ANSWER: 

The topic of evaluating the patient with a cardiac arrhythmia – and then formulating an optimal approach to management is HUGE. It encompasses assessing both symptomatic and asymptomatic patients – determining if an arrhythmia is truly present, and if so, whether the arrhythmia is worrisome or benign – and then deciding on whether drugs, lifestyle changes, or referral for specialized EP (electrophysiologic) evaluation is in order. 

I have developed a 3-part (less than 90-minute) video series that addresses this tremendously important clinical topic from start to finish. Included in these videos are assessment of the patient, arrhythmia monitoring methods, when to refer, and targeted discussion of the most commonly encountered arrhythmias in primary care. These include ectopic beats (PACs; PJCs; PVCs) – ventricular arrhythmias (nonsustained vs sustained VT occurring in different clinical settings) – bradycardias (diagnosis of Sick Sinus Syndrome plus indications for pacing) – MAT – PSVT/AVNRT – Atrial Flutter – and Atrial Fibrillation. 

Links to these 3 Videos – plus LOTS of additional relevant information (including pdf excerpts available for free download from my ECG and ACLS ePubs on specifics of arrhythmia diagnosis) – is now all available for use on my new clinical arrhythmia webpage, www.fafpecg.com. I hope this material is helpful to you in your teaching! The beauty of these videos is that content is appropriate and understandable for primary care providers of virtually any level or degree of training – and that by assignment, learning can be entirely self-instructional OR under your direct guidance and instruction.  

P.S. I am still finishing a Power Point Show (without audio) that you can use if you choose to teach this subject yourself using my slides. This should be completed soon. The rest of this web page is finished and READY for use. Your comments and feedback is WELCOME!


If you have a question for one of our Experts, please email your question to:  [email protected]

Dawn's picture

Ask The Expert

Darlene Hutton, RN, BScN, MSN

Question:  As a fairly new educator in the telemetry/medical unit or Emergency Department, what steps would you suggest taking in helping new nurses to the unit understand ECG Interpretation?


Today's Expert is Darlene Hutton, RN, BScN, MSN

Darlene Hutton has worked in CCU, ICU, PACU, and Emergency as a bedside nurse, educator, and manager. She is currently working as a Clinical Research Manager at Rouge Valley Metabolic Research Associates in Toronto. Darlene also is an Educational Consultant providing workshops, seminars, and conferences on such topics as ECG Interpretation, Dysrhythmia Interpretation, Acute Coronary Syndromes and Cardiology Drugs. She is also an ACLS Course Director and runs courses throughout the province. Her company, QRS Educational Services, founded 18 years ago, provides education to nurses and other health care professionals throughout Canada. She is also the Department Head for Emergency Preparedness in the O.R. in the American College of Plastic Surgical Nursing journal.

 [email protected]

(905) 706-3301     www.qrs-education.com     www.facebook.com/qrs.educationservices


ANSWER:

As an independent educator for the past 20 years, I have had the incredible pleasure of spending time with novice to expert nurses in their respective field from a variety of different hospital settings.  My response to this question comes from what I have learned from each of these individuals over the past 2 decades.

We know that the “expert” practitioner is sometimes not the best educator because of their own challenges in bringing the information to a basic level of understanding.  What makes an educator invaluable is their ability to bring the most advanced concepts to the level of understanding for the individual and tailor the education to that level.

A novice nurse entering into one of these units will likely have had some courses in rhythm interpretation as a basic entry level requirement.  However, I find that many of these nurses have not had adequate preparation time in being able to apply a systematic approach to assessing the 12 Lead ECG. When working in these types of units, promptly assessing the ECG is essential to ensure there is no time delay in notifying the physician of anything urgent.

I apply a step-wise approach in ensuring that the basics are understood before moving on to the more intricate aspects of the ECG.

The basics that I assess are:

1. Ensure the nurse understands what the P, QRS, and ST represent and their significance, if abnormal. Most importantly, I ask them to point out examples of ST elevation and depression on various ECGs.  You would be surprised at how many people do not know this very core concept and before discussing treatment management and complications, this basic concept needs to be well understood. If you only have 30 minutes to spend with a nurse on this particular day, this would be the priority, in my opinion.

2. The next step would then be to assess their knowledge and discuss what’s happening with ST elevation/depression, including the treatment strategies. This can be achieved in 30 minutes to an hour.

3. Third: anticipated complications. I can’t tell you how often I hear nurses want to give a saline bolus to a hypotensive patient experiencing an anterior wall MI.  They do not understand the pathophysiology and their actions will subsequently worsen the situation.  Apart from cardiac arrest occurring with any MI, I expect that everyone understands the ‘expected’ complications associated with the inferior and anterior wall MI. For this, I keep it very simple so retention of information remains. “The heart is comprised of 2 pumps. If the right pump fails and backs up, what will you notice? Will the chest be wet or dry? (about 1/3 of the group will say wet, which is incorrect). If the left pump fails and backs up (such as in an anterior MI), where does it back up to? Will the chest be wet or dry?” By keeping it simple, the concepts are easier to understand and retain.

4. In many of the hospitals, there is an annual recertification of the ECG basics and this is another opportunity as an educator to assist those who may be struggling. 

5. I also provide staff with reference tools so they can help themselves learn at their own pace. On my educational website: www.qrs-education.com , there are reference links and tips under the QRS Tips tab as well as our manual which you can read about in the Products page. This manual has taken the complex concepts to a more manageable level. I also promote Dawn’s website (www.ecgguru.com ) as another invaluable tool. Two examples of interactive links are:  www.practicalclinicalskills.com  and www.skillsstat.com 

I hope this has helped. Thank you.

Darlene Hutton

President, QRS Educational Services

www.qrs-education.com  


 IF YOU HAVE A TEACHING QUESTION FOR OUR EXPERTS, PLEASE EMAIL TO [email protected]


Pages

All our content is FREE & COPYRIGHT FREE for non-commercial use

Please be courteous and leave any watermark or author attribution on content you reproduce.