Displaying 1 - 7 of 7
Dawn's picture

Complete Heart Block or High Grade AVB?

The patient:  This ECG was obtained from a 91-year-old woman who was complaining of weakness.  Unfortunately, we have no other information. 

The ECG:  This ECG has something for your basic students, and even more for the more advanced learners.  The first thing  that anyone should notice is the slow rate.  The ventricular rate is around 35 bpm, and regular.  If the patient is showing signs of poor perfusion, we would stop here and prepare to increase the rate with a temporary pacemaker (transvenous or transcutaneous). Why is the rate so slow?  There is no P wave in front of each QRS, so this is not sinus bradycardia.  Rather, we see P waves at a rate of approximately 100 bpm, wit a very regular rhythm.  Beginners should “march out” the P waves with calipers or by marking a straight edge piece of paper.  There are 15 P waves on this ECG – some are buried within QRS complexes (QRS #3) or T waves (QRS #4).

 Because there are two distinct, regular rhythms, but they do not track with one another, we know this is possibly third-degree AV block (complete heart block).  Another clue is that there are no steady, repetitive PR intervals, which means there is no relationship between the atrial rhythm and the ventricular rhythm.

 For more advanced learners, it is helpful to try to identify the origin of the escape rhythm.  If it is junctional, the AV block is above the junction.  If the escape is ventricular, the AV block is below the junction.  A junctional rhythm is usually between 40 – 60 bpm, with a narrow QRS.  Ventricular escape rhythms are usually less than 40 bpm and with wide QRS complexes.   This ECG will be a little challenging on this front, because the rhythm has some characteristics of junctional rhythm and of ventricular rhythm.

Dawn's picture

ECG Basics: Third-degree AV Block, Complete Heart Block

This rhythm strip shows third-degree AV block, also called complete heart block or complete AV block.  The P waves are from the sinus node, and are regular at a rate of about 120/min. (Sinus tachycardia). This is a good strip for showing your students how to "march out" the P waves to find the ones that are hidden behind QRS complexes or T waves. Knowing that the P waves are regular, it is easy to find the hidden ones.

The QRS complexes are wide at 0.14 seconds, and regular, with a rate of about 28/min.  On first glance, it APPEARS that there are PR intervals.  That is, it appears that some of the P waves are conducting. If you measure the PR intervals carefully, you will note that they are NOT equal.  There is no connection between the P waves and the QRS complexes - this strip has just caught them near each other.  If we ran the strip longer, we would see the PR intervals "come apart", proving they are not real.  The QRS complexes are coming from an IDIOVENTRICULAR ESCAPE RHYTHM.  They are regular, wide, have no P waves associated with them, and the rate is below 40 bpm.

Patients with CHB that results in a very slow heart rate sometimes need emergency treatment aimed at increasing the rate.  When the escape rhythm is idioventricular, it is assumed that the AV block is located below the AV node, and emergency temporary pacing is often the method of choice.  In fact, a permanent implanted pacemaker is almost always needed.  When the AV block is located in the AV node, the escape rhythm will be junctional (narrow QRS complexes, rate about 40-60 bpm).     


Dawn's picture

ECG Basics: Atrial Fibrillation With Complete AV Block

This patient has an underlying atrial fibrillation with complete heart block and an idioventricular escape rhythm.  She was treated successfully with a permanent implanted pacemaker.

Dawn's picture

Complete AV Block

This ECG is from an 84-year-old man who experienced dizziness and a fall.  He was not injured in the fall.  In this ECG, we can clearly see regular P waves at about 110 per minute.  We also see wide QRS complexes at about 52 per minute.  There is AV  dissociation - there are no regular PR intervals, or even progressively-prolonging PR intervals.  The atrial and the ventricles are beating to separate rhythms.  What is interesting about this rhythm is the origin of the escape rhythm.  The wide complex suggests a ventricular focus and the rate suggests supraventricular origin.  Near the end of the ECG, the escape rhythm either fails or slows significantly.  To see the next 12-lead ECG for this patient, go to this LINK.

The second ECG makes it more clear that this is an idioventricular escape rhythm, but the morphology of the QRS complexes suggested that, even in the first ECG when the rate was faster.  There are several clues that this is probably ventricular, including a very "backward" axis with aVR being upright and II, III, and aVF all being negative.  Also, V6 is negative, and there is nearly precordial concordance:  all except V1 are negative.  The morphology of the QRS does not fit a diagnosis of either left bundle branch block OR right bundle branch block.  The evidence points to a ventricular origin for this escape rhythm, and the patient quickly goes on to slow down severely.  Ventricular escape rhythm strongly suggests a sub-Hisian location for the block, and they tend to be more life-threatening than supra-Hisian blocks.

The take-home clinical lesson here is to BE PREPARED for worsening of the rate whenever AV block is present, especially high-grade AV block or sub-Hisian block.  This ECG is a very good one for teaching students to "march out" P waves, and find "hidden" P waves.  We have included a marked copy of this ECG to indicate those P waves.

Thanks to Sebastian Garay for donating these ECGs.


Dawn's picture

High-grade AV Block

To continue on a topic started by Jason Roediger in his February ECG Challenge -

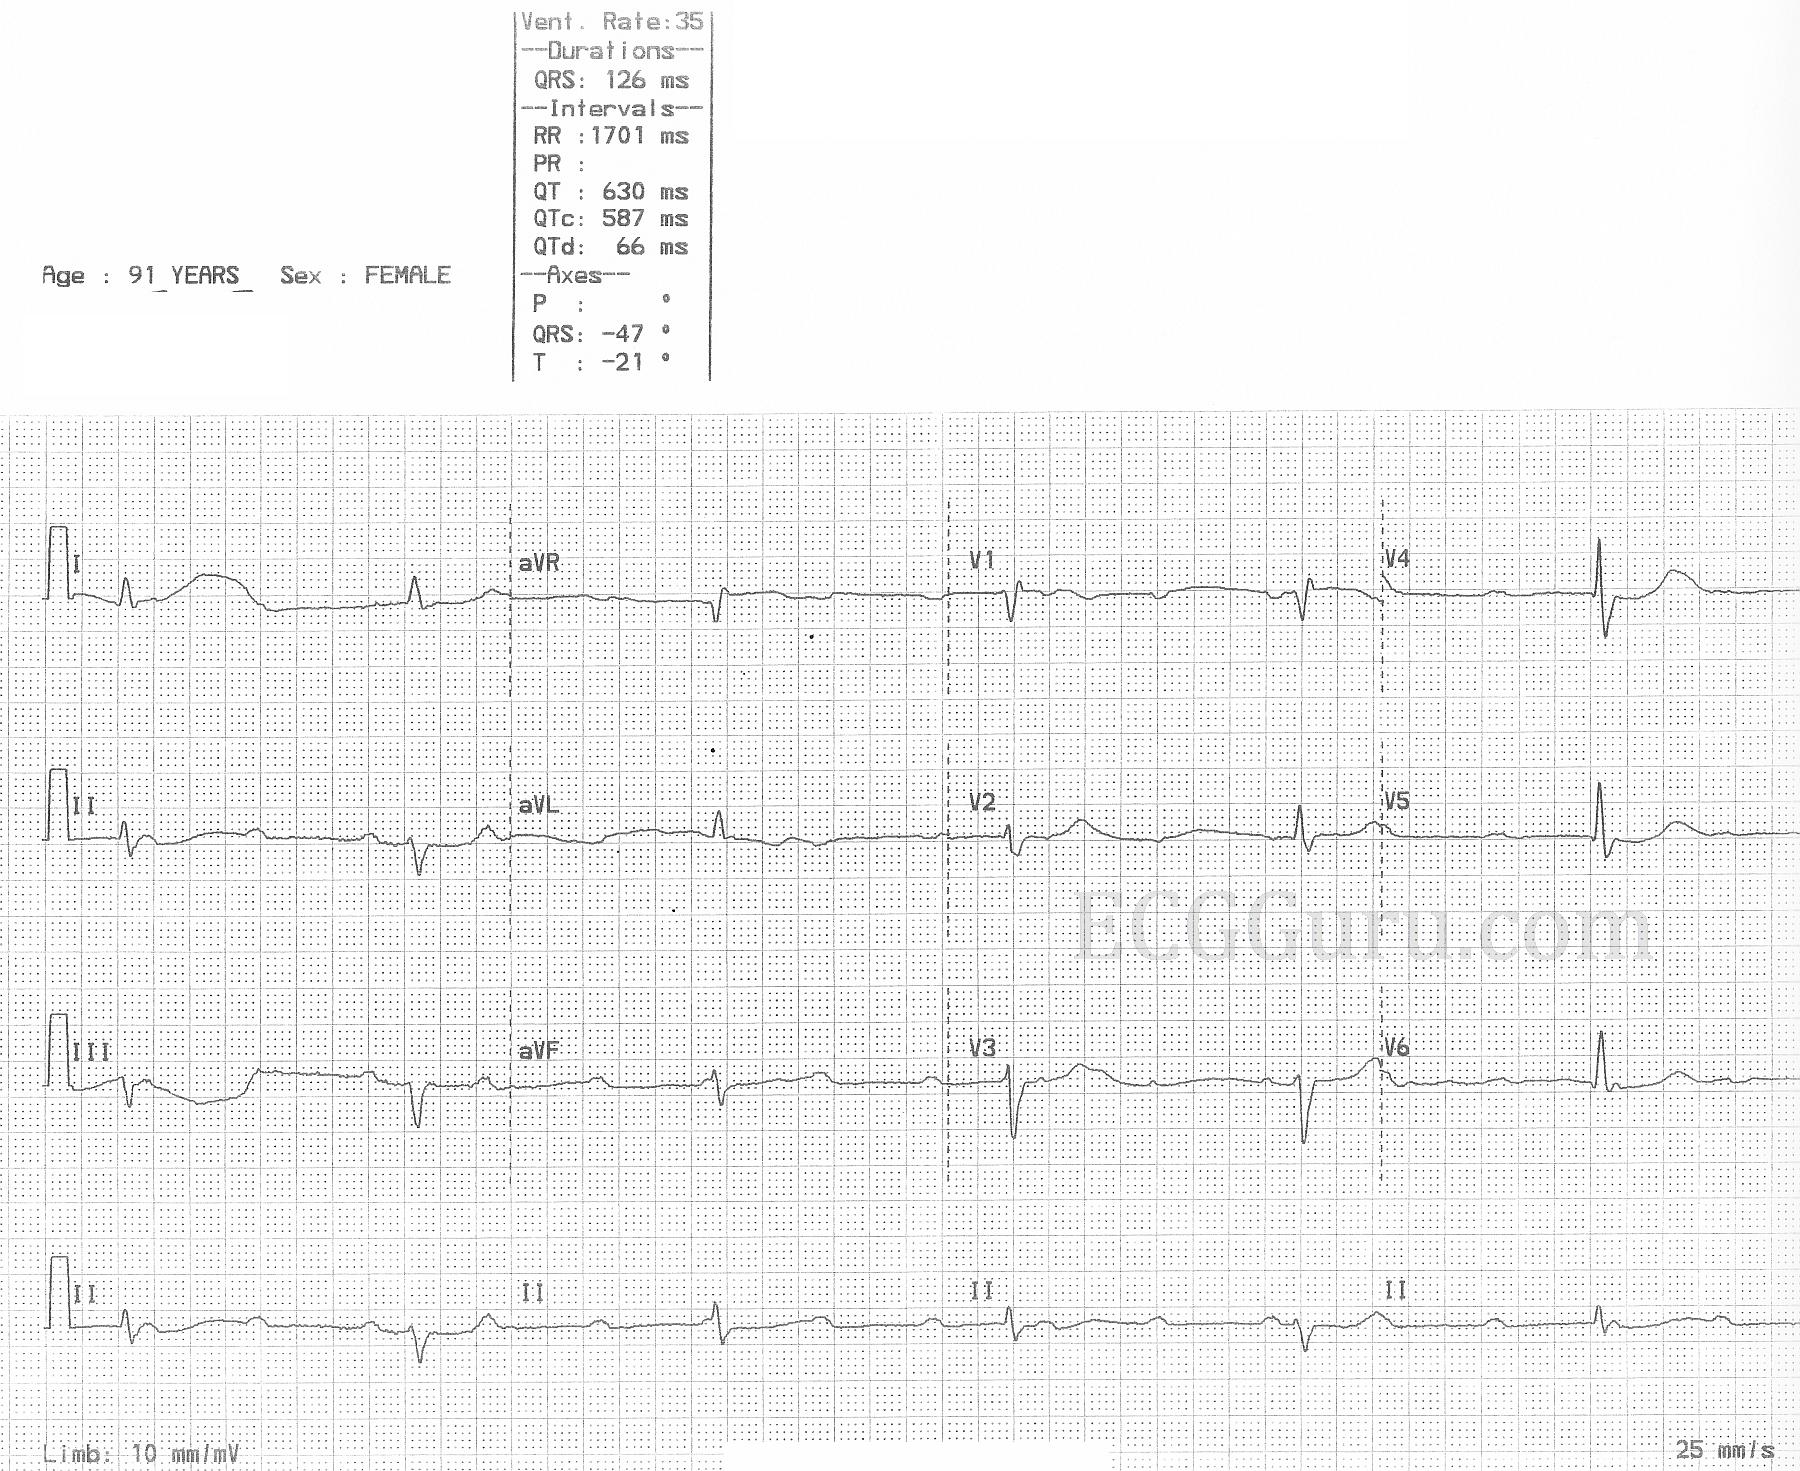
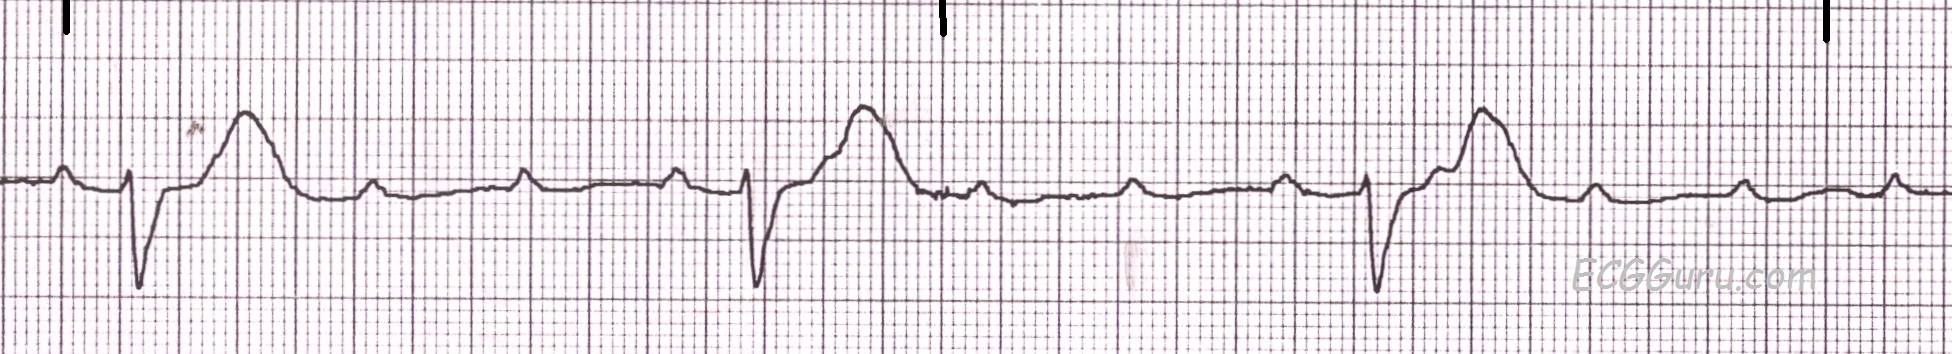
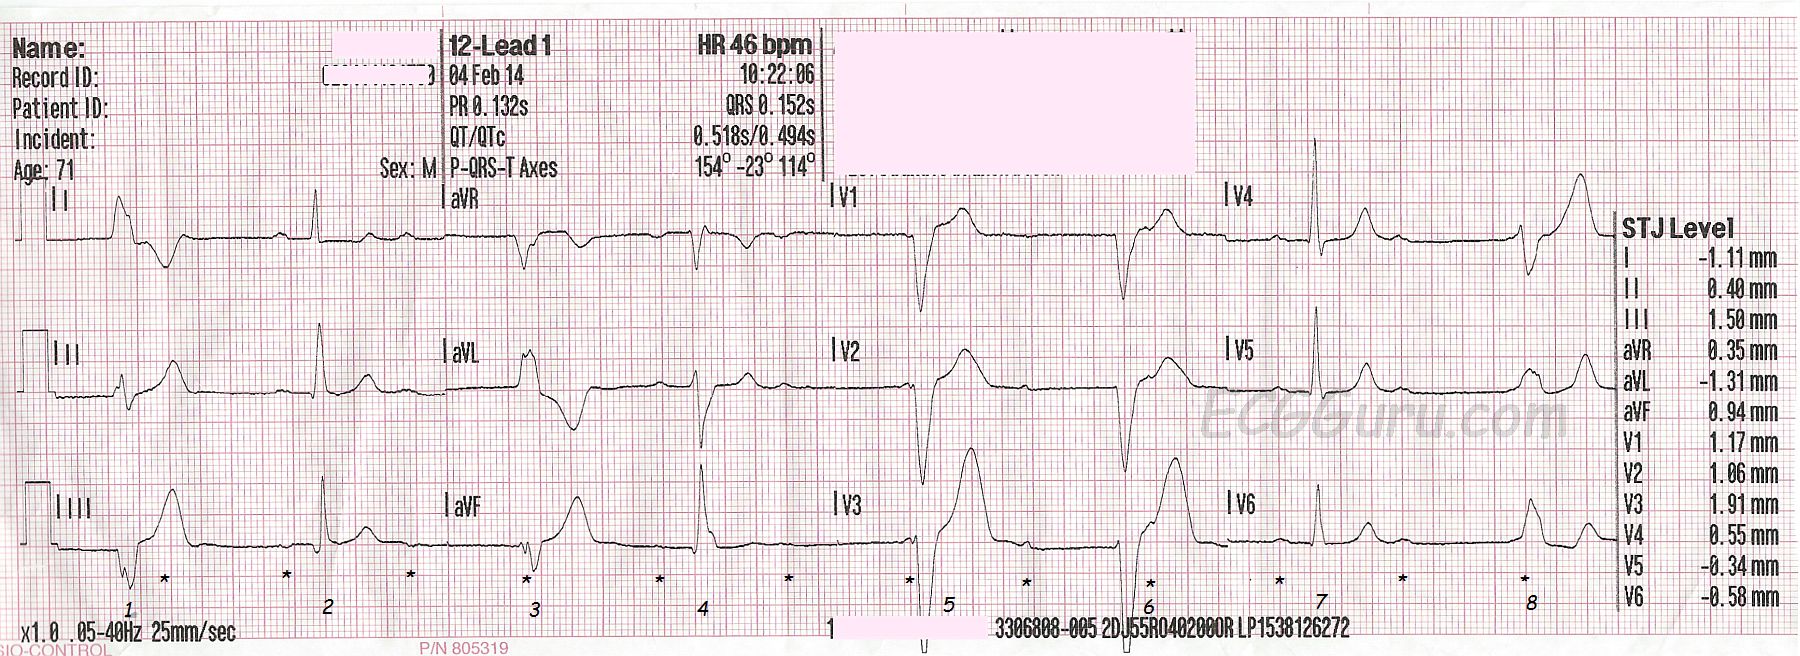
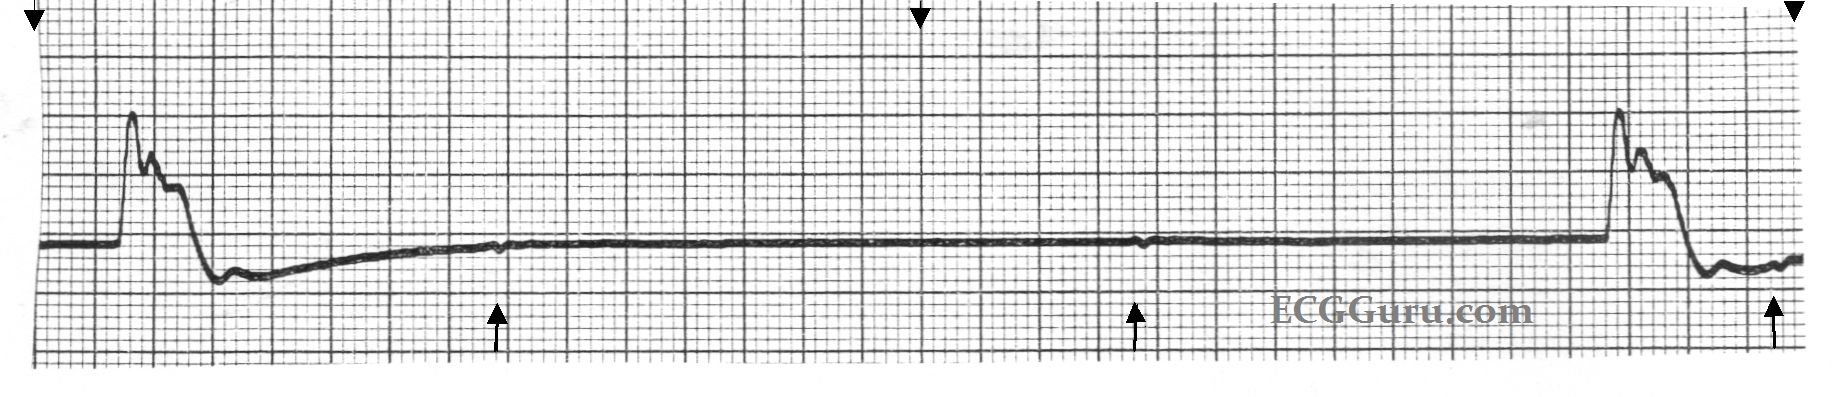
This series of two ECGs was taken from a 71-year-old man who complained of dizziness and near-syncope the day before these ECGs were done.  He was seen in an Emergency Dept., and advised to follow up with a neurologist. On the day of these ECGs, still feeling dizzy and like he would pass out, he called EMS again.  He denied chest pain.  We do not know his past medical history.  The first ECG was taken at 10:22 am.  His BP was 177/76 and SpO2 99%.  It shows a regular sinus rhythm (p waves marked by small asterisks) at a rate of about 75 / min.  There is a high-grade AV block, meaning that some P waves are conducted (beats 2, 4, 7), but most are not.  In addition, he has an escape rhythm, probably ventricular, at a rate of just over 40 / min.  The overall effect of the escape rhythm is to keep the heart rate above 40 beats per minute.

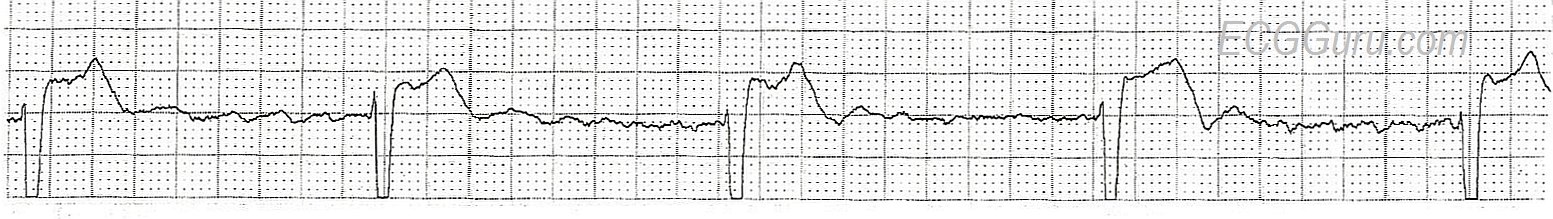
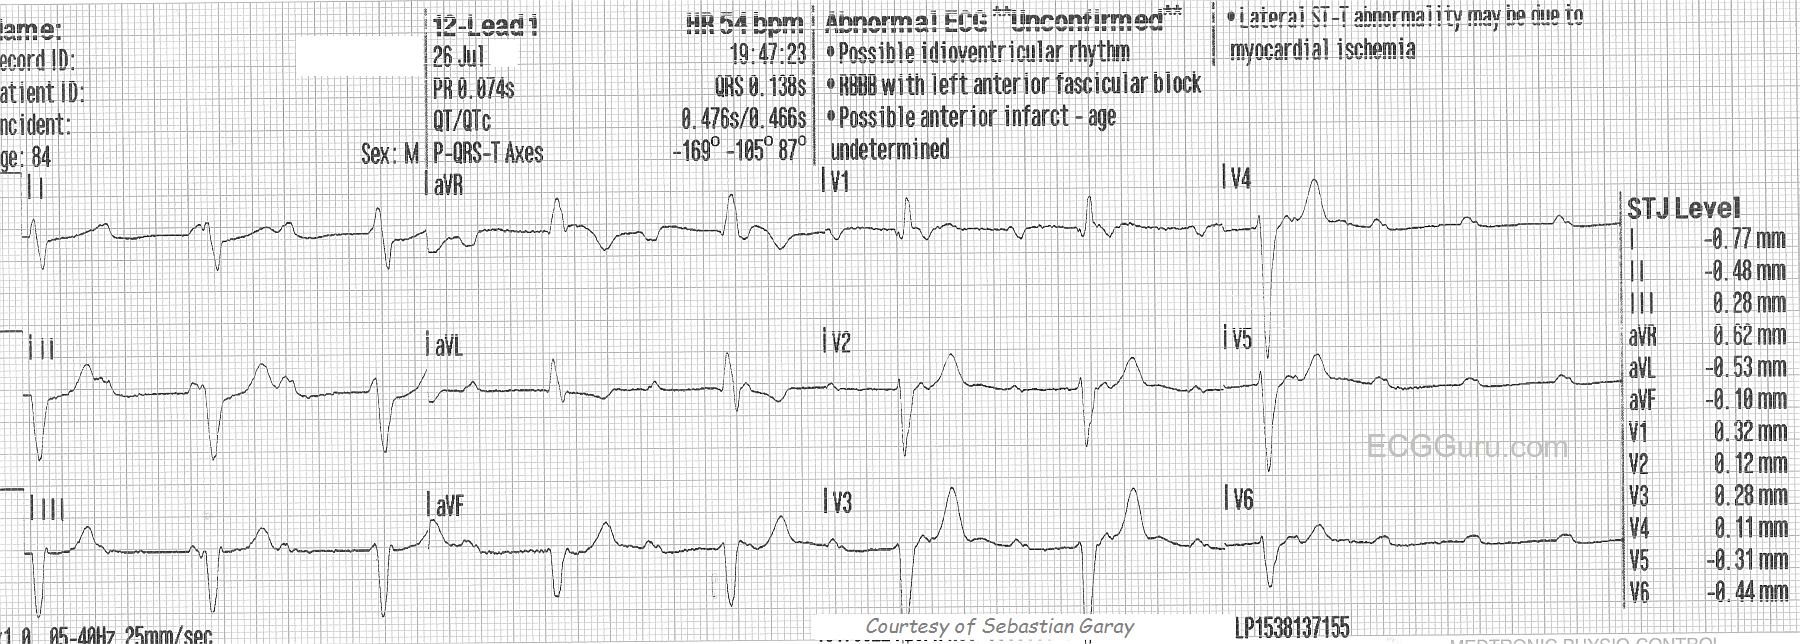
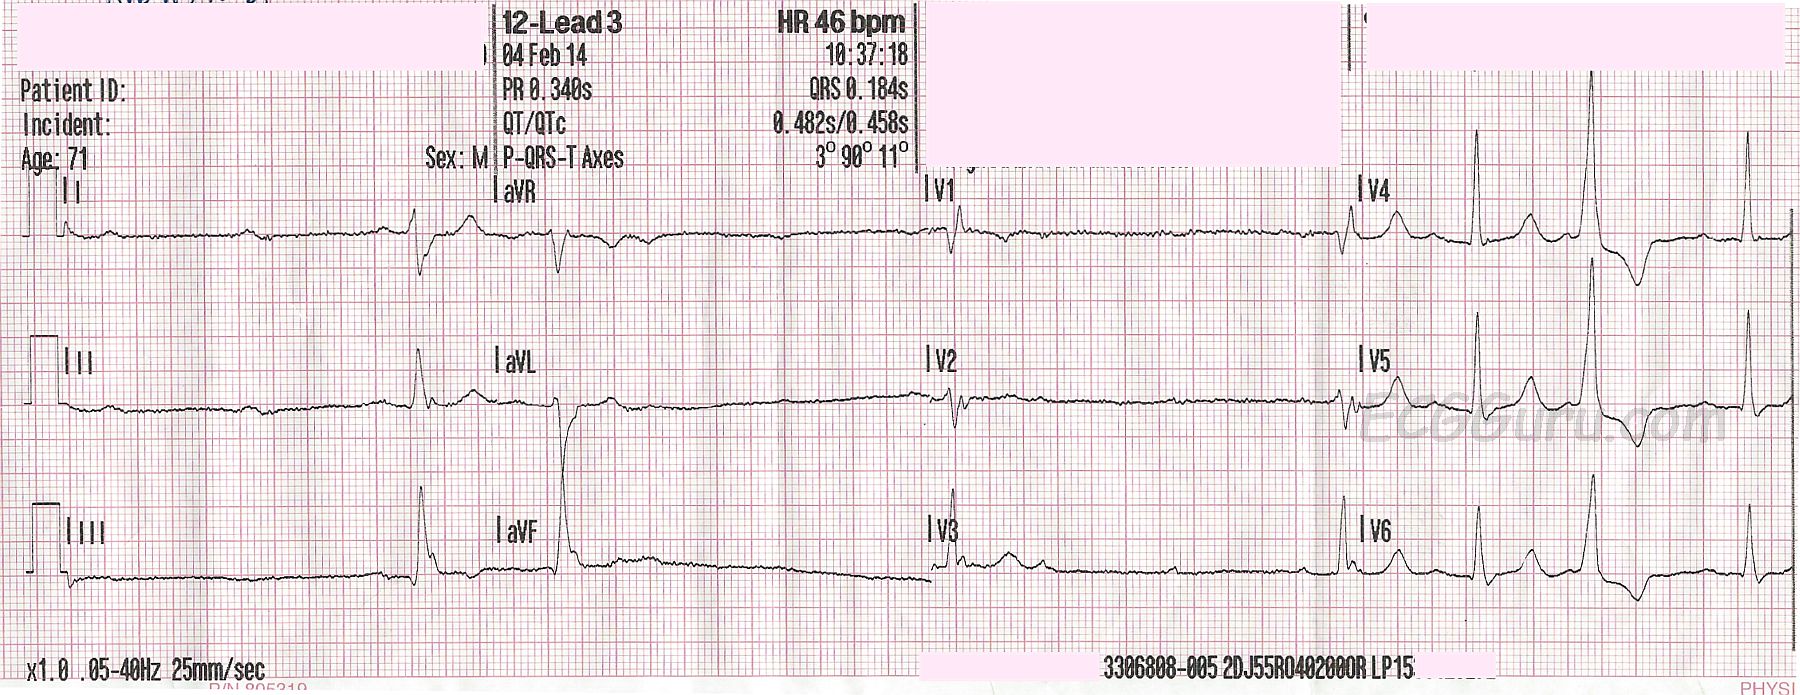
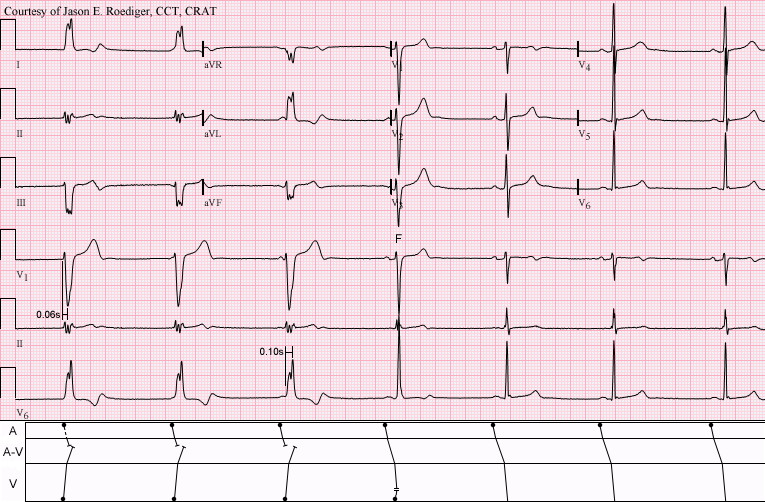
Fifteen minutes later, at 10:37 am, another ECG is taken.  The patient's BP is 154/86.   This ECG shows the high-grade AV block quite well, but this time, most of the QRS complexes on the strip are conducted from P waves.  It is difficult to see all the P waves in every lead, but if you remember that all three channels are run simultaneously, you will find evidence of the P waves in at least one of the three leads represented at any given time.  (Example:  V1, V2, and V3 - V3 shows the P waves well).  The next-to-last QRS on the page is interesting, as it has a different PRI than the normally conducting beats.  Is this a fusion beat or an aberrantly-conducted one?   It probably does not matter to the outcome of the patient. 

The slowing of the rate in the second strip gives us a clue as to why the patient felt dizzy, but the blood pressures recorded did not catch hypotension.  Possibly if the patient had been standing instead of lying on a stretcher, we would have seen more hemodynamic changes.

Unfortunately, we do not know the outcome of this patient, but it seems he is a candidate for an implanted pacemaker.

Dawn's picture

ECG Basics: Idioventricular Escape Rhythm

This six-second monitor strip was from a patient who was designated "Do Not Resuscitate", and whose heart rhythm was slowing dramatically.  It shows an idioventricular escape rhythm, with very wide QRS complexes and only two complexes in six seconds. (The top arrows mark three-second segments.)  If you look closely at the points marked by the lower arrows, you will see small, uniform, regular P waves.  The mechanism leading to this agonal rhythm was complete heart block.  A longer strip would show the P waves as all alike, and fairly regular, but slowing.  

jer5150's picture

Jason's Blog: ECG Challenge of the Week for Oct. 28th - Nov. 4th.

This is one of five consecutive serial ECGs that I performed several years ago on a patient in our Outpatient ECG Lab.  The patient was asymptomatic and the ECG was ordered as "Routine" by the patient's Primary Care Provider (PCP).  I deliberately "froze" the tracing on the screen and captured this image because I wanted to show a transition on the ECG.

No clinical patient data available.

What does this tracing show?  Choose the correct answer from the list below.

All our content is FREE & COPYRIGHT FREE for non-commercial use

Please be courteous and leave any watermark or author attribution on content you reproduce.