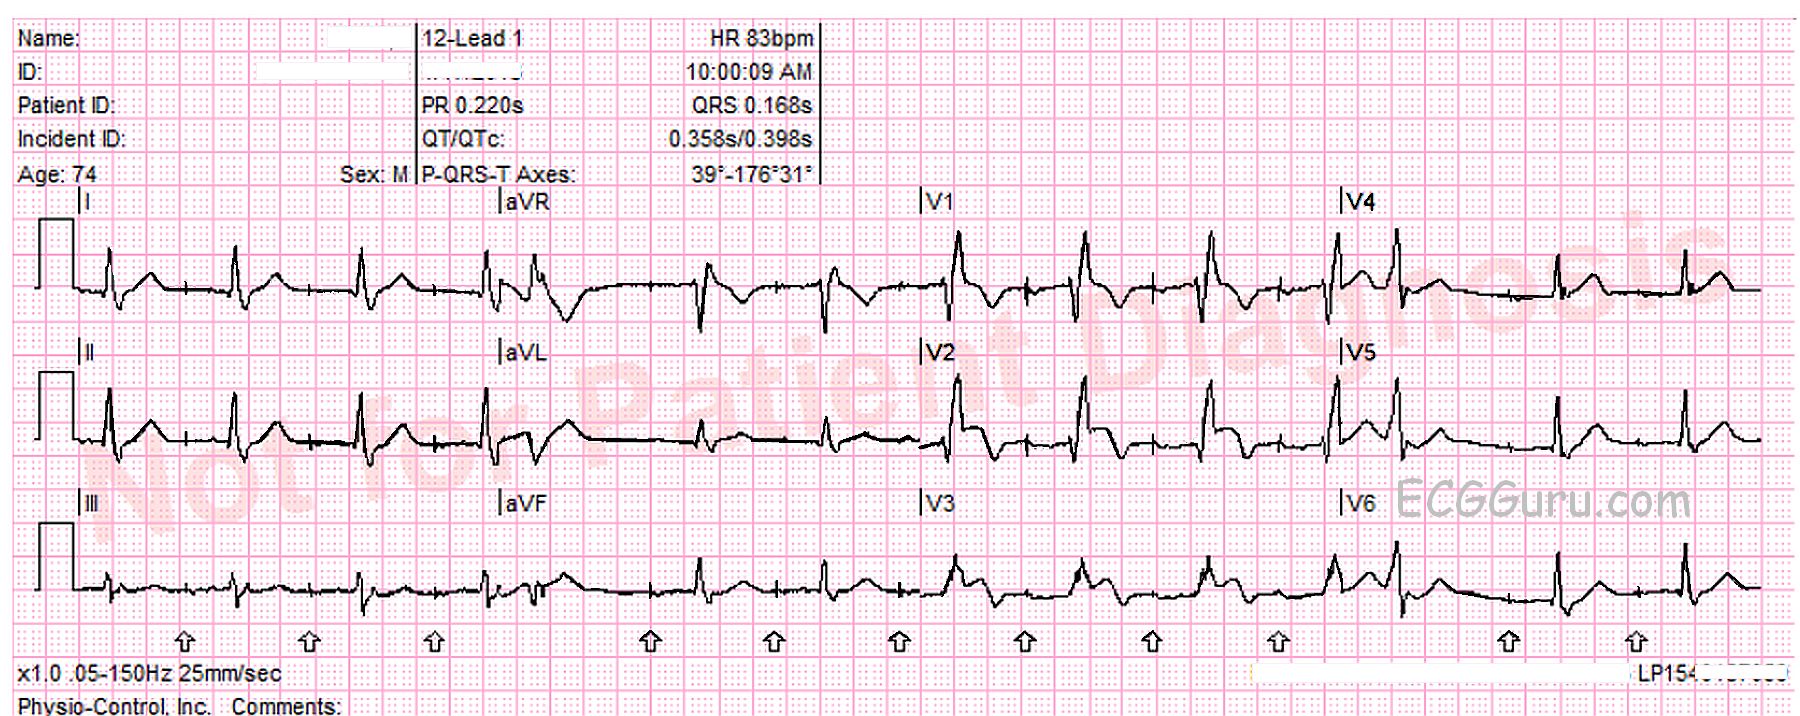
Today’s ECG is from a 74-year-old man for whom we have no clinical information. It shows a “classic” right bundle branch block. It also shows an example of the ECG machine getting some of the interpretation wrong. An early mistake in the interpretative algorithm caused a cascade of inaccuracies.
REVIEW of RIGHT BUNDLE BRANCH BLOCK ECG CRITERIA
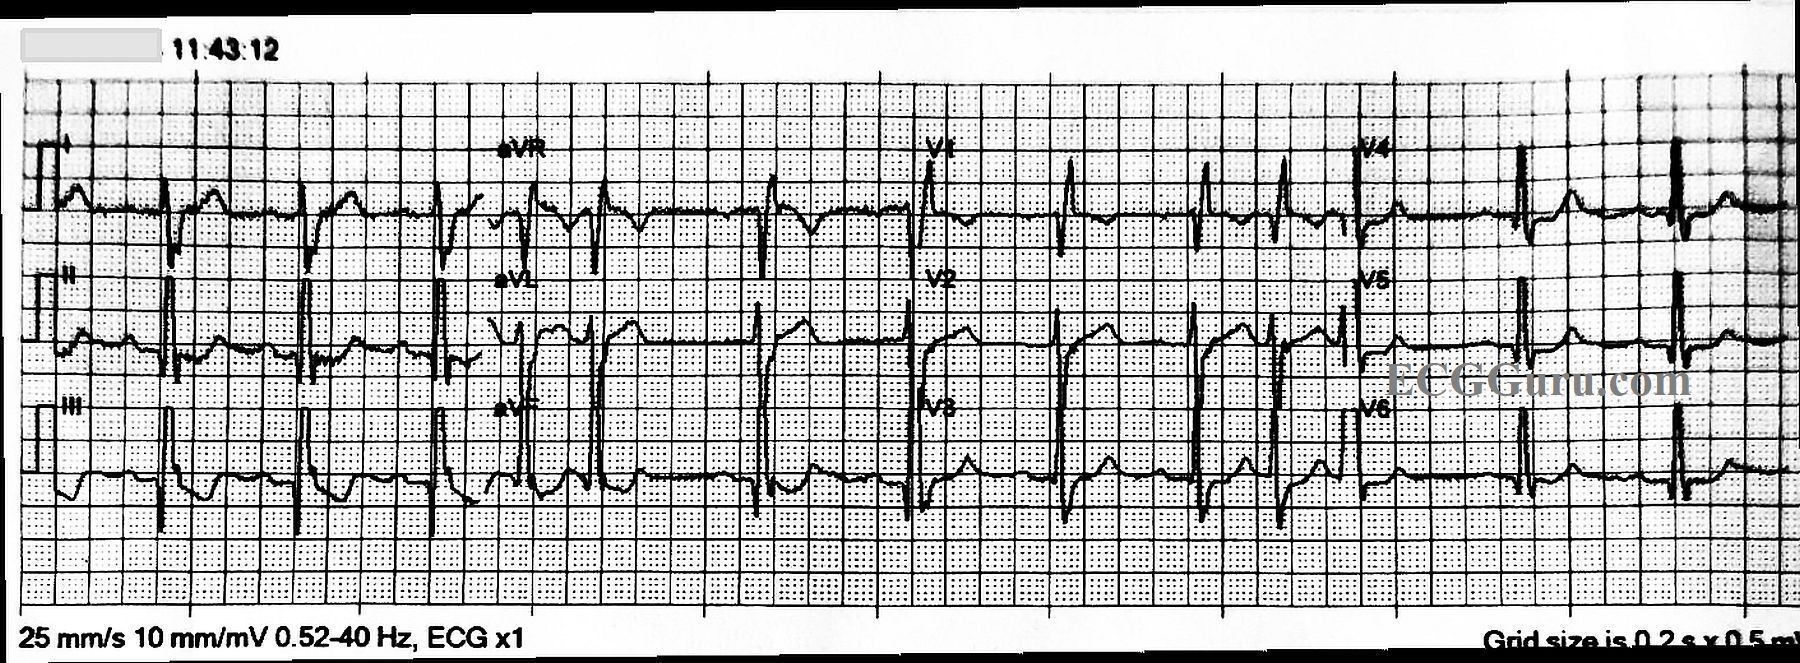
* Supraventricular rhythm
* QRS .12 seconds (120 ms) in width
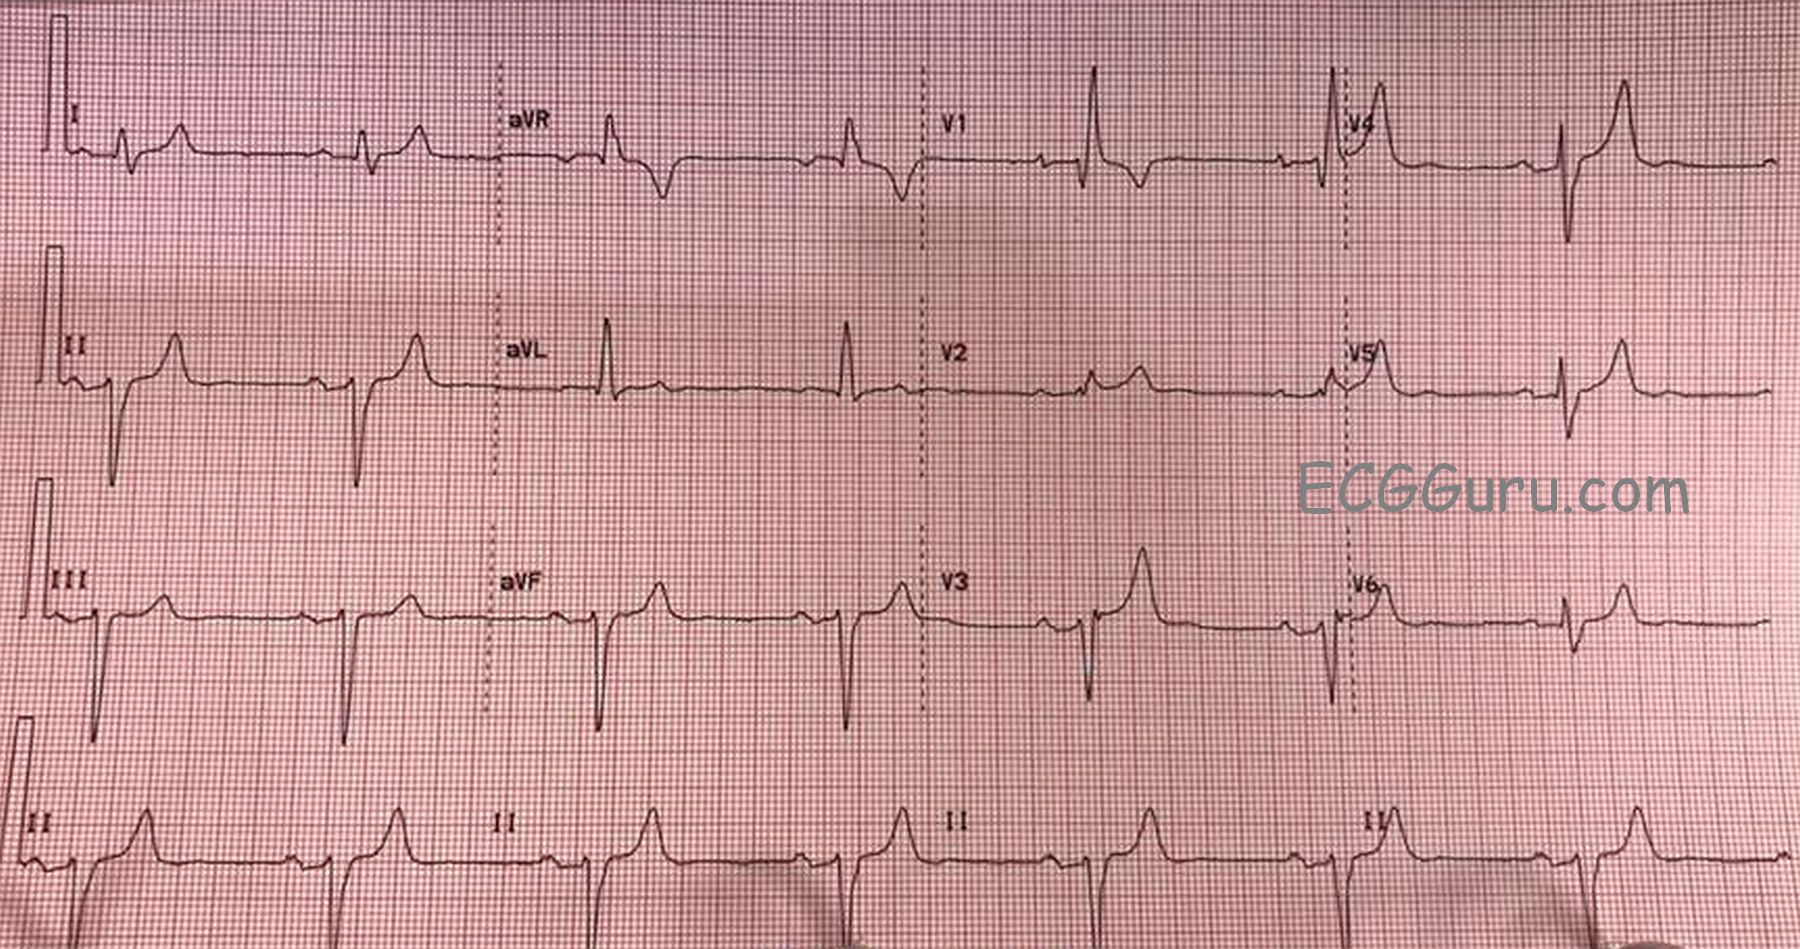
* rSR’ pattern in V1
* Small, wide S wave in Leads I and V6
In right bundle branch block, the initial part of each QRS complex represents the depolarization of the septum and left ventricle. The right ventricle depolarizes late, and is represented by a terminal wave at the end of each QRS. In V1, that terminal wave is the R’ and in I and V6 it is the small S wave.
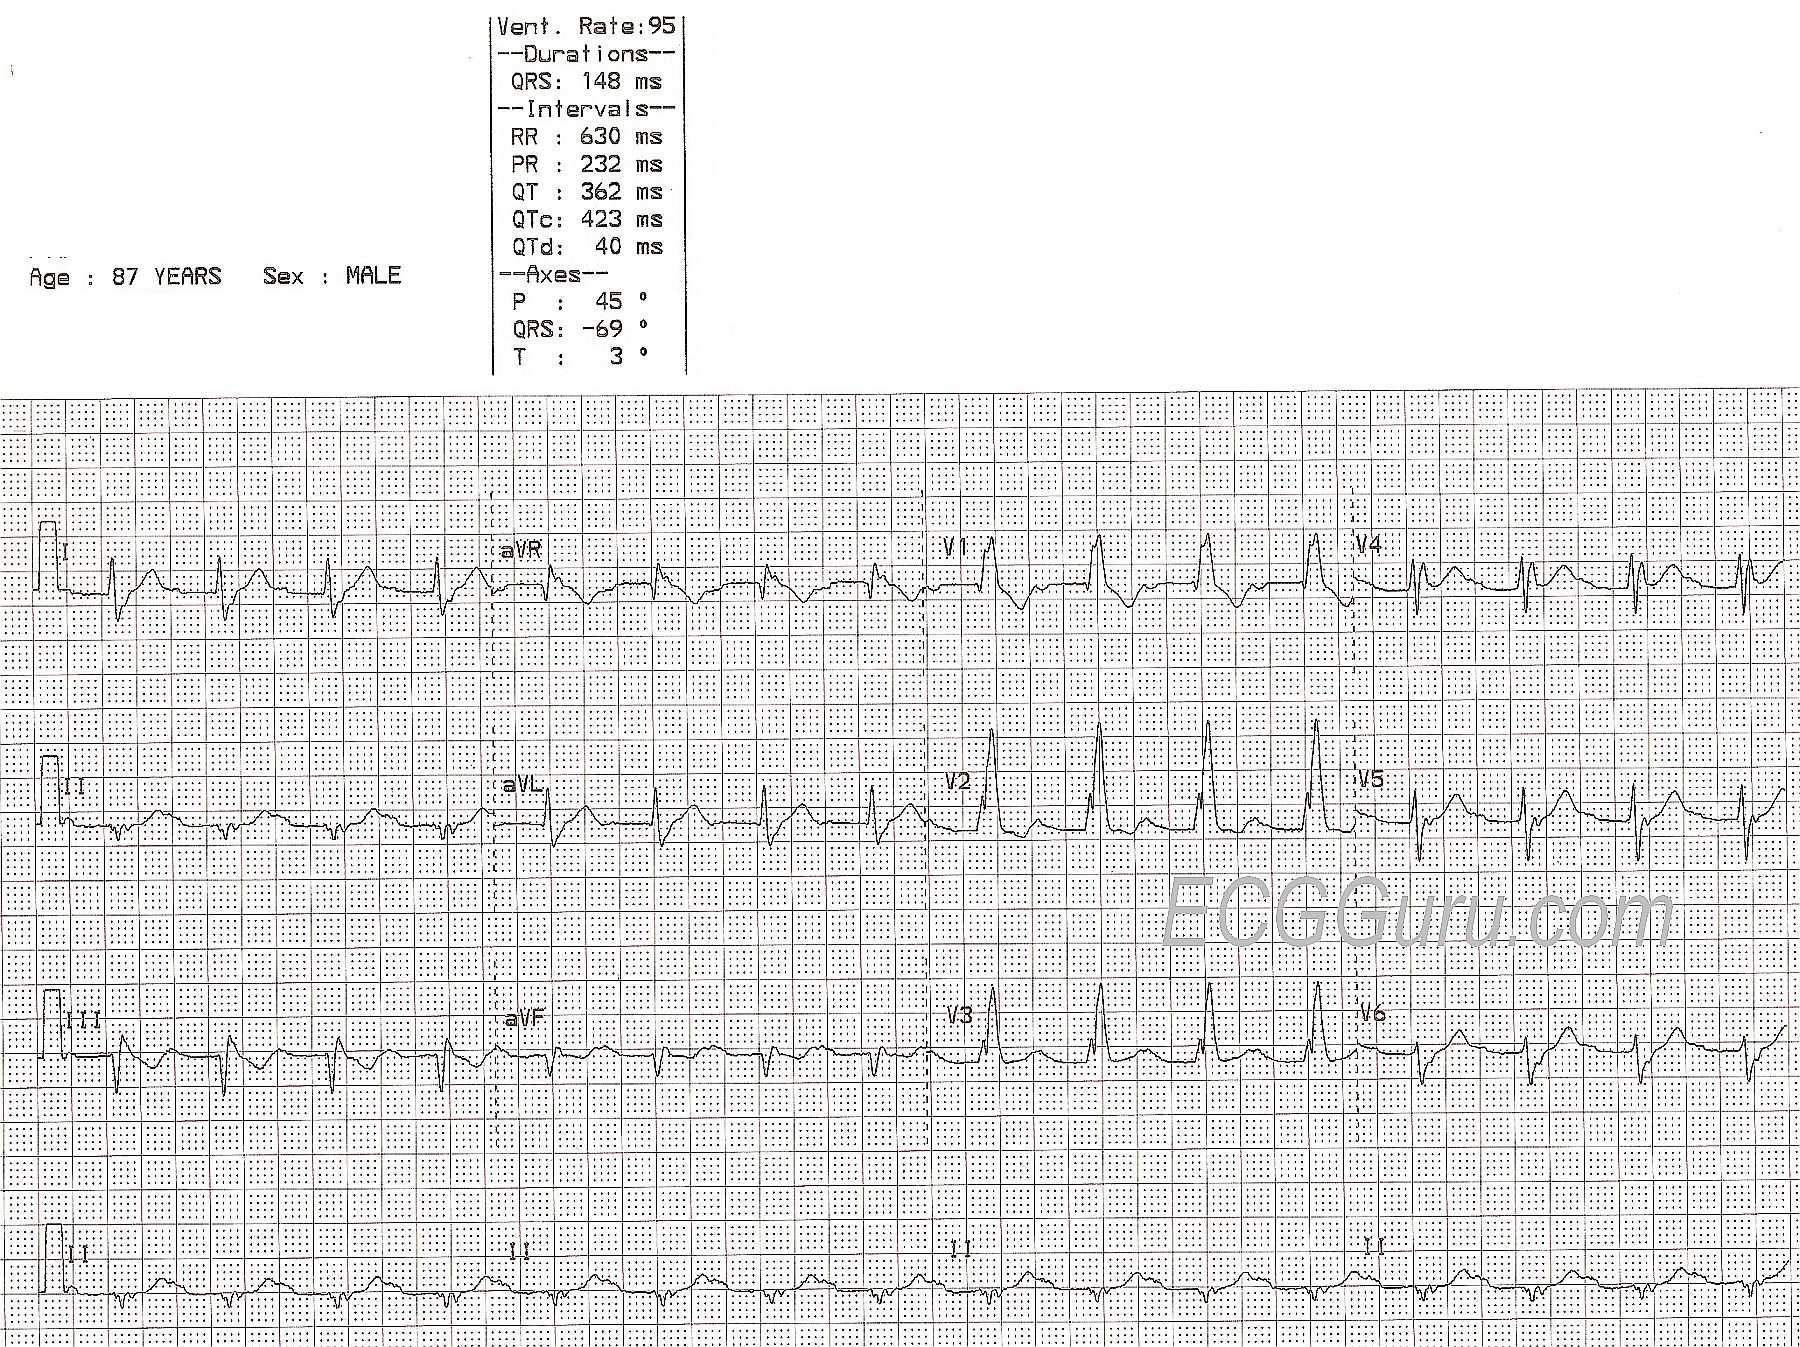
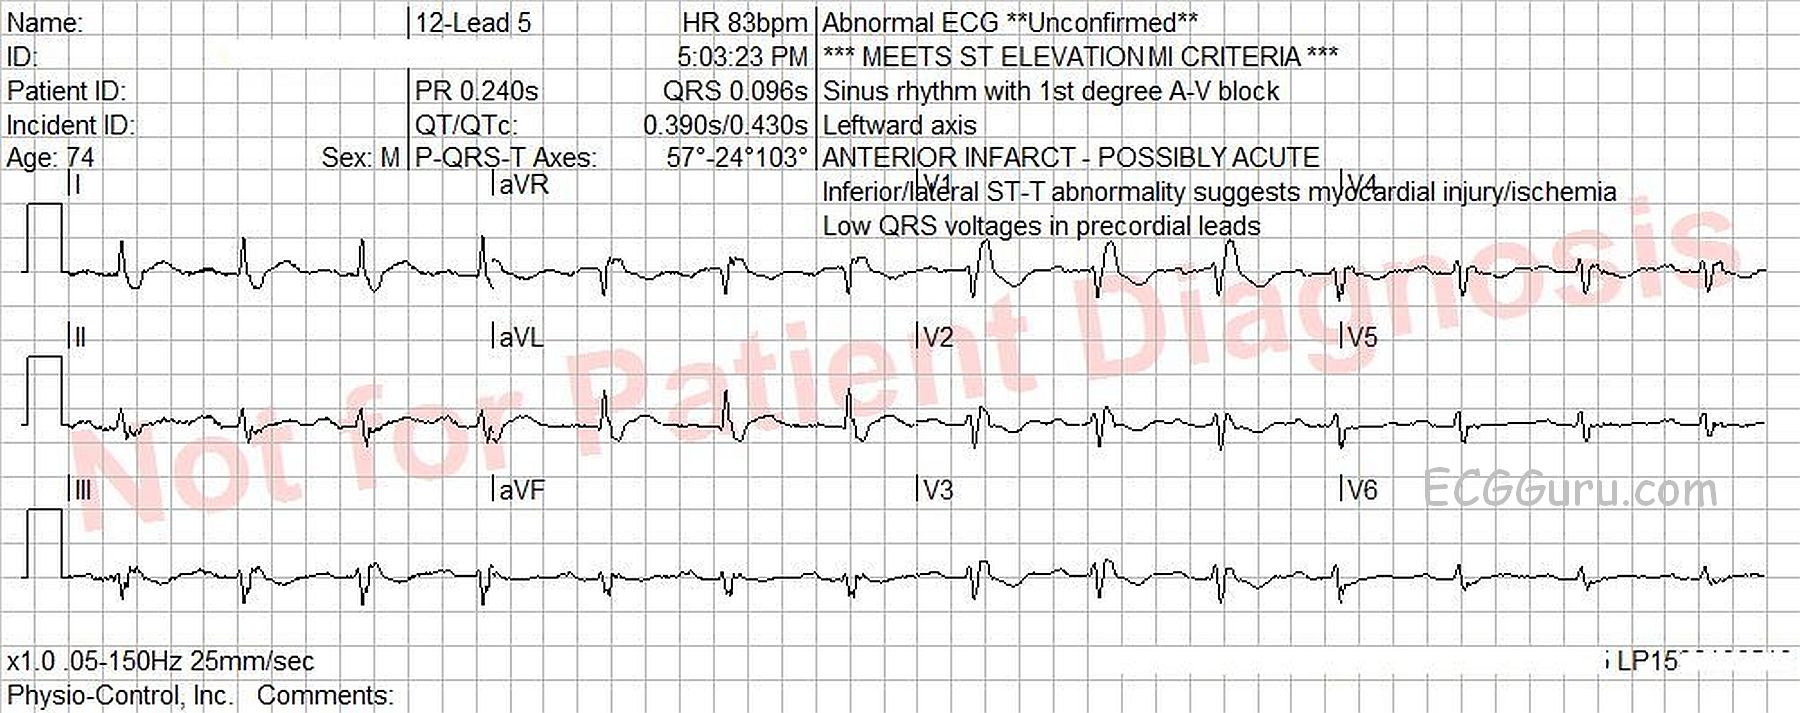
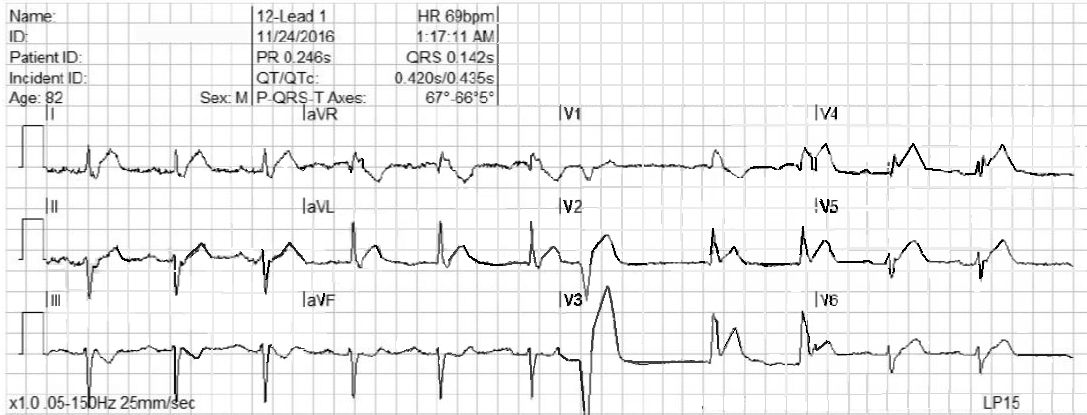
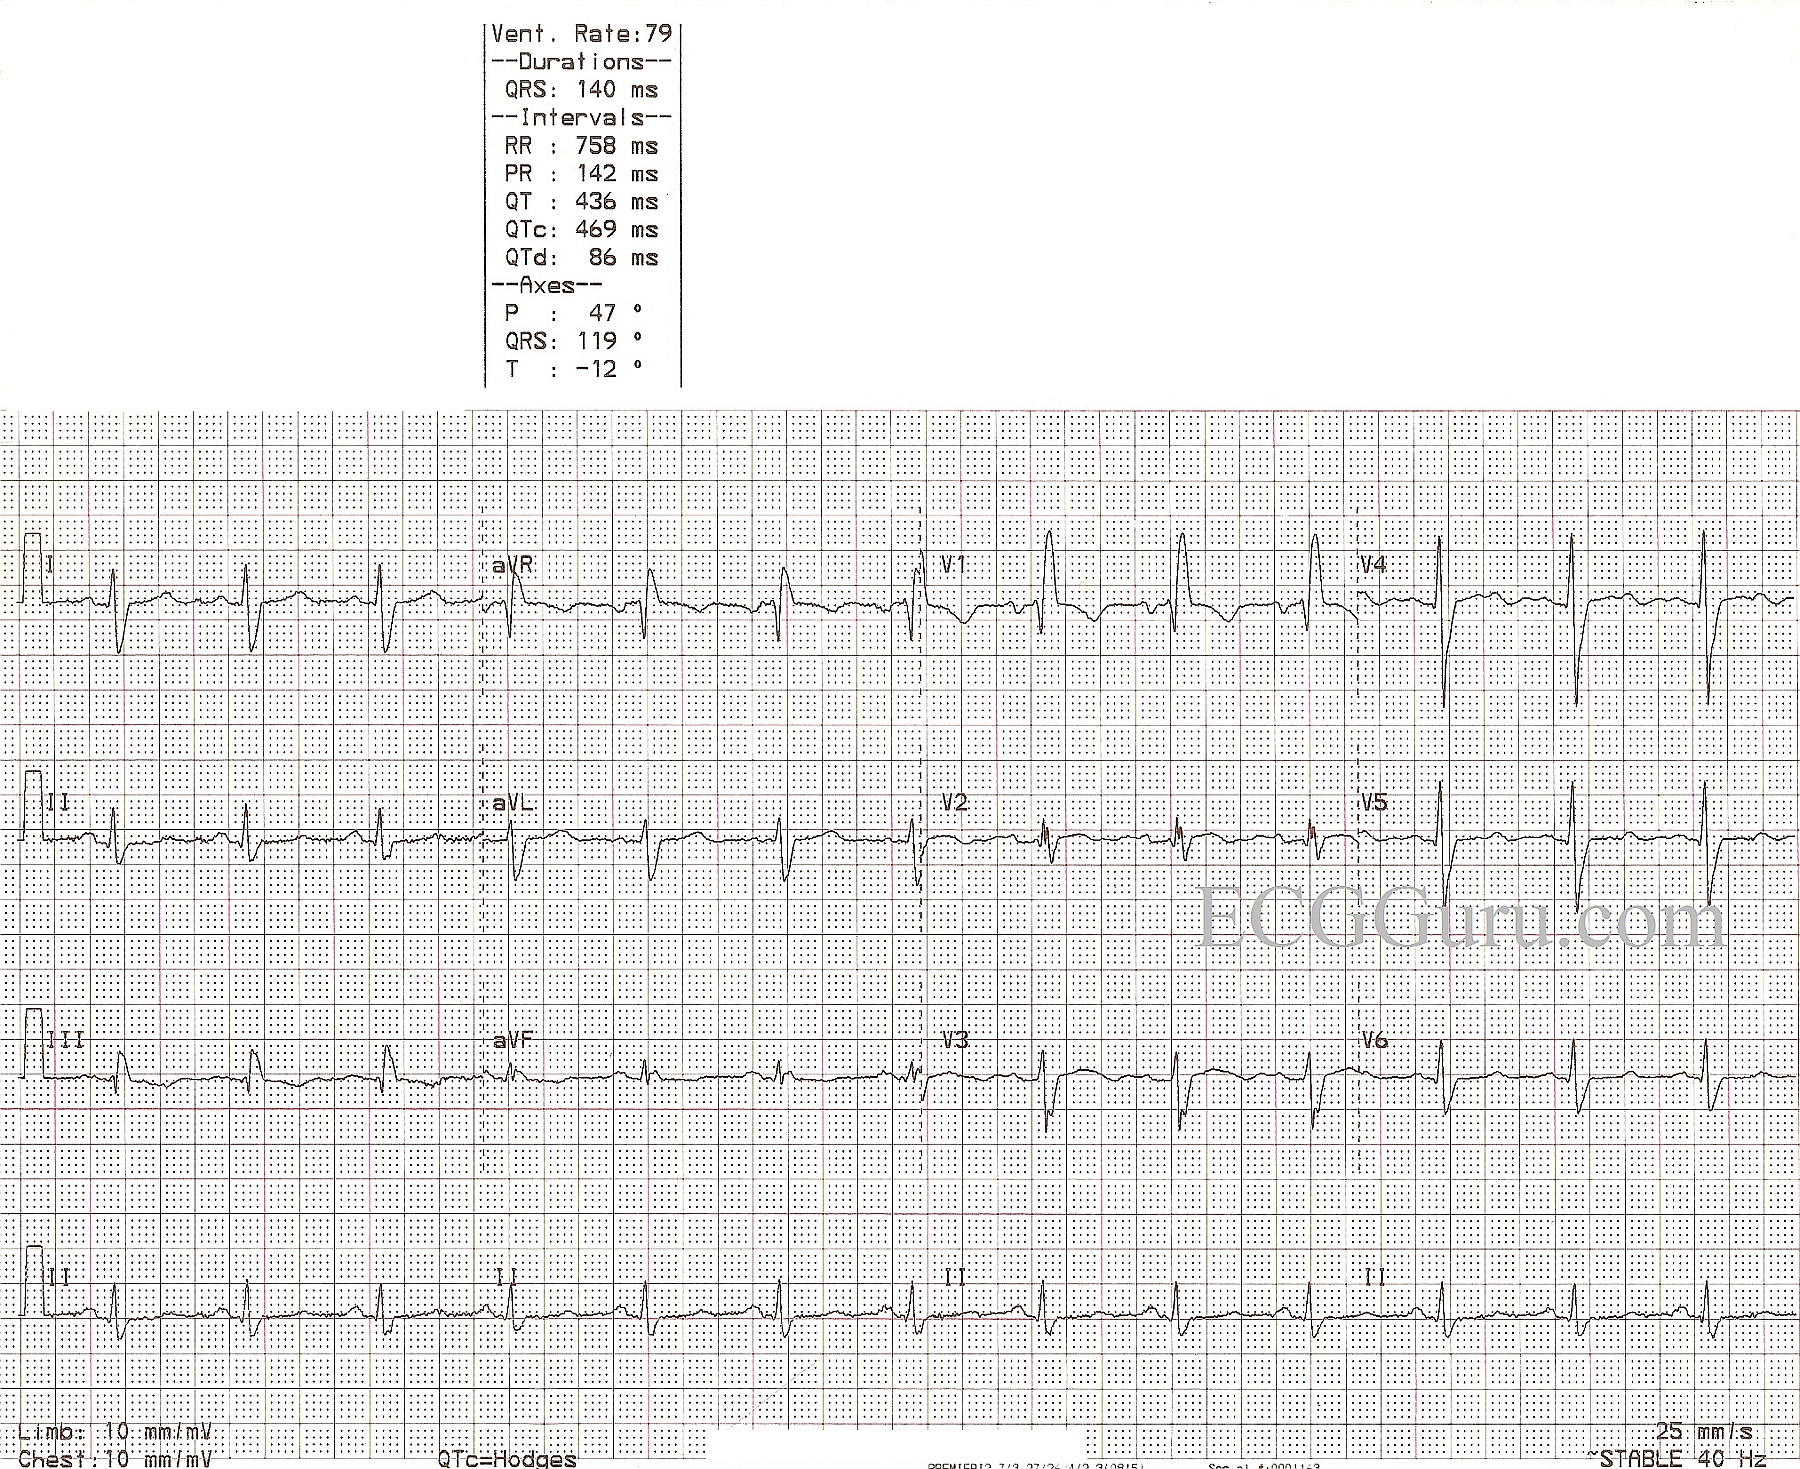
MACHINE MISTAKES The first mistake the machine made was in measuring the QRS width. The machine says the QRS is .096 seconds (96 ms). It is actually about .16 - .18 seconds. Look at the second QRS in V1, and you will see that it extends almost the full width of a wide block (.20 sec). It is apparent that the machine measured only the left ventricular portion of the QRS complex. Because of this error, the right bundle branch block was not noted.
The mistake in measuring the QRS complex resulted in the machine misinterpreting the terminal wave as the ST segment. This resulted in notations in capital letters warning of ST elevation and presence of myocardial ischemia. The j points are actually at the baseline in all leads, indicating NO ST elevation.
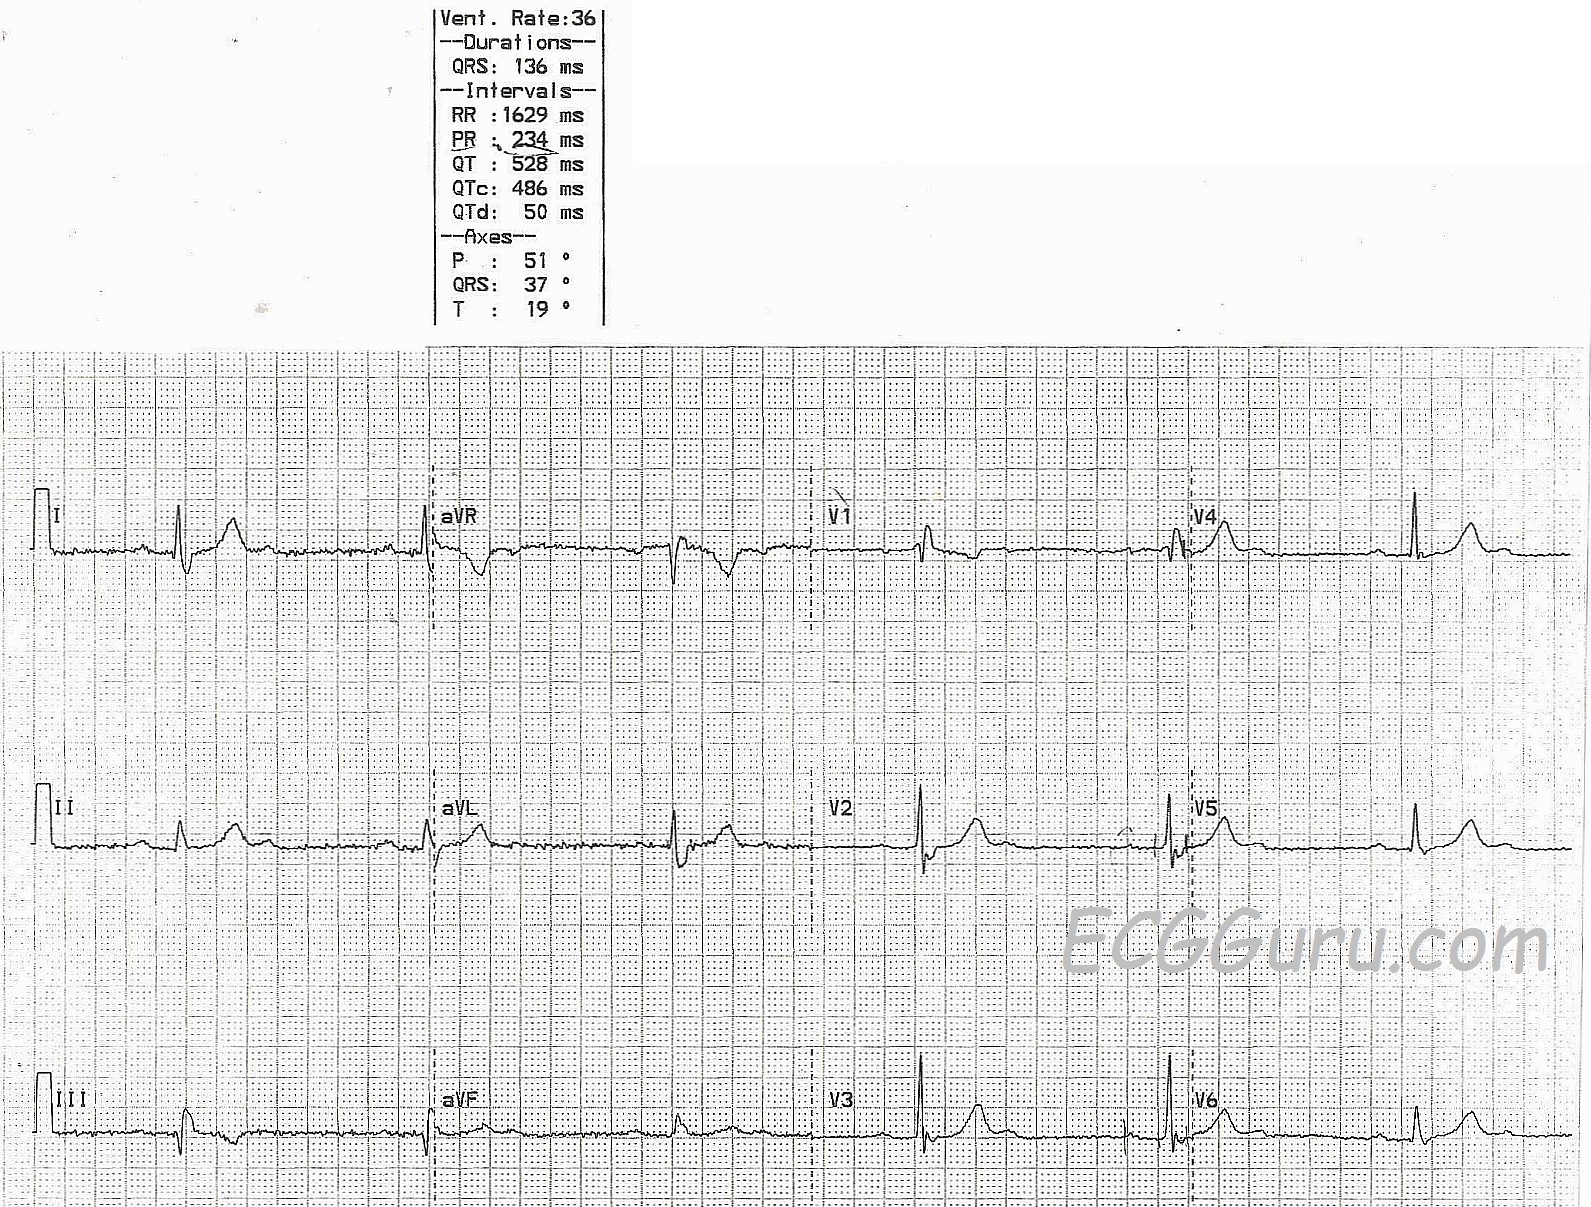
ST and T WAVE CHARACTERISTICS OF RBBB Typically, in RBBB, the T wave will be opposite in direction from the terminal (RV) deflection. So, when there is an R’, there will be T wave inversion. The j point of the ST segment will not be altered, as the ST segment reflects what is happening in the LEFT VENTRICLE, which is depolarizing normally. That means that an acute ST elevation M.I. will look the same in RBBB as it does without BBB.