Displaying 1 - 10 of 47
Dawn's picture

Supraventricular Tachycardia With Wenckebach Conduction

This ECG was obtained from a patient in a walk-in health clinic.  We do not have any other information on the patient.  We thank Joe Kelly for donating this interesting ECG to the GURU. 

IRREGULAR RHYTHM    If you march out the P waves, you will see that they are regular, at a rate of approximately 130 bpm.  But the QRS complexes are not regular, and there are fewer QRS complexes than P waves.  

WENCKEBACH CONDUCTION   Looking closely at the PR intervals, you will notice that they progressively prolong.  This “pushes” the QRS complexes progressively toward the right.  Eventually, the T wave – and the refractory period – will land on the next P wave.  That P wave will be unable to conduct to the wave, and no T wave of course, so the next P wave will conduct with a shorter PR interval.

We are including a short rhythm strip from this patient, with conduction marked with a laddergram. 

Dawn's picture

Sinus Rhythm With Ectopy

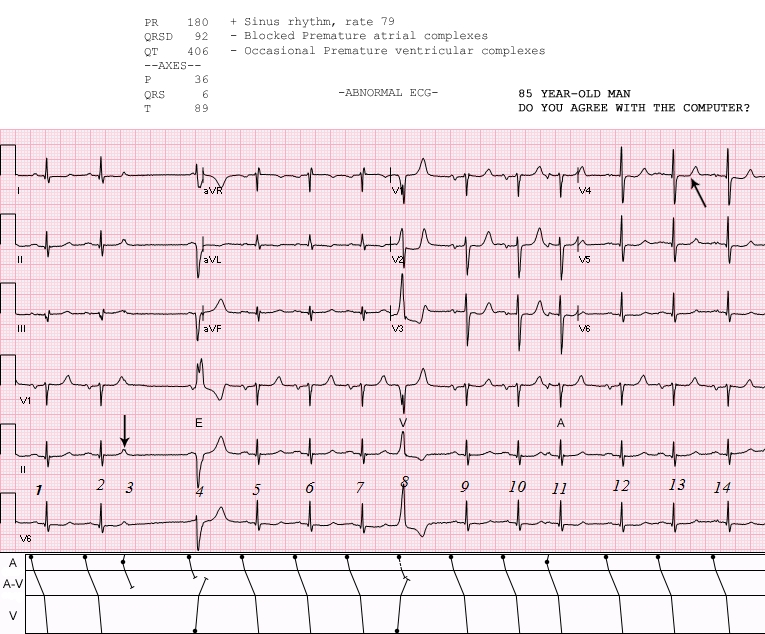
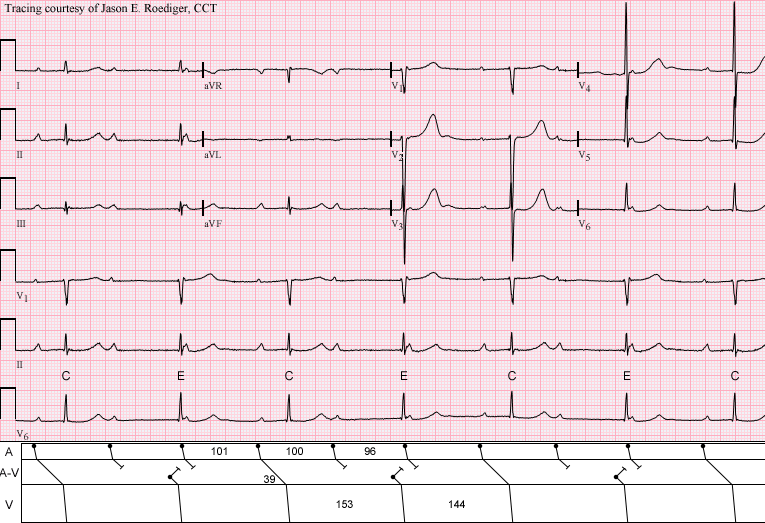
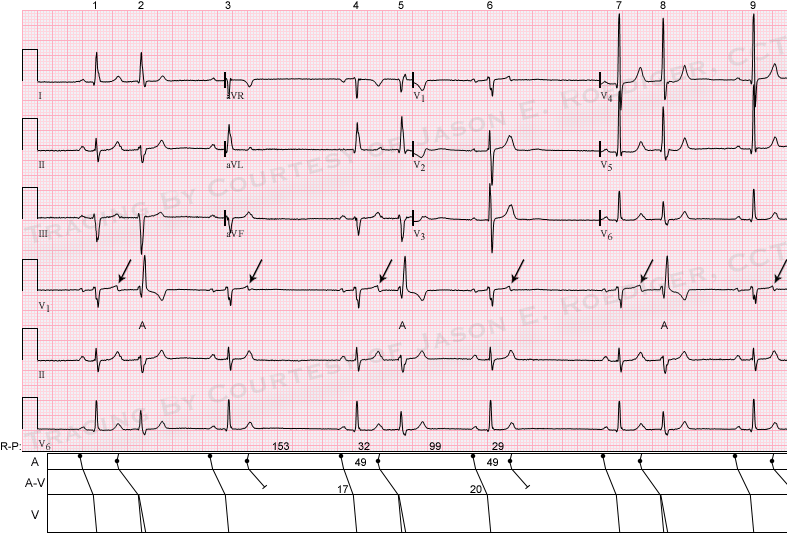
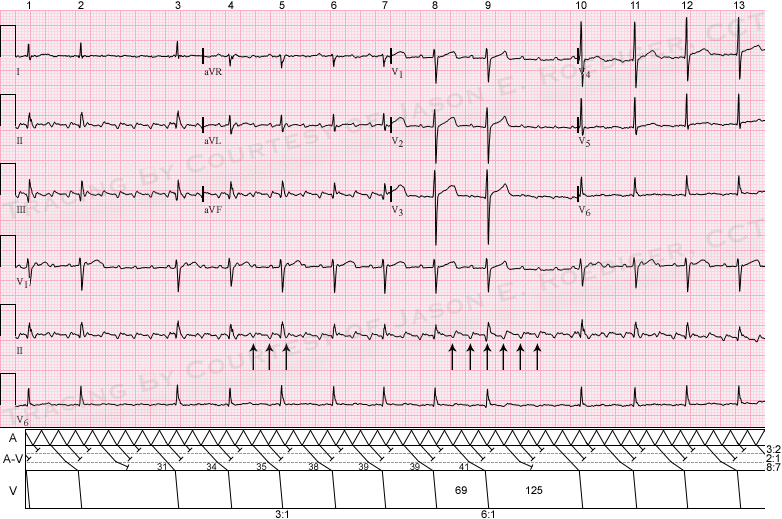
We originally published this ECG in 2012.  It was generously donated to the ECG Guru website by our friend and ECG Guru Extraordinaire, Jason Roediger.  We are re-publishing it today, as it is a great ECG for illustrating how helpful laddergrams can be for showing conduction in dysrhythmias.

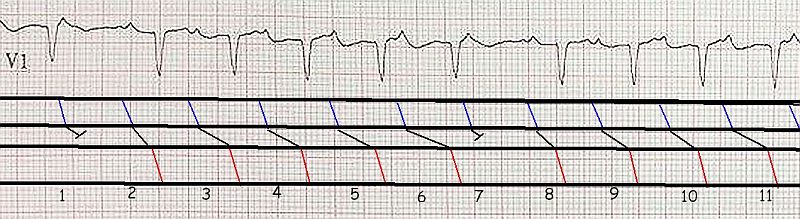
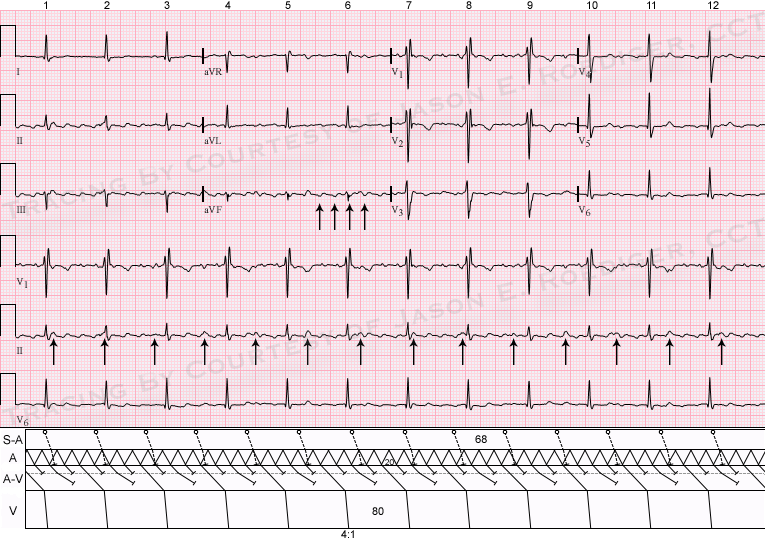
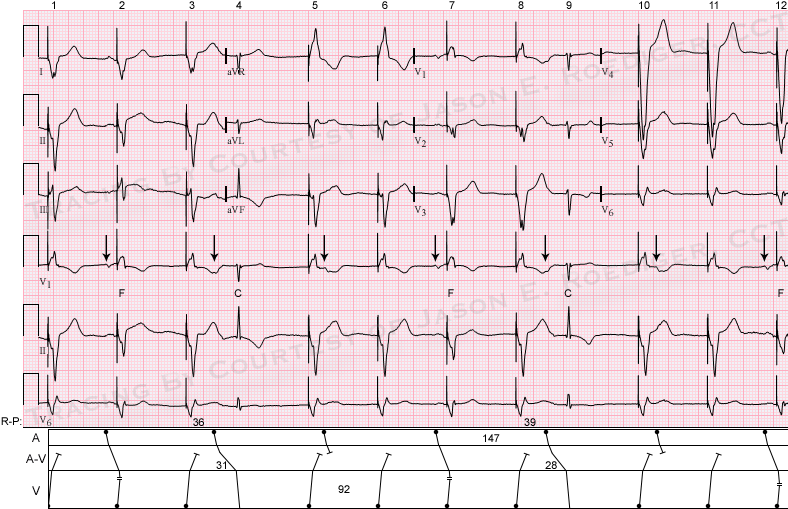
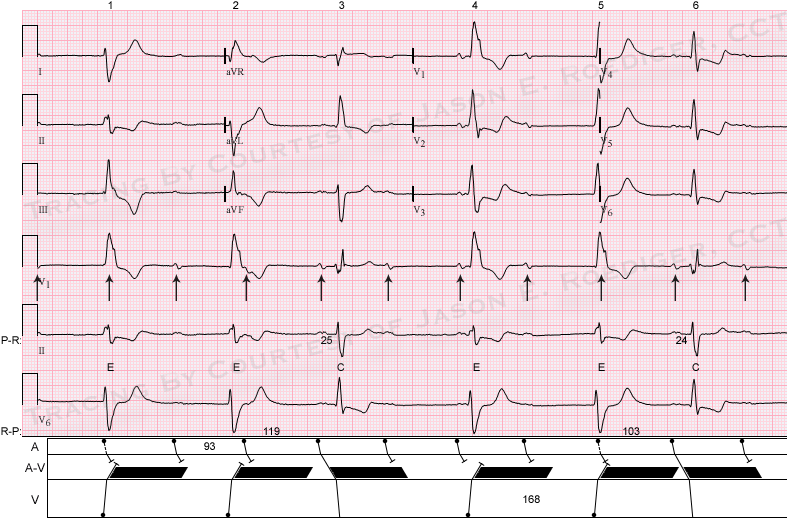
This ECG has something for everyone:  The rhythm is sinus, and there is a non-conducted PAC (beat number 3) after the second beat.  Just after the next P wave, there is a ventricular escape beat which prevents that P wave from making a QRS.  The eighth beat is a PVC.  The eleventh is a conducted PAC.  You can use this ECG to illustrate for your students the concepts of "escape" beats, refractory periods, and premature beats.

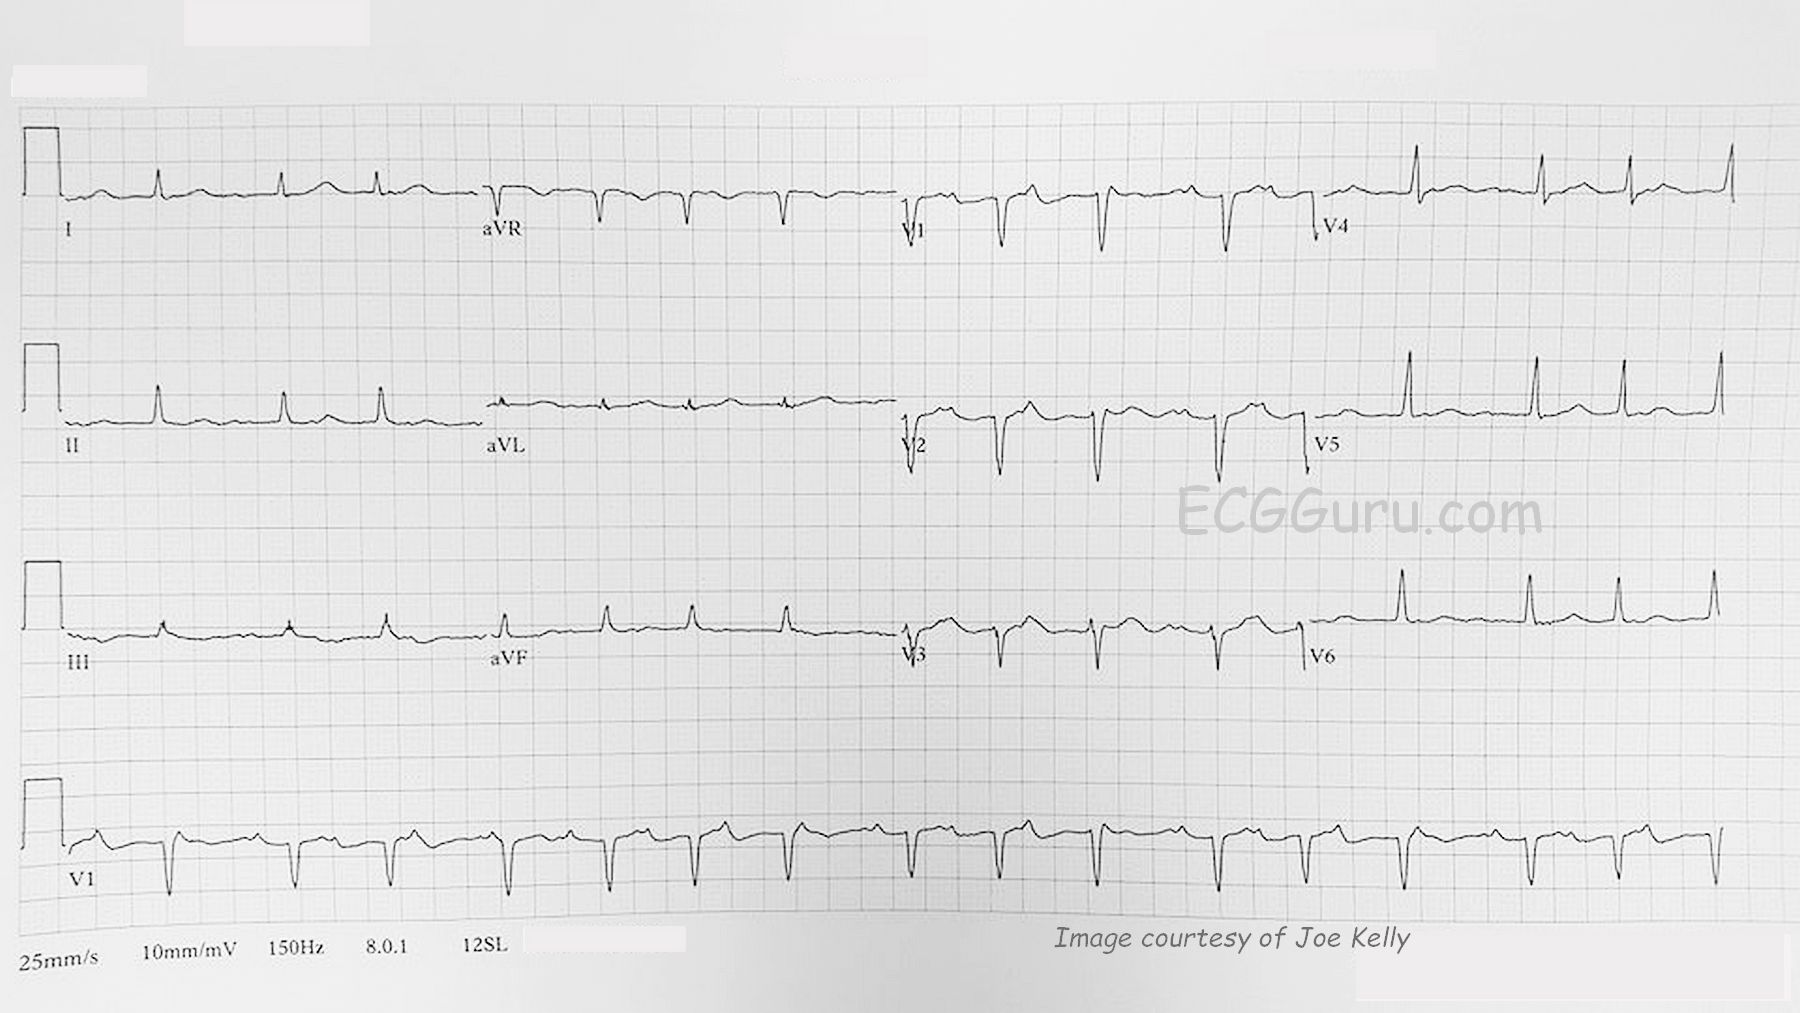
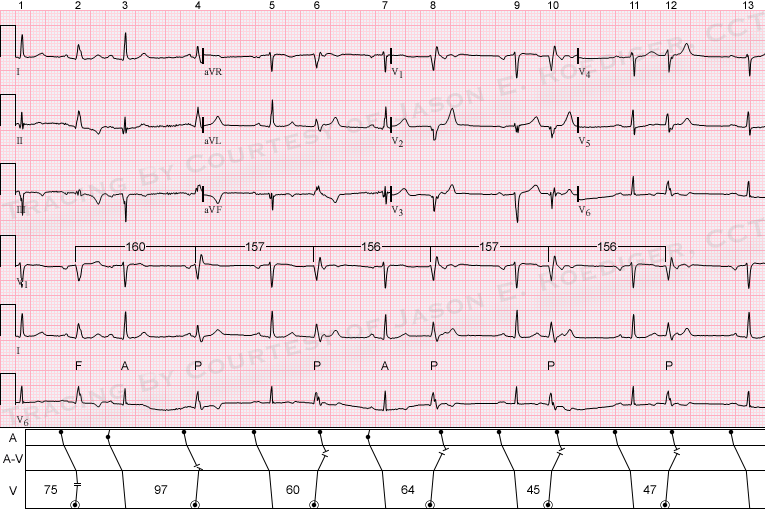
There are ST changes that suggest coronary artery disease: the ST segments are flat in shape with a tiny amount of elevation in V1 through V4.  The axis is normal, at the border of normal and left axis. It is difficult to see, but there appears to be a tiny r wave in Lead III, so we cannot say for sure if there is or was a pathological Q wave in that lead.

The P waves are wide and "double" in Lead II and biphasic in V1, suggesting LV failure or mitral valve disease.  However, the criteria for LV hypertrophy are not met.

Dawn's picture

Are You New to Laddergrams?

A laddergram is a diagram of conduction through the heart, presented in a minimum of three tiers, one for the atria, one for the AV junction, and one for the ventricles.  Laddergrams are very useful for presenting and testing your theory of a dysrhythmia.  Instructors often use them to illustrate complex dysrhythmia mechanisms.  

jer5150's picture

Jason's Blog: ECG Challenge for the months of July and August, 2014.

This is an ECG I performed a couple of years ago on an asymptomatic 83-year old man as an outpatient procedure. 

The computer interpreted this as:  "Marked sinus bradycardia [with] Frequent Premature ventricular complexes".  IS THE COMPUTER CORRECT?  Is there more than one plausible interpretation?  What is the differential diagnosis?

jer5150's picture

Jason's Blog: ECG Challenge for the month of May, 2014.

Patient data:  54-year old man who recently underwent a major cardiac procedure.  At first glance, this ECG may not appear to be particularly unique but a closer inspection reveals something unusual going on here. 

jer5150's picture

Jason's Blog: ECG Challenge for the month of January, 2014.

Patient data:  64-year old man who, prior to this ECG, had been in normal sinus rhythm.  Whatever your level of sophistication in rhythm interpretation (i.e., basic, intermediate, or advanced), this ECG has a little bit of something for everybody.  Basic interpreters will undoubtedly recognize the dominant disturbance of rhythm.  Intermediate interpreters will probably add more descriptors to their interpretation that will better describe the overall pattern.  Advanced interpreters will recognize the

jer5150's picture

Jason's Blog: ECG Challenge for the month of December, 2013.

The only patient data I have is that this ECG is from a 73-year old man.  At the request of the site administrator (Dawn Altman), I'm posting this ECG because there isn't one quite like it in the Guru's archives.  Some readers will recognize it as one I recently posted on another website.  This one lives up to the title of "Challenging".  I'll make the same general statement I did on the other website:  You'll need to make careful measurements with calipers on this ECG to come to the correct interpretation.

jer5150's picture

Jason's Blog: ECG Challenge of the month of November, 2013.

Sticking with the same general theme from my last ECG Challenge for the months of September and October, 2013.  This is more of a back-to-basics for some readers but will still challenge others.  No information for this patient other than it was an adult.  How would you interpret this?   

Pages

All our content is FREE & COPYRIGHT FREE for non-commercial use

Please be courteous and leave any watermark or author attribution on content you reproduce.