
Submitted by Dawn on Sat, 12/23/2023 - 21:15
The Patient: A 60-year-old man at work. He experienced a sudden onset of substernal chest pain, nausea & vomiting, and dizziness. He states the pain is a 5 on 1-10 scale. No cardiac history or current medications.
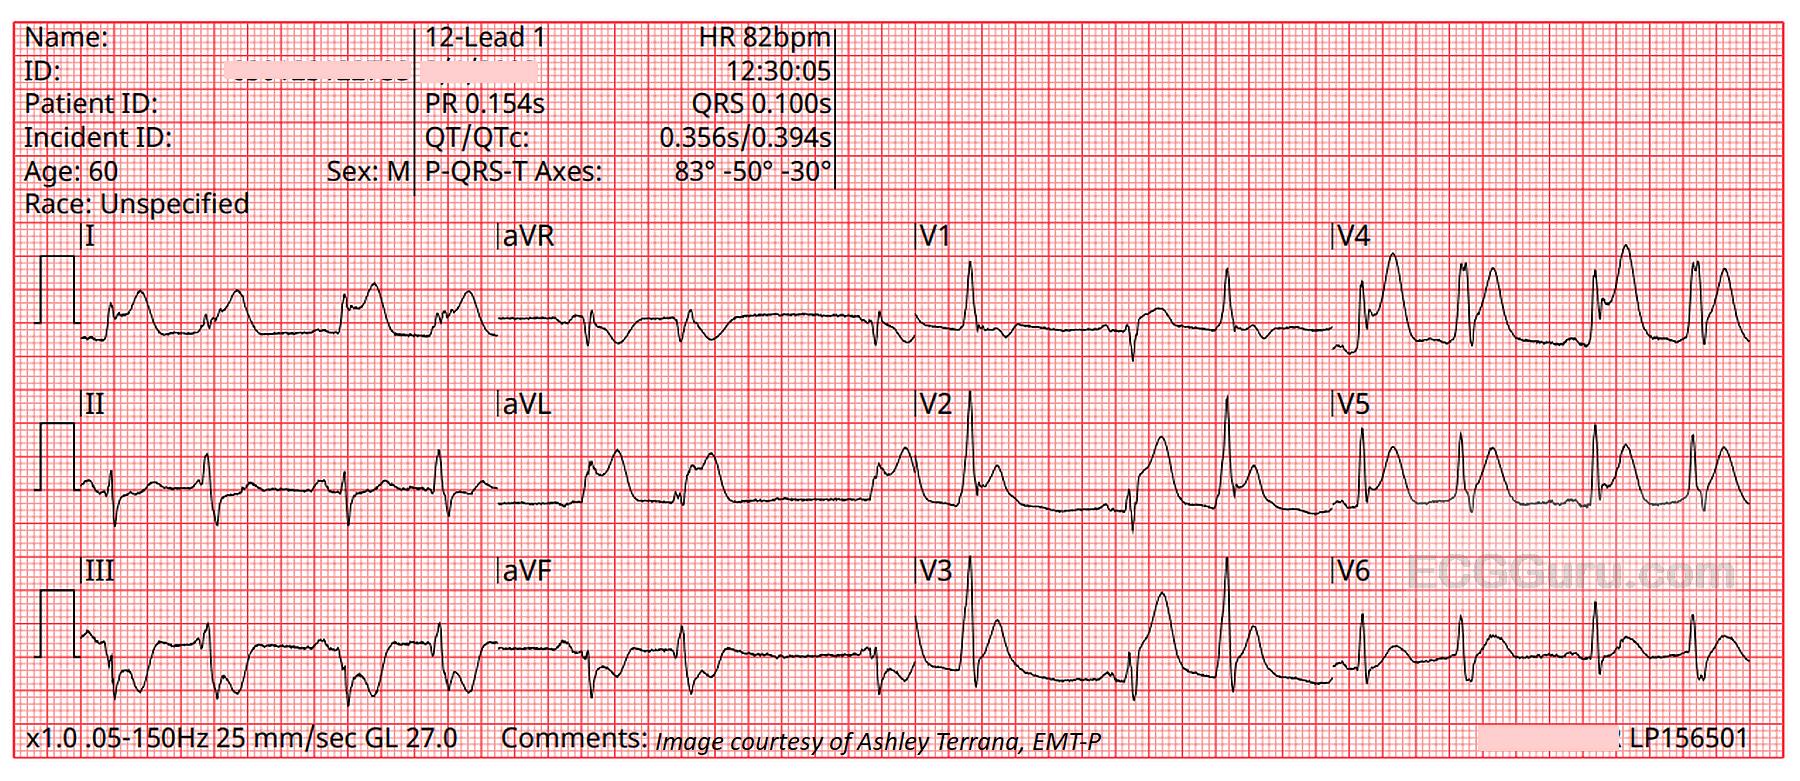
The ECGs: The first ECG, taken at 12:30:05, shows a sinus rhythm with ventricular bigeminy. In some leads, you can see the sinus P waves hidden in the beginnings of the PVCs, so we know the underlying sinus rhythm is about 82 bpm.
There is obvious ST elevation in V1 through V5, which is the anterior wall, an area perfused by the left anterior descending artery. Remember – the ST elevation sign may also show in the PVCs, but because ventricular beats have secondary ST changes of their own, we should assess only the sinus beats for ST changes.
There is also obvious ST elevation in Leads I and aVL. This is the high lateral wall, which is perfused by the circumflex and first diagonal arteries, both proximal branches of the left coronary artery. So, the involvement of the high lateral wall indicates a proximal lesion in the LCA – not good. Leads III and aVF have distinct ST depression – this is a reciprocal change reflecting the ST elevation in Leads I and aVL.
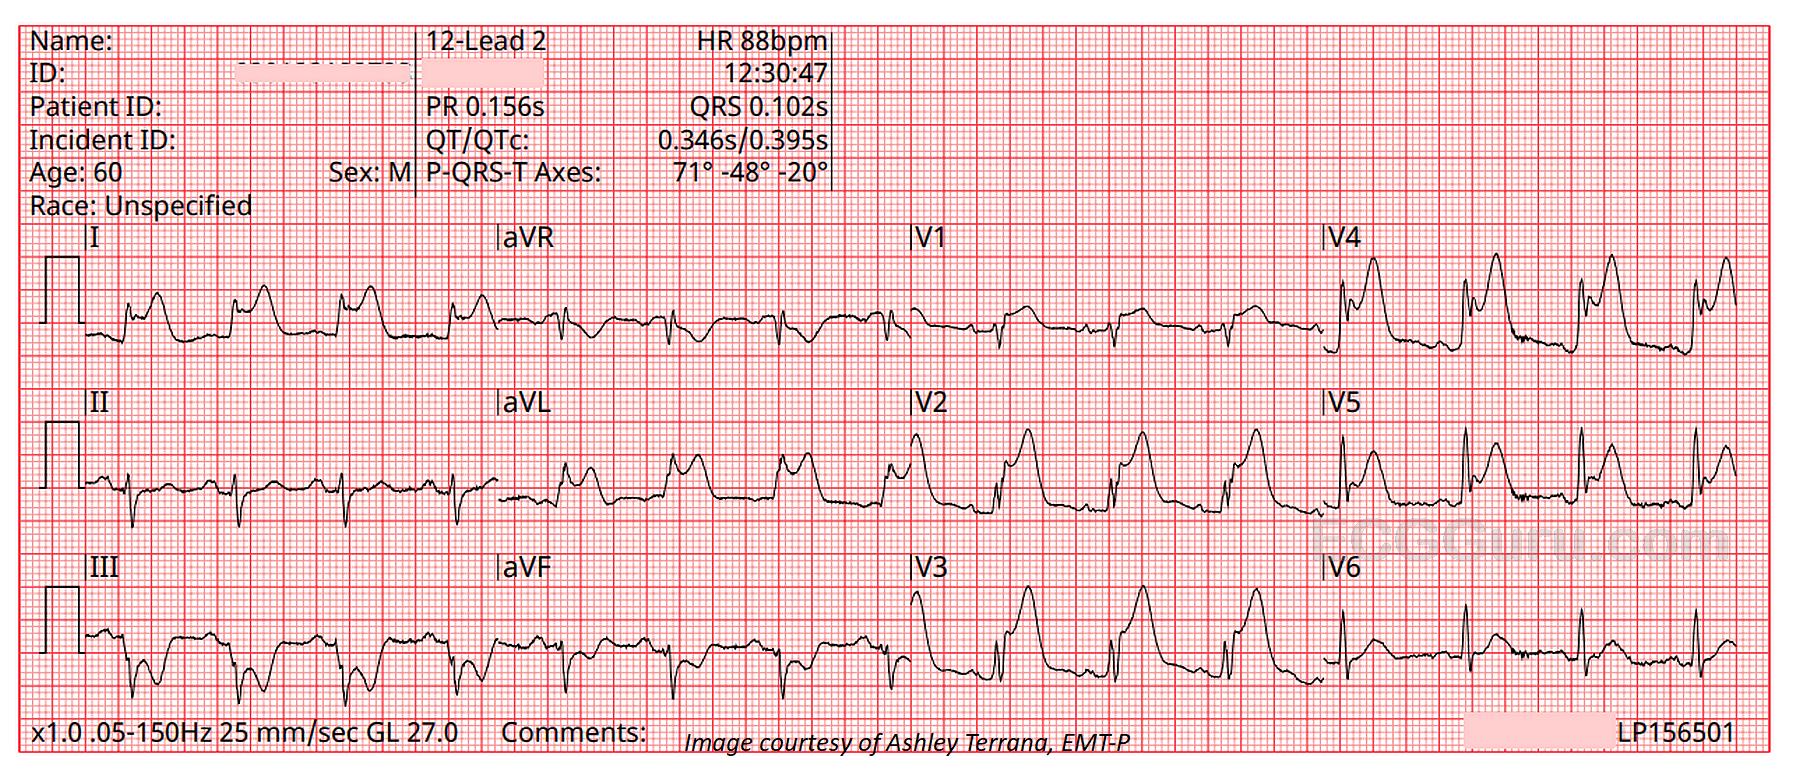
The second ECG, taken 42 seconds later, gives us a look at the same ECG without the PVCs.
Even though this is an “obvious” ST elevation M.I., it is good to note other signs of M.I. on this tracing, for times when the STE is not so obvious. The reciprocal ST depression may, in some cases, show up before the STE. An even earlier sign of impending occlusive M.I. is the appearance of hyperacute T waves, which can precede the STE. V2 through V5 show the tall, broad hyperacute T waves that are still present, after the onset of STE.
Note: V4 has a “fishhook” appearance at the J point. This is often associated with early repolarization pattern, but that is not what this is. So-called “benign early repolarization” occurs in younger people, and does not cause the other signs of acute STEMI that we see on this ECG.
Follow Up: The patient suffered a cardiac arrest shortly after arriving at the hospital. Unfortunately, we do not know the outcome.
Our thanks to Paramedic Ashley Terrana for donating these images.
Related Terms:
Rate this content:
All our content is FREE & COPYRIGHT FREE for non-commercial use
Please be courteous and leave any watermark or author attribution on content you reproduce.
Comments
Obvious Huge STEMI — with Interesting Additional Findings
The interesting aspects of today's case are not the diagnosis itself — as this extensive STEMI is obvious to all. What IS interesting — are a series of details regarding this diagnosis that may prove invaluable in cases when the answer is not immediately forthcoming. To emphasize that while my comments focus on these details — the obvious conclusion instantly conveyed by this case is the need for prompt cath and reperfusion. Unfortunately, the patient had cardiac arrest on arrival at the hospital — for which we do not know if he survived.
What is the rhythm? I agree with Dawn that there appears to be an underlying sinus rhythm with ventricular bigeminy (ie, every even-number beat being a PVC). That said — the atrial rhythm is not regular, albeit without a long lead rhythm strip it is difficult to be certain why.
While emphasizing that this patient's prognosis and management are unlikely to depend on the cardiac rhythm — it is worthwhile to look closer regarding how to assess P waves in tracings such as this, in which there is no long lead rhythm strip. RED arrows in Figure-1 highlight what appear to be definite sinus P waves. The PEARL to remember is that simultaneously-recorded leads may sometimes provide insight to the presence of P waves not as well seen in the lead you are looking at. For example — the PINK arrow in lead II tells me that the 2nd RED arrow is definitely a P wave. The 2nd PINK arrow (that we see in lead aVL) — confirms that the 6th RED arrow is also a P wave. The 3 PINK arrows in lead V1 tell me that the PINK arrow in the T wave of beat #8 is hiding a P wave.
The reason I looked carefully for these additional P waves — is that I have NO explanation for the longer-than-expected pause between P waves within the interval of beat #6 and 7 (with beat #7 clearly being junctional escape, given the too-short-to-conduct PR interval in front of it). In the presence of an extensive STEMI — the concern is for some form of AV block. To emphasize, that while even if some form of AV block is present, it is unlikely to influence this patient's prognosis — the point is to recognize that the P-P interval within beats #6 and 7 is longer than expected, and may signal a sinus pause, if not some form of block.
As per Dawn — ST elevation is diffuse, being seen in leads I,aVL and across the precordium — with marked reciprocal ST depression in leads III and aVF. Lack of reciprocal ST depression in the 3rd inferior lead ( = lead II) — is probably the result of "cancellation of forces" — between marked ST elevation in neighboring lead I and marked ST depression in leads III and aVF. Clearly the LAD is implicated — but whether this represents lesions to both the LAD and LCx vs LMain occlusion uncertain. Most patients with acute LMain occlusion do not survive until arrival in the hospital — but occasionally some do. Dr. Smith collected a series of ECGs from patients with LMain occlusion — to assess ECG manifestations of this condition. I've extracted in Figure-2 the Table I display in my ECG Blog #374 (https://tinyurl.com/KG-Blog-374 ) — to illustrate the wide variation in potential ECG presentations of acute LMain occlusion — which this patient may have.
As per Dawn — there is ventricular bigeminy. While I share her reservations about assessing PVC morphology for ST-T wave changes — there ARE times when ST-T wave appearance in a PVC is clearly MORE unusual than expected, even accounting for ventricular etiology of the complex. For example — beat #10 is a PVC (within the dotted BLUE rectangle) — but there is NO way that the upright QRS of this PVC is a "normal repolarization response". Instead — it reflects the ongoing STEMI. The PEARL is that on rare occasions — I have diagnosed an acute MI solely on the basis of abnormal ST elevation that "shouldn't be there" in a PVC, whereas the rest of the tracing was non-diagnostic.
Finally, while I agree with Dawn that some complexes in today's 2 tracings manifest a "fishhook" appearance at the J-point that is common in benign repolarization variants (the GREEN lines in lead V4) — there is also elevation of the J-point just before this "fishhook" (PURPLE lines in lead V4) that confirms acute infarction. Beyond the scope of today's case is the concept of T-QRS-D ( = Terminal QRS Distortion) — that I illustrate and explain in detail in my ECG Blog #318 (https://tinyurl.com/KG-Blog-318). T-QRS-D is not strictly present in today's case — because it requires that there be no "fishhook" present — but on occasion (as described in ECG Blog #318) — recognition of T-QRS-D may make the diagnosis of acute OMI (acute Occlusion-based MI) when the rest of the tracing is non-diagnostic. So, rather than focusing on the "fishhooks" in today's case — Note that S waves never form in a number of leads, because they are being "lifted above the baseline" by that extensive STEMI-associated ST elevation.
Ken Grauer, MD www.kg-ekgpress.com [email protected]