Dawn's picture

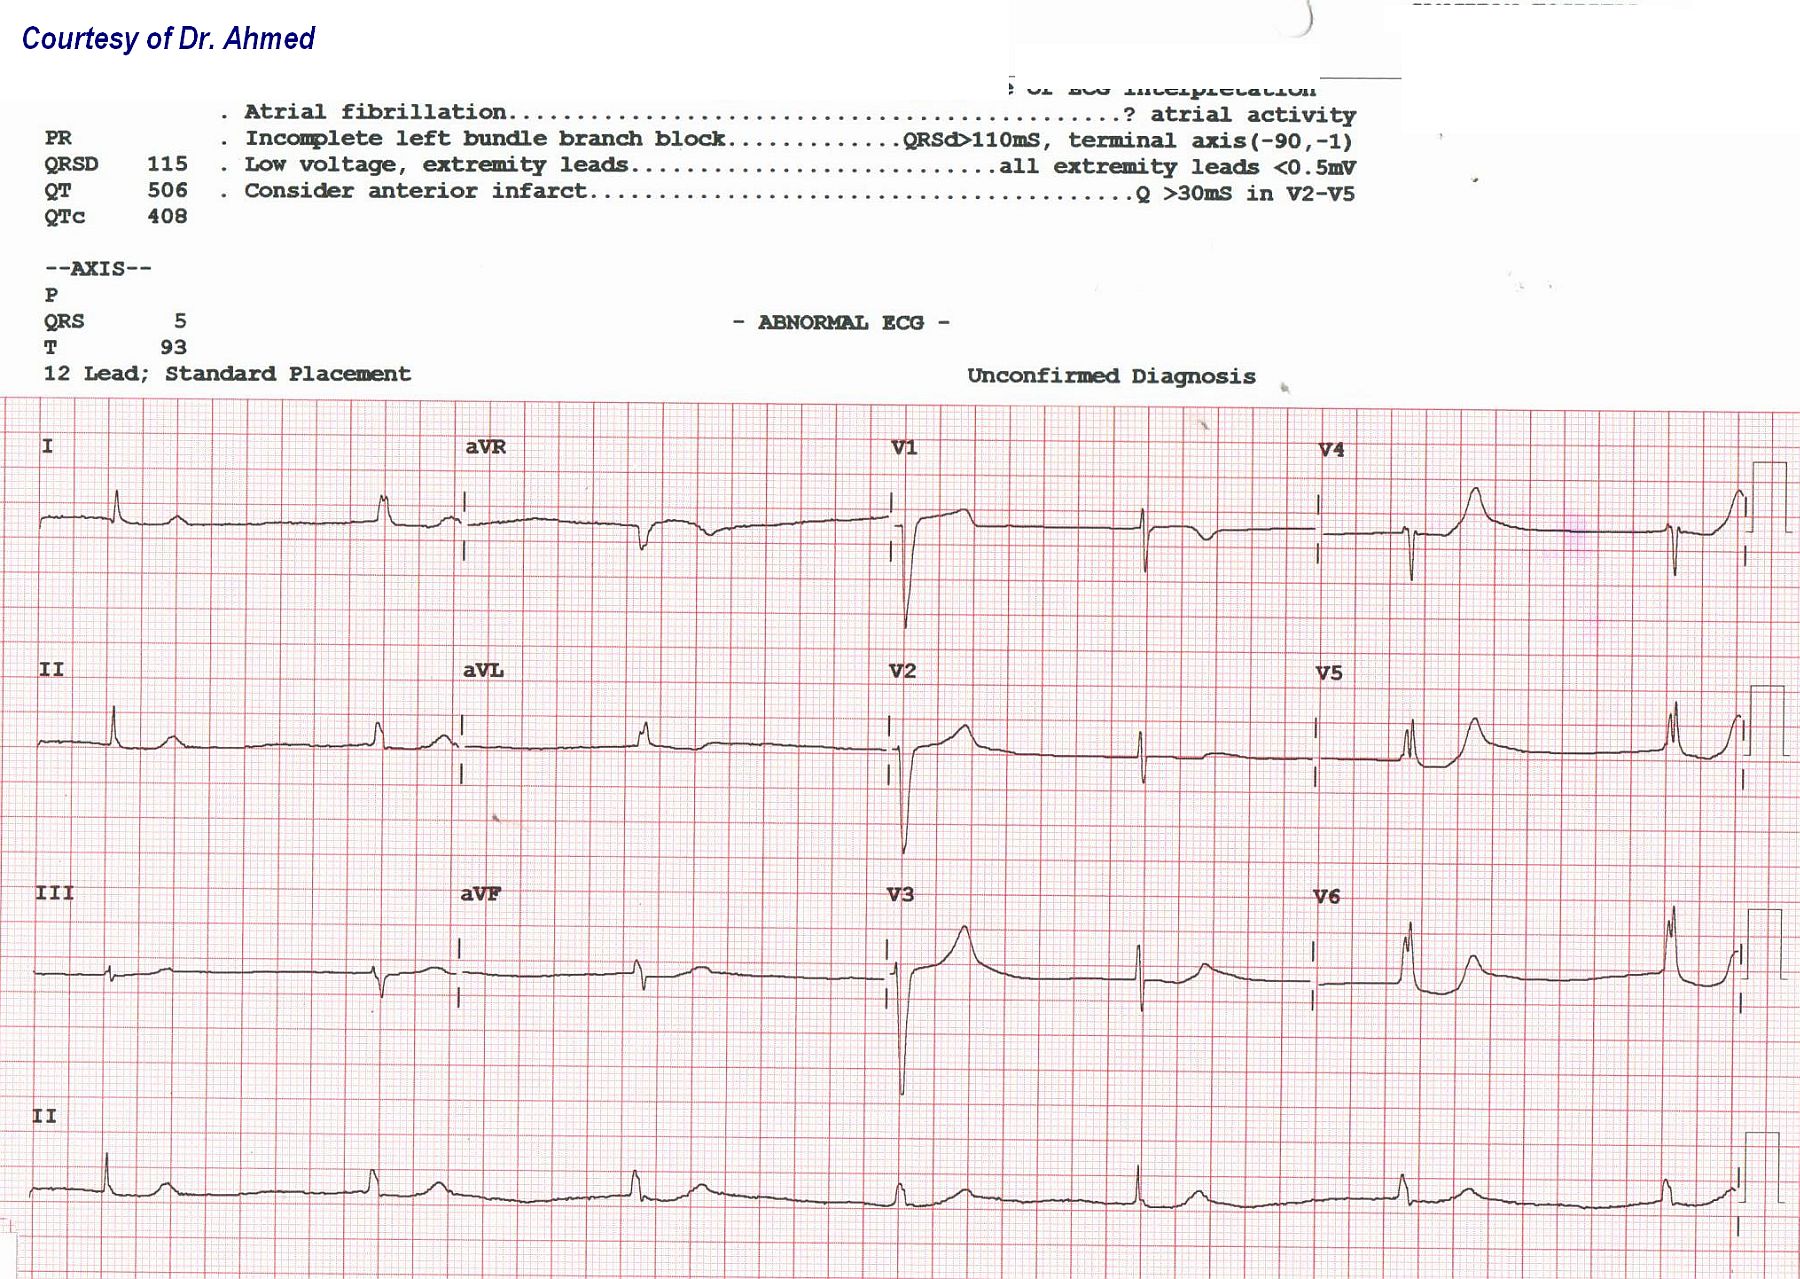
This ECG was kindly donated to the ECG Guru website by Dr. Ahmed for open discussion among our members.  The patient was a 70+ year-old man who presented with a complaint of dizziness.  His serum potassium level was found to be 6.5 (normal is 3.5 - 5.0).  Upon correction of his K levels, his rhythm was atrial fibrillation at 130 / min.

WHAT DO YOU THINK ABOUT THIS INITIAL ECG?  What is causing the slow rate? Is there atrial activity?  Do you see QRS morphology changes?  What about the anterior ST and T wave changes? 

We look forward to hearing from our members!  And thanks to Dr. Ahmed for donating this interesting ECG.


Rate this content: 
Average: 5 (3 votes)

Comments

Not convinced this is AF.  Appears to be P waves immediately after the QRS, even the ectopic beats, at least in the inferior and lateral leads.  Appears to me to be a junctional rhythm with supra ventricular ectopics - 1st and 5th QRS complexes.  Not quite sure but potentially p waves hidden in the end of these also.  Certainly meets criteria for hyperkalaemia, with the broad QRS, and the T waves in the pre cordial leads.  Agree with incomplete LBBB.  

Slow rate perfectly fits with a junctional rhythm with abberancy in the 1st and 5th beat.  Anterior ST, T wave changes consistant with hyperkalaemia. Note the ST elevation in V1?  And significant ST depression in low lateral leads (V5 & V6).

What was his K+ after correction?  Was it corrected too quickly to cause AF with RVR???  Does he have a history of AF?

Not sure how correct I am with this interpretation, so am certainly keen to hear what others think.

ekgpress@mac.com's picture

     We are told the patient has hyperkalemia - and it is probable that much of what we see is the result of his K+ = 6.5 mEq/L. Hyper-K+ may cause bradycardia and escape rhythms. P wave amplitude is reduced. Sinoventricular rhythm may occur - in which the P wave disappears from the surface ECG, even though sinus-initiated impulses continue to occur. This may be what we see here - as there are no P waves to be seen.

     There are two types of QRS complexes in this ECG: i) a slightly widened QRS (for beats #2,3,4 and #6,7); and ii) a narrow QRS (for beats #1 and #5).

  • The R-R interval for the slightly widened beats (QRS ~ 0.11 sec) is constant = 1.52 second. I'll call this a ventricular escape rhythm because it is wide, slow (<40/minute) and not preceded by P waves - BUT it could be sinoventricular rhythm from hyper-K+, in which P waves are lost on the surface ECG and the QRS is widened due to the K+ = 6.5 mEq/L. While T waves do not manifest the usual tall, peaked-with-narrow-base  ("Eiffel-tower") appearance - there IS some peaking (beyond-that-expected) for the summit of the T waves for beats #4 and #6,7 when viewed in simultaneously-recorded leads V2,V3 and V4,V5,V6.
  • Other than the narrow beat that begins this tracing (beat #1) - the one narrow beat that is preceded by an R-R interval (= beat #5) occurs early! Instead of the R-R interval of 1.52 second seen between widened beats - the R-R interval preceding beat #5 = 1.40 second. I'll therefore presume that beat #5 is a junctional escape beat - since it is narrow, occurs early, and is not associated with any P wave. Whether or not sinoventricular rhythm is operative I believe is unknown from what we see. Why we don't see additional junctional escape beats (given that the escape R-R interval for this narrow beat is less than the R-R for ventricular escapes) - is also unknown. I'll presume that junctional escape is erratic and unreliable from hyperkalemia - but that's conjecture. Assessment of ST-T wave changes for the narrow beats (in simultaneously-recorded leads I,II,III and V1,V2,V3 for beats #1 and #5, respectively) is unrevealing (really no ST-T wave changes that you'd expect with hyperkalemia).

Additional Clinical NOTES:

  • The serum K+ level of 6.5 mEq/L is a bit lower than the level that is usually associated with the changes I believe we are seeing here (loss of P waves and QRS widening). Whether the actual K+ value at the precise time of this ECG was higher than 6.5 mEq/L - or - whether the baseline ECG was simply very abnormal is unknown.
  • Remember that what one sees on the ECG of a hyperkalemic patient is the combined effect of that patient's baseline ECG plus any effects that might be the result of hyperkalemia. So, for example - if on baseline ECG there is diffuse ST depression - this may essentially "cancel out" any T wave peaking that might otherwise be seen. It is only after correcting hyperkalemia - that one can assess the ECG for ischemic changes.
  • My experience is that "all bets are off" when you have significant hyperkalemia. I have seen bizarre axis shifts - marked QRS widening - and uninterpretable ST-T wave changes. I therefore generally refrain from making any assessments about ischemia/infarction/conduction defects/hypertrophy until K+ has been corrected.

BOTTOM LINE: A very interesting tracing with dual escape rhythms vs sinoventricular rhythm in a patient with hyperkalemia. I don't believe much more can be said without seeing the ECG after correction of hyperkalemia.

  • For those with an interest - Brief review of the ECG Changes of Hyperkalemia can be found at THIS LINK.

Ken Grauer, MD  www.kg-ekgpress.com   [email protected] 

Test

Commented using the Ecg Guru App

All our content is FREE & COPYRIGHT FREE for non-commercial use

Please be courteous and leave any watermark or author attribution on content you reproduce.