
Submitted by Dawn on Mon, 01/18/2016 - 00:24
This ECG is a good example of an inferior wall M.I. that was confirmed and treated in the cath lab.
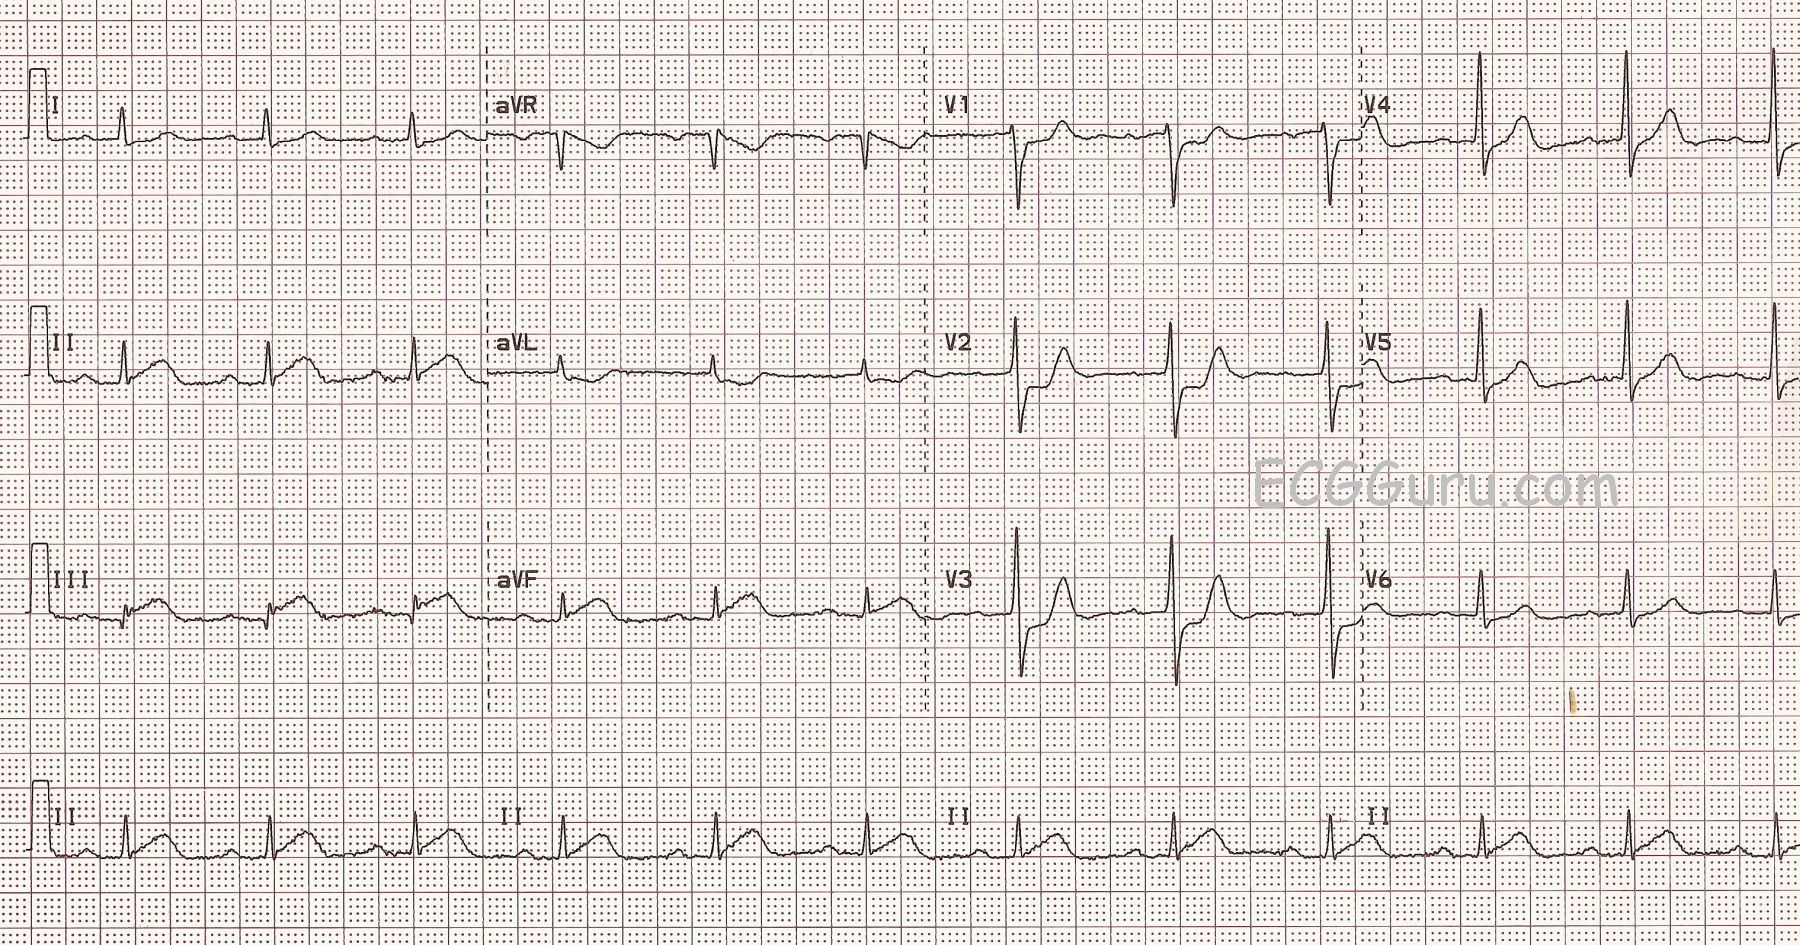
The ST segments are elevated in Leads II, III, and aVF, but the amount of elevation may look subtle to some. When the amount of elevation seems small, what other signs can help us recognize acute ST-elevation M.I.?
PATIENT HISTORY AND PRESENTATION This patient had acute chest pain, and was over the age of 50. We do not know his past medical history. His chest pain was described as substernal and epigastric, radiating to his back. He had nausea and diaphoresis. His past medical history is unknown, but it would be significant if he had a history of coronary artery disease, past M.I., smoking, metabolic syndrome, strong family history of heart disease, etc.
ST SEGMENT ELEVATION DISTRIBUTION In acute STEMI, the elevation will be seen in “related leads”. That is, the leads that are affected will reflect a region of the heart that is supplied by the same artery. Some M.I.s are larger than others, affecting more leads, because some obstructions are more proximal than others in the artery. This ECG shows STE in the inferior wall leads: II, III, and aVF. The culprit artery for this patient was the right coronary artery, which supplies the inferior and posterior wall of the left ventricle, the right ventricle, and the right atrium in the majority of people.
RECIPROCAL ST DEPRESSION Finding reciprocal ST depression in the leads that are OPPOSITE the affected leads is a very reliable sign to confirm that the STEs are due to an acute M.I. In fact, often the reciprocal depression is “stronger” or easier to see than the elevation. It is important to teach your students how the standard leads are oriented to the heart, so they will recognize the 12-Lead ECG as a “map” of the heart. The reciprocal ST depression in this ECG is seen in Leads aVL and I (subtle), which are across the frontal plane from Lead III. We also note reciprocal ST depression in the precordial leads, especially notable in Leads V1 through V3. This can reflect the injured area extending up the back of the heart from the inferior wall (posterior wall). The R waves in V2 and V3 are a bit higher than normally expected, which could indicate a reciprocal view of pathological Q waves on the posterior wall. Print the ECG out on paper, turn it upside down, and look at V2 and V3 through the back. V2 and V3 will look like a “classic” STEMI. This should be approximately the view you would get from additional posterior leads.
ST SEGMENT SHAPE A “normal” ST segment is concave upward, like a smile. Of course, even an ST segment with a normal shape can be abnormal if it is elevated. But, when the shape is abnormal, even a slight amount of elevation can mean injury. What is “abnormal”? Convex upward, or “frowning” is abnormal, as is straight. A straight ST segment can be horizontal or sloped. In this ECG, you will see that the ST segments in II, III, and aVF are straight, shooting off the QRS in a straight line. Interestingly, the reciprocal ST depressions are straight, too, as they “mirror” the STEs.
ASSOCIATED ECG SIGNS When other abnormal ECG signs are seen with STE, it adds evidence that we are looking at an acute M.I. ST elevation is a sign of acute injury, and it may be accompanied by T wave inversion, a sign of ischemia. We might see pathological Q waves, an ominous sign of necrosis. There is a Q wave in Lead III in this ECG, but Lead III often has Q waves. They are not considered pathological unless they are also present in II and aVF. We are happy to see no pathological Q waves, as they indicate an area of no electrical activity, like an electrical “hole” in the heart.
DYSRHYTHMIAS The presence of dysrhythmia does not indicate an acute M.I., and the absence of dysrhythmia does not exclude M.I. However, certain rhythms are often associated with acute M.I. due to impairment of blood supply to parts of the electrical system of the heart or to left ventricular weakening and failure. In inferior wall M.I., for example, it is common to see sinus bradycardia and AV node blocks like second-degree AVB, Type I or third-degree AVB with junctional escape. These reflect ischemia or damage to the SA or AV nodes, which usually have the same blood supply as the inferior wall. AV blocks from below the AV junction, such as second-degree AVB, Type II or third-degree AVB with ventricular escape, are often attributed to interventricular septal damage. Ventricular tachycardia and ventricular fibrillation are always a danger in acute STEMI, due to altered cellular function in the damaged tissues.
TAKE HOME POINT When you are confronted with an ECG with subtle signs of acute ST-elevation M.I., look for associated clinical and ECG signs to help you interpret the ECG.
Rate this content:
All our content is FREE & COPYRIGHT FREE for non-commercial use
Please be courteous and leave any watermark or author attribution on content you reproduce.
Comments
Acute Infero-Postero MI (Positive "Mirror" Test)
This ECG is an excellent example of an acute infero-postero STEMI (ST Elevation Myocardial Infarction). To Dawn’s thorough overview of the subject — I will add the following comments:
It should be apparent that the thrust of my comments relate to recognition of the overall appearance and sequence of events that occur with acute inferior infarction. Because the “culprit artery” is the RCA (Right Coronary Artery) — the posterior wall will also often be affected. So my eye almost immediately seeks out looking to find a mirror-image appearance in the anterior leads the moment I diagnose an acute inferior STEMI. To facilitate appreciation of the “Mirror Test” — I have literally made a mirror-image of the original 12-lead tracing in the attached FIGURE below. At the bedside, if you hold the original ECG upright and focus within the RED rectangle on leads V1,2,3 — and then flip over the tracing as you hold it up to the light — the mirror-image of leads V1,2,3 will look like what you see within the BLUE rectangle, which now shows Q waves, worrisome shape of ST elevation and deepening T wave inversion.
Clinically — it is impossible to distinguish how much of the ST depression we see in leads V1,2,3 is due to reciprocal ST depression vs acute posterior involvement. That said, this does not matter — because what is obvious regardless is that we are dealing with a large area of evolving infarction.
A final point regarding this tracing is that we see no evidence of acute RV (Right Ventricular) involvement. Acute RCA occlusion if proximal will commonly produce significant RV involvement — which is important because of potential hemodynamic effects (ie, volume dependency) when acute RV infarction accompanies LV infarction of the inferior wall. While definitive ECG diagnosis of acute RV infarction requires right-sided leads (looking for ST elevation, especially in lead V4R) — the standard 12-lead ECG often provides clues that RV involvement may or may not be present. Lead V1 is a right-sided lead — so there is usually either a flat or slightly elevated ST segment in lead V1 when there is RV infarction. The fact that lead V1 in this tracing shows 1-2mm of ST depression argues against RV involvement in this case. That there is not significant RV involvement is supported by no more than minimal ST segment depression in lead I (that often shows significantly more ST depression when acute RV infarction is ongoing).
NOTE: For those interested — my ECG Blog #56 illustrates a similar case.
Ken Grauer, MD www.kg-ekgpress.com [email protected]
A few more bits of information...
Dawn...
A very good tracing to illustrate the findings of an acute myocardial infarction - and this tracing has quite a few!
When you look at the ST segments in II, III and aVF, the upslope appears more like a straight line than the classical upward-bowing (upwardly convex) line associated with acute MIs. At the onset of an acute ischemic episode, the ST segment begins from the normal position which is upwardly concave (bowing downward). With the developing ischemia, the upward sloping ST segment changes to the more classical upward convexity - but in doing so it must straighten out and then bow upward. This ECG caught the ST segment as it has just straightened out. Of course, there is no guarantee that it will become upwardly convex, but they usually do. An ECG done an hour later may have shown the change. In any case, it is during this "straightened out" stage that so many diagnoses are missed because people are looking for that classical upward convexity. The ST elevation at the J point on this tracing is not difficult to see, but had one of the leads had a QRS complex that was only 1 or 2 mm high, (as so often happens with lead aVL!), any STE could be easily missed and the straightened upslope of the ST segment may have been the only clue that an acute MI was occurring.
Another issue is the use of the term "reciprocal" change. The only reciprocal change to the acute ischemia of the inferior wall of the left ventricle is the ST depression in Leads I and aVL - and mostly aVL. The "reciprocal changes" in leads V1 through V3 are not to the ST elevation in leads II, III and aVF, but actually to an infarction of the posterior (now we should really be saying "lateral") wall. The leads (V7 through V9) placed over the posterior (or lateral) wall would have shown ST elevation. During an inferior infarction accompanied by ST depression in the right precordial leads (V1 - V3), so many people think that when we refer to the "reciprocal changes" in leads V1 through V3, we are suggesting they are reciprocal to the inferior leads. They aren't. We are actually referring to the primary (STE) changes in the posterior, or lateral. leads which are not usually seen because the extra leads were not included.
Thanks again, Dawn. Those who are just beginning to learn ECG interpretation should study this ECG well since it has so many excellent findings, as pointed out by Dr. Grauer. And DO check out Dr. Grauer's website. There is a HUGE amount of information there!
Jerry W. Jones MD FACEP FAAEM
https://www.medicusofhouston.com
Twitter: @jwjmd