Dawn's picture

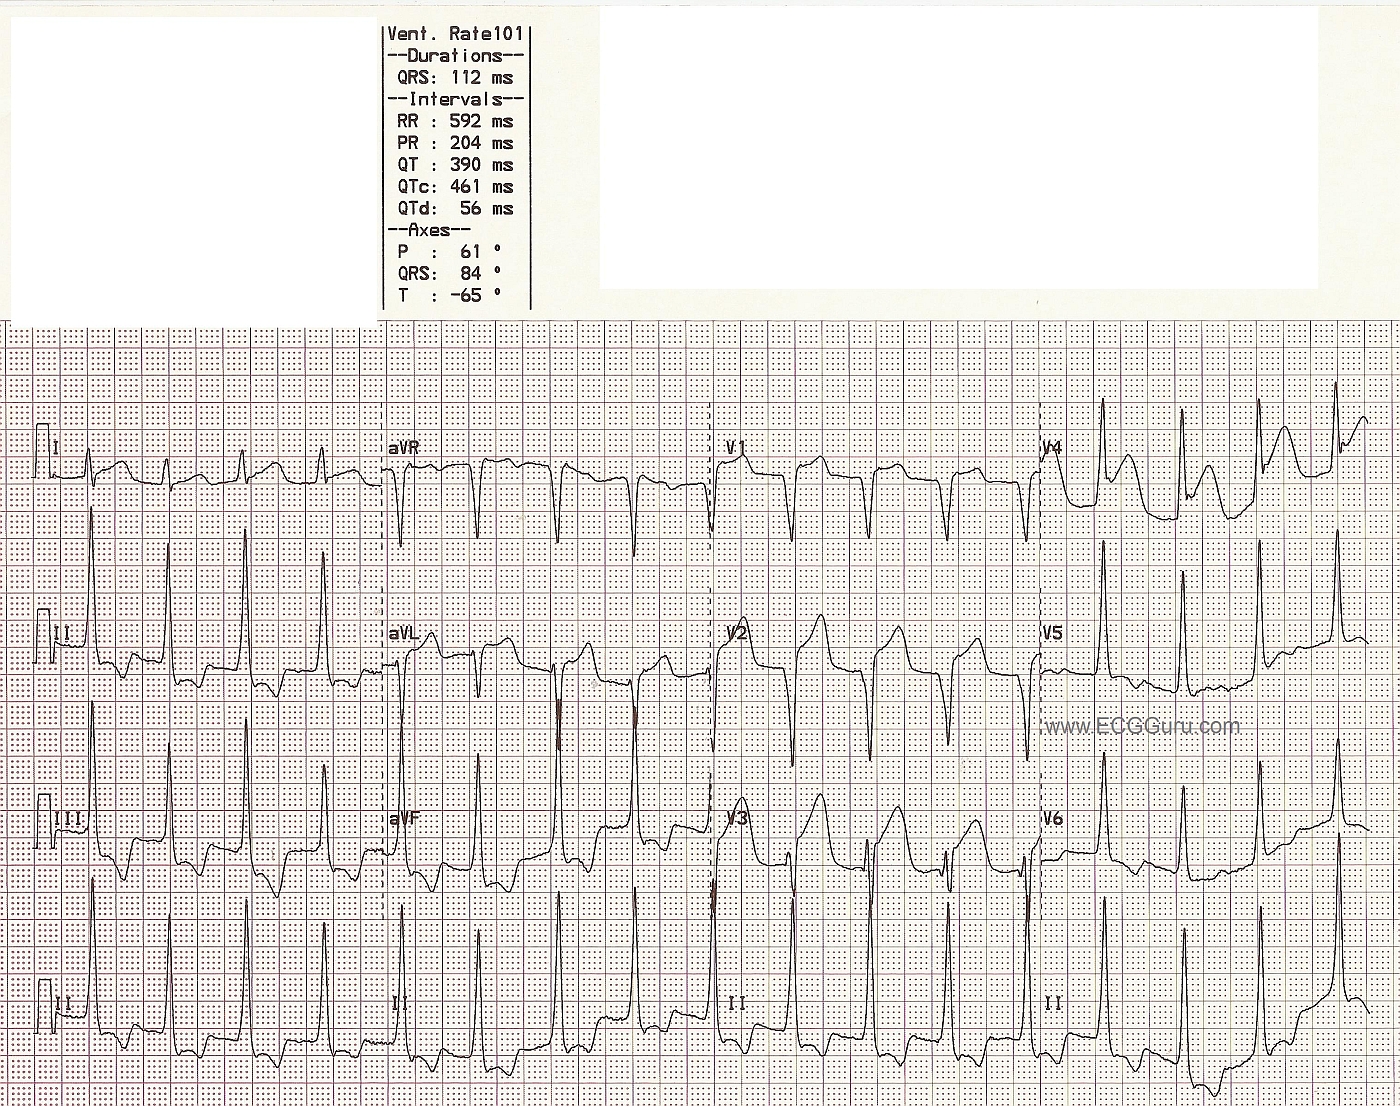
This is a good ECG for demonstrating the voltage and ST criteria for LVH and acute anterior wall M.I. in the same patient, where both conditions have been confirmed by other tests.   If you are teaching the topics of ST elevation M.I., or left ventricular hypertrophy, you will probably have to address the issue that LVH can be considered a "mimic" for STEMI, especially for beginners.  This is because LVH causes ST depression in leads with upright QRS complexes, and reciprocal ST elevation in leads with negative QRS complexes.  This is called ST segment discordance.  The ST changes in LVH are due to the "strain" pattern, indicating strain on the left ventricular myocardium.  It is true that some ST elevation will appear in V1 and V2 in these patients, and can be mistaken for M.I.  In the ECG shown here, the patient has definite ST elevation in leads which would NORMALLY have depression in the LVH strain pattern.  Leads V1 through V4 have ST elevation that is not discordant, and is definitely real.  This patient was taken to the cath lab, and his left anterior descending artery stented.

Rate this content: 
Average: 3.5 (4 votes)

Comments

ekgpress@mac.com's picture

Excellent point made by Dawn about co-presence of LVH and acute STEMI on this tracing. As stated - the distinction can at times be difficult. The bottom line to me is that you "need a human" to interpret the tracing. By that I mean that when there are "competing conditions" (ie, LVH and ant MI) - one can't put in a formula how to assess the relative contribution from each ...

How do we KNOW that this tracing shows an acute STEMI? The answer is that there is NO mistaking what we see in lead V4 - marked acute ST elevation that shouldn't be there! Knowing this helps up to assess the ST elevation in V1,V2 - where the ST segment itself looks like it could result from LVH - BUT the J-point in V2 is clearly up (by a good 4-5 mm). Therefore - the lead in-between (= V3) also becomes totally evident as showing ST straightening and 4 mm of J-point elevation. BUT - it all for me starts with V4 that is the most flagrantly abnormal ....
  • My eye then pickus up the high lateral lead abnormality (leads I, aVL)- both of which show more subtle but definitely real ST elevation.
  • The inferior leads show what looks like huge voltage and "strain" - but the J point is down far more than normal - doubtlessly reflecting acute reciprocal changes from the acute STEMI.
  • Q waves are present in V1,V2. Because of the leftward and posterior forces of LVH - you may sometimes see Q waves anteriorly just from LVH ..... By the same token - because of "loss of anterior forces" with anterior MI - you may see deeper-than-expected S waves in V1,V2 that simulate LVH (loss of opposing forces). That said - We assume the QS in V1,V2 here reflects the acute STEMI until proven otherwise given the other findings we see ...
FINAL QUESTION: Mesmerized as we are by these captivating ST-T wave changes - WHAT IS THE RHYTHM ???  The QRS looks supraventricular (although it IS wide - though I suspect primarily from LVH and acute MI, both of which can wide a supraventricular rhythm.... ) - but can we be certain of P waves anywhere ??? Would be nice to see on other rhythm strips IF P waves were present ....
 
NICE Tracing posted by Dawn!


Ken Grauer, MD  www.kg-ekgpress.com   [email protected] 

ekgpress@mac.com's picture

NOTE: I am writing this "P.S." Comment on January 26, 2013 - whereas I wrote my initial comment (shown above) on 6/28/2012.

--------------------------------------------------------------------------------

This tracing was just brought to my attention WITHOUT me realizing/remembering that I had previously seen and commented on it. That sequence of events itself is worthy of bringing up the well-known clinical reality of 10-20% expert intraobserver variation - when experienced electrocardiographers are subsequently asked to comment on a tracing they previously saw but without telling them what they said the 1st time! It is always interesting to me personally to see how "consistent" I am (or am not) in my interpretations of the same tracing at different points in time ... Regarding this ECG:

  • I stand by all I said in terms of this being an acute STEMI.
  • I stand by my previous final comment of questioning what the rhythm truly is.
  • I do NOT recall if I magnified this tracing the 1st time I interpreted it (it is possible to magnify this ECG if you go through the extra step of downloading the original). As I look at it today in magnified view on the big screen of my desktop computer - I wonder IF I am seeing delta waves? in at least certain leads .... There is some baseline wander/artifact that makes interpretation challenging. The leads of most concern to me are leads III, aVF, and V2 - each of which manifests initial slurring with rounding of the initial upslope (or downslope for V2) that for all the world looks like a delta wave. Other leads are less convincing - and it is well known that with QRS widening (as may occur from LVH, scarring) - there can at times be initial slurring of the first part of the QRS. Regardless of whether there is or is not an AP (Accessory Pathway) involved - the ST segment elevation in V4 (and in certain other leads) is clearly beyond that anticipated for either conduction defect or AP rhythm - so acute STEMI is undoubtedly present.
  • IF this tracing does in fact manifest accessory pathway conduction ... - then comment about chamber enlargement is uncertain ...
  • BOTTOM LINE: Given the absence of clear atrial activity on this 12-lead - I wonder what the true mechanism of this rhythm is ... Perhaps Dawn has access to a post-stenting 12-lead ECG?


Ken Grauer, MD  www.kg-ekgpress.com   [email protected] 

All our content is FREE & COPYRIGHT FREE for non-commercial use

Please be courteous and leave any watermark or author attribution on content you reproduce.