
Submitted by Dawn on Sun, 01/31/2016 - 23:11
We have no clinical information about this patient, except that he was complaining of chest pain, and was initially treated by prehospital paramedics.
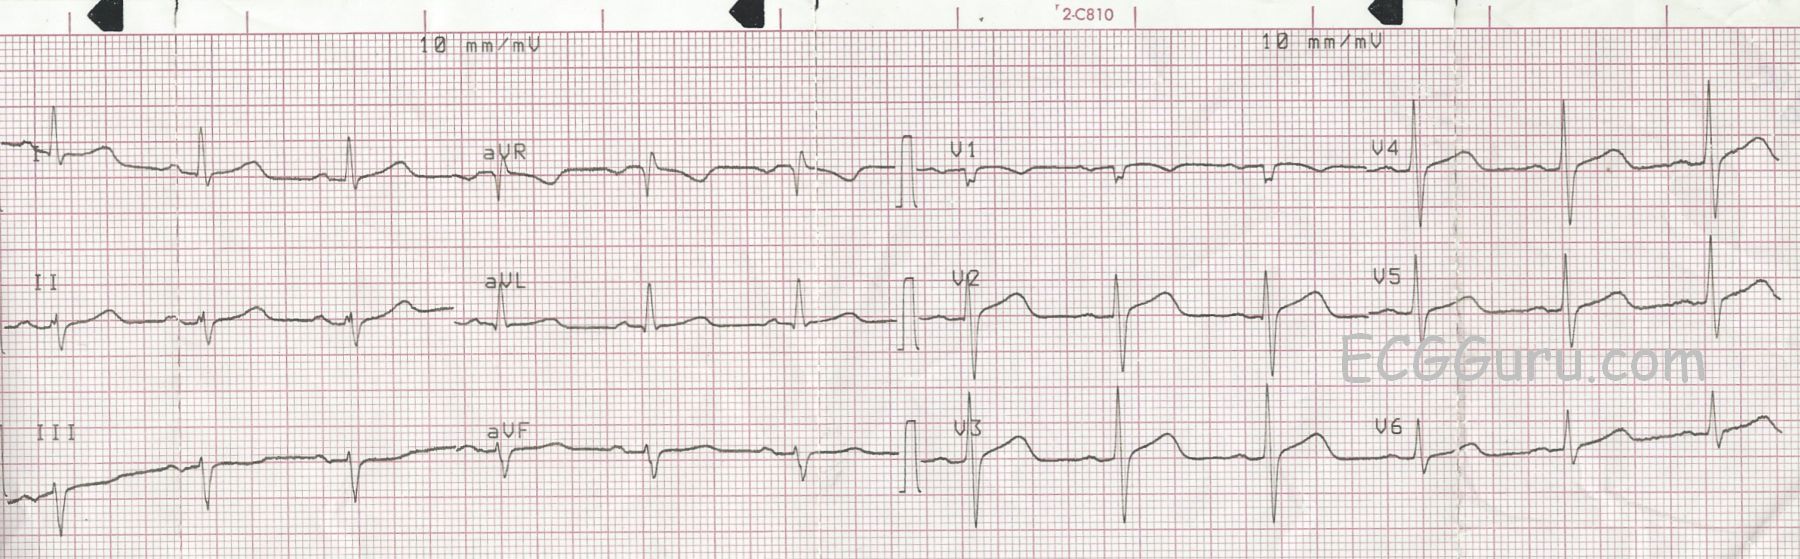
ST Changes The paramedics noted a slight J point elevation in the precordial leads, specifically about one mm of elevation in Leads V2, V3, and V4. In addition, the ST segments are curved downward like a frown in V1 and straight in the remaining precordial leads. Because of the patient’s symptoms, and the ST abnormalities, they notified the hospital that they believed this was a STEMI. The patient was transported without complications, and the Emergency Department physician subsequently downgraded the initial assessment of STEMI Alert. We do not have access to follow up. These ST segments are abnormal, but do not necessarily indicate an acute ST-elevation M.I. (STEMI). A flat or “frowning” ST segment DOES suggest coronary artery disease, and the patient’s symptoms are worrisome. However, before activating the cath lab emergently, it is sometimes preferable to observe the patient, check cardiac enzymes and other lab results, and repeat ECGs.
Are These ST Changes Due to Acute M.I.? There are several accepted guidelines in use for evaluating ST segments for STEMI. Some are simplified for ease of use, and some are very detailed, taking into consideration the patient’s age and gender. There are ECG features that INCREASE the chances of ST elevation being due to acute M.I. These features include:
· ST elevations are in related leads
· ST segments are flat or convex upward (frowning)
· There are reciprocal ST depressions
· There are associated ECG signs of M.I. such as pathological Q waves and inverted T waves
· J points are higher than 1 mm (females have less STE requirement for M.I. diagnosis) Leads V2 and V3 generally require 2 mm of STE for a STEMI diagnosis.
As we evaluate this ECG, we see that the subtle ST elevations are in related leads (V1 - V3). They are flat (V2 and V3) or convex (V1). There is NO reciprocal depression of the ST segments. There are NO pathological Q waves. T waves are inverted in V1 and flat in Lead III, a non-specific finding. And the J points are minimally elevated at 1 mm or less. By most standard protocols, this ECG does not meet the criteria for acute STEMI. This does NOT rule out the possibility of M.I.
Other Considerations It is worth noting that strictly “normal” R wave progression is not seen in this ECG. Leads V2 through V6 show normal R wave progression. That is, the R waves progressively become proportionately larger, while the S waves regress. V1, however, does not have the morphology expected, a small r wave and a deep S wave. We are not sure if this is a lead placement issue or not. When V1 has abnormalities not shared by V2, we sometimes see similar changes in Lead III, because V1 and Lead III are both oriented toward the heart’s right side. In this ECG, Lead III does not resemble Lead V1. Also, there is a left axis deviation. If no other cause for left axis deviation is readily apparent, the cause is presumed to be LEFT ANTERIOR HEMIBLOCK, also called left anterior fascicular block. LAH is sometimes caused by anterior-septal M.I., with an incidence of about 7-15%.
Ref.: Marriott HJL, Hogan RN. Hemiblock in acute myocardial infarction. Chest.1970; 58: 342–344.
Related Terms:
Rate this content:
All our content is FREE & COPYRIGHT FREE for non-commercial use
Please be courteous and leave any watermark or author attribution on content you reproduce.
Comments
Is there Anything Acute Going On?
Interesting tracing obtained from a patient with “chest pain”, but little else in the way of history. I agree with Dawn that this is one case in which I would gather additional information before deciding on whether or not to activate the cath lab.
My interpretation is sinus rhythm at about 70/minute — normal intervals — LAHB ( = Left Anterior HemiBlock), with an axis that is clearly more negative than -30 degrees (since the net QRS deflection in lead II is clearly more negative than positive) — no chamber enlargement — a small (septal) q wave in lead aVL — normal transition (occurs between V2-to-V4) — persistent precordial S waves (that are still present in lead V6) — and, some inconclusive ST-T wave changes.
Of note — the QRS complex in lead II is fragmented, in that there is a definite notch in the upstroke of the small initial r wave. This suggests scarring (ie, from cardiomyopathy or prior infarction) — but provides no information as to whether an acute process is ongoing.
There are a number of subtle-but-real findings on this tracing — that to me are of uncertain significance. In isolation — the ST coving and T inversion seen in lead V1 is not necessarily abnormal. However, there is an undeniable small amount (~ 1 mm) of J-point ST elevation in leads V2-through V6. In this context — the J-point is also elevated (at least by 1/2 mm) in leads I and aVL, as well as in lead aVR. In addition, the ST-T wave in leads III and aVF is flatter-than-it-should-be, with the ST-T wave appearance in lead III almost being a mirror image of what we see in lead aVL. Finally, the ST segment in lead II looks flat with a T wave in this lead that is clearly more peaked than-it-should-be given amplitude of the predominantly negative QRS complex in this lead.
My overall impression — is that the above subtle findings are probably not indicative of any acute ongoing process. This is because the QT interval is clearly within the normal range — R wave amplitude is already substantial by lead V2 (rather than being reduced as is often the case with early acute anterior infarction) — and the small amount of J-point ST elevation that we see looks so similar in so many leads without localization. That said — there IS some straightening to the ST segment in virtually all chest leads, the subtle ST-T wave changes in leads III and aVF could reflect reciprocal change — and, that T wave in lead II does indeed look taller-than-it-should-be given the appearance of the QRS complex in this lead.
BOTTOM LINE: I would not be prepared to provide any definite conclusion on the meaning (if any) of the ECG findings noted above for this tracing. Obtaining a careful history — hopefully finding some prior ECGs on this patient for comparison — doing serial tracings (especially if chest pain persists) — and ideally obtaining an Echocardiogram at the time of chest pain should all prove invaluable for clarifying the clinical picture in this case.
P.S. I agree with Dawn that the diminutive complex in lead V1 (with negative component to the P wave in this lead), together with the taller-than-expected R wave already by lead V2 — suggests that there may be some lead placement error. That said, even if true — this would not alter my overall impression for this tracing.
Ken Grauer, MD www.kg-ekgpress.com [email protected]