
Submitted by Dawn on Wed, 03/01/2017 - 23:07
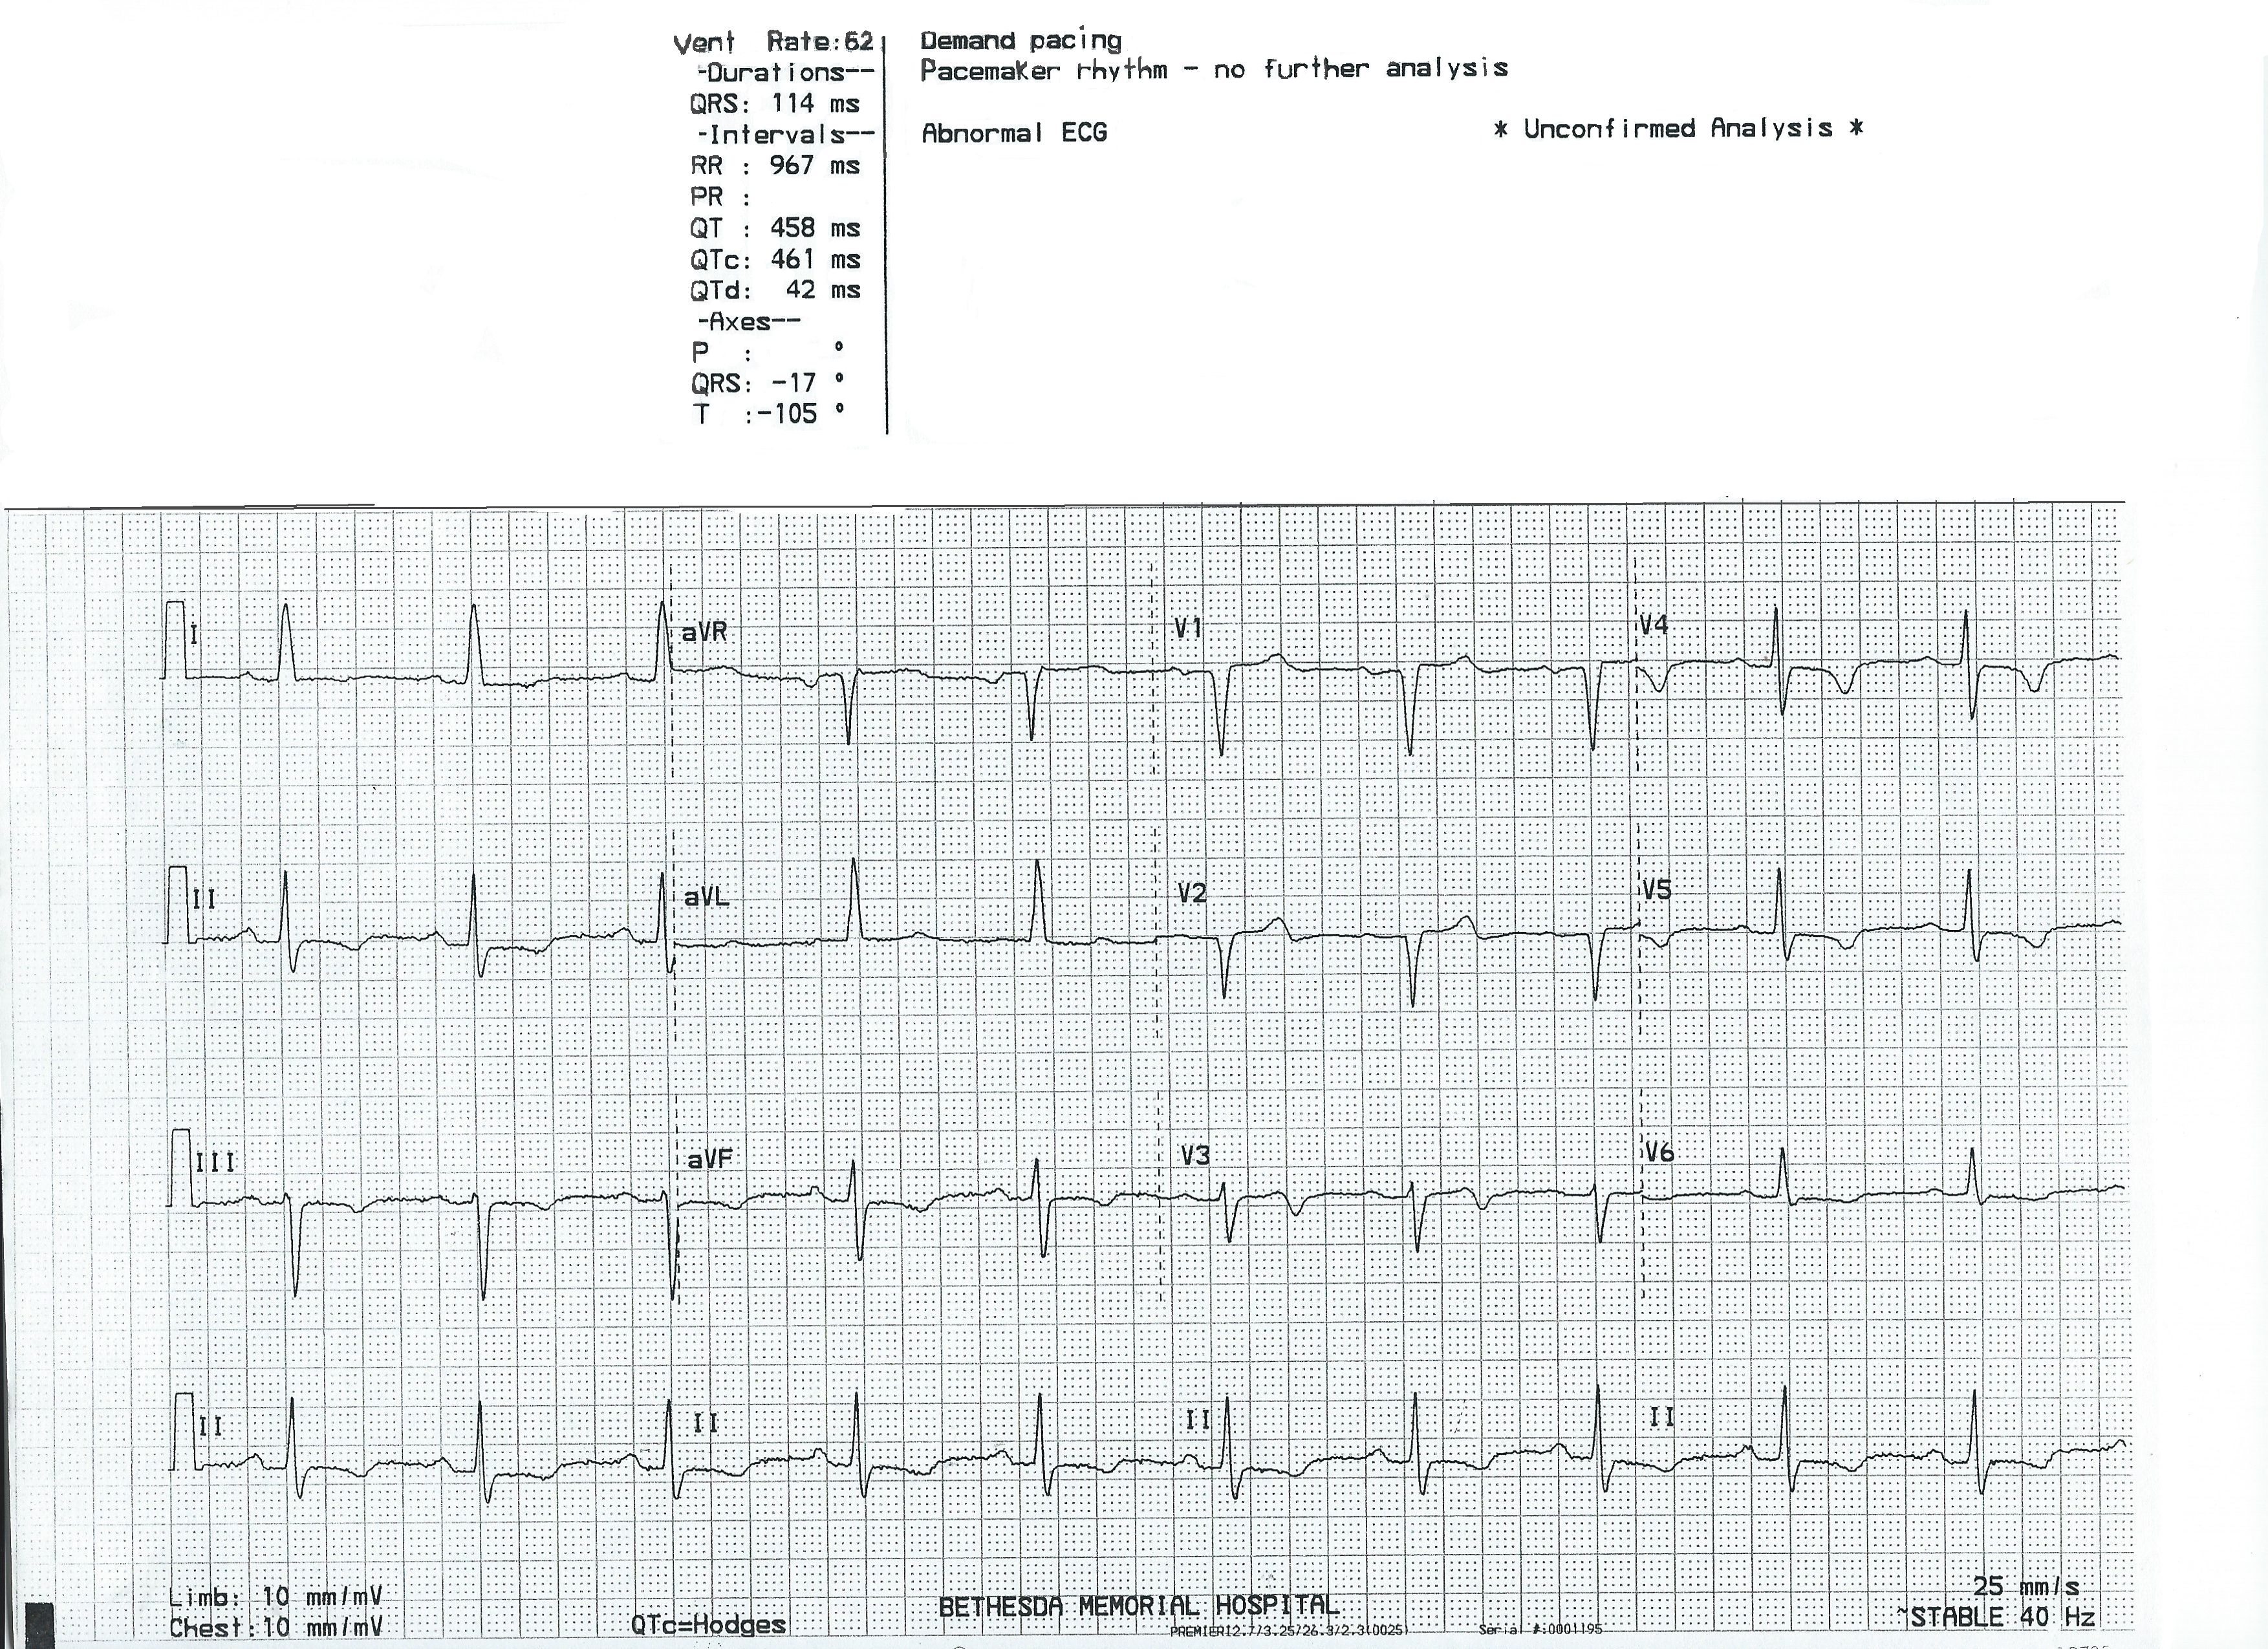
This ECG is presented as an example of INCORRECT MACHINE INTERPRETATION. While there are many abnormalities in this ECG, it does not represent a paced rhythm. While there are exceptions, most paced rhythms represent either AV sequential pacing, right ventricular pacing, or bi-ventricular pacing.
RECOGNITION OF A PACED RHYTHM
Recognizing a paced rhythm can be difficult in some cases. Because pacemakers now have so many programmable features, there is a wide variety of ECG changes associated with them. Pacer “spikes” can be difficult to see in all leads. Finding evidence of the device on the patient’s chest or via patient history is a big help in reminding us to scrutinize the ECG for paced rhythm.
An AV sequential pacemaker or a right ventricular pacemaker will pace the ventricles via the right ventricle. This produces a WIDE QRS and a leftward axis, often causing Leads II, III, and aVF to be negative and aVL and aVR to be positive. Along with the wide QRS, we will see DISCORDANT ST CHANGES. That is, there will be ST depression and T wave inversion in leads with positive QRS complexes and ST elevation and upright T waves in leads with negative QRS complexes.
Bi-ventricular pacing can be a little more complicated to recognize, as the QRS can be narrow, with signs of fusion between the wave produced by the LV electrode and the RV electrode.
The frontal plane axis is usually far right – aVR will be positive. Lead I will be negative.
The machine is wrong: there is no indication of a pacemaker, and P waves are present, even though they are not noted in the "PR Interval" or "P Axis".
SO, THIS IS NOT A PACED RHYTHM – WHAT IS IT?
There are many abnormalities in this ECG, and they can be due to many different conditions. All ECGs should be evaluated in a clinical setting, with the patient’s symptoms, signs, and medical history all considered. That being said, I will point out what I see to be abnormal, and await our readers’ and experts’ opinions.
The rhythm is sinus, at a rate of 62 bpm. The PR interval is not given by the machine, but P waves are very obvious, and the PR interval is about .24 seconds, a first-degree AV block. The QRS complex is measured by the machine as 114 ms wide (.11 seconds). This is barely under the 120 ms usually required for diagnosis of wide-complex rhythm, and many would consider it adequate for a wide QRS. If we accept that this is a wide-complex QRS, then we should look for the ECG criteria for RIGHT BUNDLE BRANCH BLOCK and LEFT BUNDLE BRANCH BLOCK. In RBBB, there will be an rSR’ pattern in V1 and a small s wave in Leads I and V6. In LBBB, Leads I, V5 and V6 should have a broad, monomorphic, upright QRS. In this ECG, V5 and V6 have small s waves that contribute to the total width of the QRS, while the R waves are narrow in appearance. The term for a wide-complex, supraventricular rhythm that does not meet the criteria for either right or left BBB is INTRAVENTRICULAR CONDUCTION DELAY. (IVCD)
The frontal plane axis is -17 degrees, which is normal, but slightly to the left. That would be typical of left bundle branch block. However, the pronounced S wave in Lead II and the deep S wave in Lead III are not typical. In a study of S waves in these two leads, they have been found to be very rare in healthy hearts, and often associated with M.I. and cardiomyopathy. The abnormal S waves studied were deeper than the R wave was tall, however. S waves can be seen in Leads II and III in ventricular conduction defects that cause wide QRS – like LBBB and IVCD .
The ST segments and T waves in this ECG are clearly abnormal. T waves are inverted in Leads II, III, aVF; Lead I; Leads V4, V5, and V6; and they are biphasic in V3 as they transition from V2 (positive) to V4 (negative). The inverted T waves are very shallow in most leads, so it is hard to determine if they are symmetrical (indicating ischemia) or asymmetrical (with many causes). In cases of wide QRS, we expect to see DISCORDANT ST AND T WAVE CHANGES. That is, the ST and T waves will go opposite the main direction of the QRS. Right chest leads like V1 and V2, which have negative QRSs will have some ST elevation and upright T waves. The opposite is true over the left side, where we expect upright QRS complexes (I, aVL, V5, V6) and, in the case of wide QRS, depressed ST segments with inverted T waves. This is seen for the most part in this ECG, but Leads III and aVF seem to have CONCORDANT STs. It would be very helpful to know this patient’s current symptoms and recent medical history.
There are also Q waves in V1 and V2 that meet the criteria for "pathological Q waves", a sign of necrosis. However, large Q waves (or more accurately, loss of initial R waves) are common in V1 and V2, and may not be related to acute M.I. This is where knowing the patient's presentation and history would be very helpful.
As stated, the MAIN REASON for posting this ECG is to show students, beginners and advanced alike, that the machine’s interpretation should be taken with a “grain of salt”, and the interpreter should never rely solely on that interpretation. But we must also make the point that every ECG should be interpreted, when possible, in the setting of the patient’s presentation.
Related Terms:
Rate this content:
All our content is FREE & COPYRIGHT FREE for non-commercial use
Please be courteous and leave any watermark or author attribution on content you reproduce.
Comments
A Worrisome ECG without any History …
The ECG that Dawn has posted this week is a very interesting one — albeit unfortunately lacking in information about clinical correlation. That said, I’ll expand on her discussion about some interesting points.
The rhythm is fairly regular at a rate of ~60/minute. Upright sinus P waves with constant PR interval are clearly seen in lead II. The PR interval appears to be slightly prolonged (I’d estimate 0.22-0.23 second in duration). However, assessment of QRS duration is challenging. The computerized interpretation determined a QRS duration = 0.114 second, which would be at least slightly prolonged. I calculate a bit less than that. In measuring QRS duration — one should seek out the lead showing those QRS complexes that have clearly visualized onset and offset of the QRS in whichever lead manifests the apparently longest QRS interval. Despite subjective impression that the QRS complex in this tracing looks “a little-longer-than-usual … “ — in most leads, I do not measure the QRS to be more than half a large box in duration (or not more than 0.10 second). Perhaps the QRS measures a bit more than this in lead aVF … — but to me, the “concept that counts” — is that the QRS complex (and therefore associated ST-T waves) are not behaving as one might expect when a conduction defect is present. While admittedly, this is my subjective assessment — it IS relevant and important, because assessment of ST-T waves is clearly more challenging (and both less sensitive and less specific for ischemic change) when a conduction defect is present. BOTTOM LINE: I would not call the QRS prolonged here, and I would not call this IVCD — which means that we CAN more accurately assess associated ST-T wave changes. I see shallow-to-moderately deep T wave inversion in multiple leads. This T wave inversion is generally symmetric and is suggestive of ischemia, be it new, recent or old. The ST-T wave in lead V3 is particularly concerning — as the T wave in this lead is biphasic (first positive, then with terminal negativity) in a morphology, consistent with what one sees with Wellens’ Syndrome changes. One of course can NOT make a diagnosis of “Wellens’ Syndrome” without more information, including a history of prior chest pain that then resolves. And, one also needs to consider that other entities (ie, prior ischemia/infarction; recent reperfusion T waves; cardimyopathy; etc) may all produce a similar ST-T wave appearance.
FINAL “BOTTOM LINE” — Clinical ECG interpretation requires clinical correlation — and we have none here … If this was an ECG that passed my desk for my interpretation without provision of any clinical information — I would interpret ST-T wave changes here as consistent with ischemia of unknown age, but possibly recent or acute with NEED for immediate clinical correlation. At that point, I would promptly seek out prior records (and previous ECGs, if any), AND instantly pick up the phone to directly speak with the medical provider caring for this patient in order to obtain details of the history. We simply NEED to rule out the possibility of an ongoing cardiac event that may not have been recognized …
P.S. Although there are QS complexes in leads V1 and V2 — a small-but-definite r wave IS seen by lead V3, with transition occurring between V3-to-V4. Thus, although one cannot rule out the possibility of septal or anteroseptal infarction of uncertain age — statistically, it is much more likely than not when a definite r wave appears by V3 that the QS complexes in leads V1,V2 do not reflect infarction. It is only when there is absolutely no r wave at all in leads V1,V2,V3 in a patient without QRS widening and without LVH that it becomes more likely than not that infarction at some point has taken place.
Ken Grauer, MD www.kg-ekgpress.com [email protected]