
Submitted by jer5150 on Sun, 01/13/2013 - 10:12
Patient's clinical data: 46-year-old black man
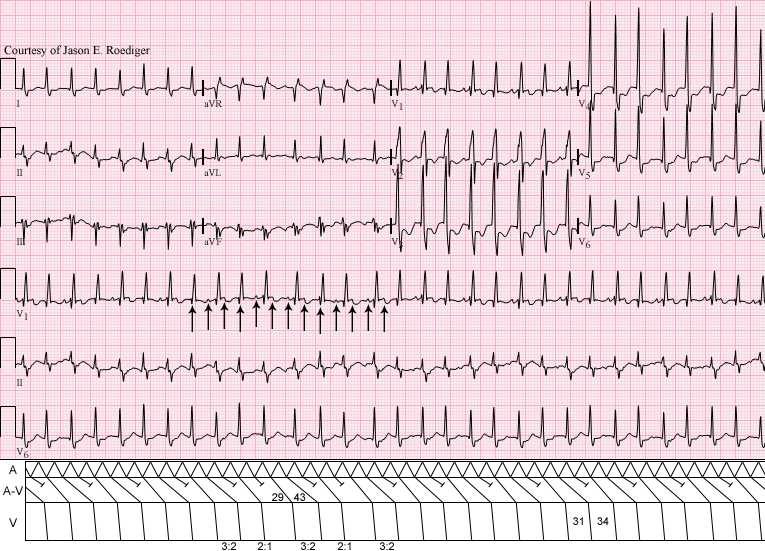
The computer's interpretation was "undetermined rhythm".
What is the source and mechanism of this rhythm?
Rate this content:
-

- jer5150's blog
- Log in or register to post comments
All our content is FREE & COPYRIGHT FREE for non-commercial use
Please be courteous and leave any watermark or author attribution on content you reproduce.
Comments
Thank you
Could be Flutter verable degree of block 150-160+, RBBB, RVH with strain, Q3S1 PE is a consideration. LAD LAH
Great Tachycardia Tracing
NICE! The key is in the middle of the tracing where the rate seems to slow a bit - allowing atrial activity to be seen in lead V1. Regular atrial activity at ~270/minute means atrial flutter as the underlying rhythm - which most probably is conducting via dual level Wenckebach (initially 2:1 - then progressive PR lengthening) through the AV node. Group beating is a key clue (alternating short-long cycles, albeit minimal difference between the short and long) - but consistent relationship between atrial activity distance to the next QRS. Usually with flutter - it is not the f wave closest to the QRS that conducts (due to concealed conduction).
I'm sure Jason will have a gorgeous laddergram of this.
Underlying RBBB with lots of anterior ST depression of uncertain significance given the rate and rhythm ...
Ken Grauer, MD www.kg-ekgpress.com [email protected]
Bigger picture
Looks like 2:1 rapid aflutter all the way through with rapid variable ventricular response.
Working my way back and then forward by measuring the p-p interval on the largest Cardiac cycle R11 and R12 , easiest to see on lead V1
All p's march out and are either hidden or distorted by a QRS or Twave
btw, is there a way you can make the pictures available bigger than they are? Compare size of strips on
your thread with is one for another blog not trying to criticize, its just hard to make out whats going on.
In anycase this looks like 2:1 atrial flutter,
Enlarging the image
Chireu,
The reason the images are the size that they are is because they need to be that size in order to fit into the laddergram template that I constructed several years ago in Adobe Photoshop. I'm working on designing a newer and larger template but it's still a work in progress. There are at least two different ways to enlarge the image:
1. If you are using Windows Internet Explorer, the easiest and most straightforeward way is to increase the "Change Zoom Level" at the bottom righthand corner of the browser window. First, click on the image above and it will reappear in the center of the sceen with the text "Download Original" in the lower lefthand corner. Click on this option and the ECG will appear in it's original size or you can just click here There is an icon of a magnifying glass with a positive/plus sign in the middle of the optic and the text "100%". To the right of that is a down-arrow. Left-click on that and a drop-down list will appear. Click on 200%. This should enlarge the image enough for it to fill the margins of your screen.
2. If that is not an option, then you can open a new Microsoft Windows Word Document and then copy and paste the ECG image into that document. At the top tool bar, click on the "View" tab and then click on the "Zoom" function. A new box will open labeled Zoom. Click the radio button for the option of "200%" and then click OK. Again, this should magnify the image so that it is full screen.
Hope this helps!
Jason E. Roediger - Certified Cardiographic Technician (CCT)
[email protected]
Let me add
Let me add
Since the is no relationship between the p waves and the QRS, rather than Rapid response, this might be 2:1 flutter with AV dissociation
INTERPRETATION
Jason E. Roediger - Certified Cardiographic Technician (CCT)
[email protected]
Several possibilities...
Two distinct possibilities come to mind when looking at this ECG. First thing that got my attention is the appearance of aVR with the R/S ratio and its bizarre appearance made me think immediately of a TCA overdose. Second, as someone else noted, the S1Q3T3 pattern and the RBBB morphology is suggestive of right ventricular strain pattern- could be PE or cor pulmonale, which would explain the 2:1 and 3:1 conduction that appears to be atiral flutter. A Lewis lead strip could clear up the atrial origin of the tachycardia...
Don Jordan, RN, ADN, ER nurse and ECG geek
"Atrial flutter with variable block"
In lead V1 morphology is better visible. Atrial rate around 250 with changing f-R interval suggestive of atrial flutter with variable block.