Displaying 1 - 5 of 5

Angioplasty LAD With Severe CAD

Click to open: 
Angiogram, Angioplasty of LAD, Coronary artery disease image

This image is taken from the patient featured in our Teaching Series, AWMI.  This shot shows the left anterior descending artery just after a stent has been placed and blood flow returned.  There had been a 100% occlusion prior to the angioplasty.  The circumflex and obtuse marginal arteries show evidence of severe coronary artery disease and multiple partial obstructions, and were also repaired.

Dawn's picture

Extensive Anterior Wall M.I. With Recent Inferior Wall M.I.

This 88-year-old woman was brought to the Emergency Department in cardiogenic shock.  Very little is known of her past medical history, but it was relayed to the EMS responders that she had been ill for about four days, when she became much worse.

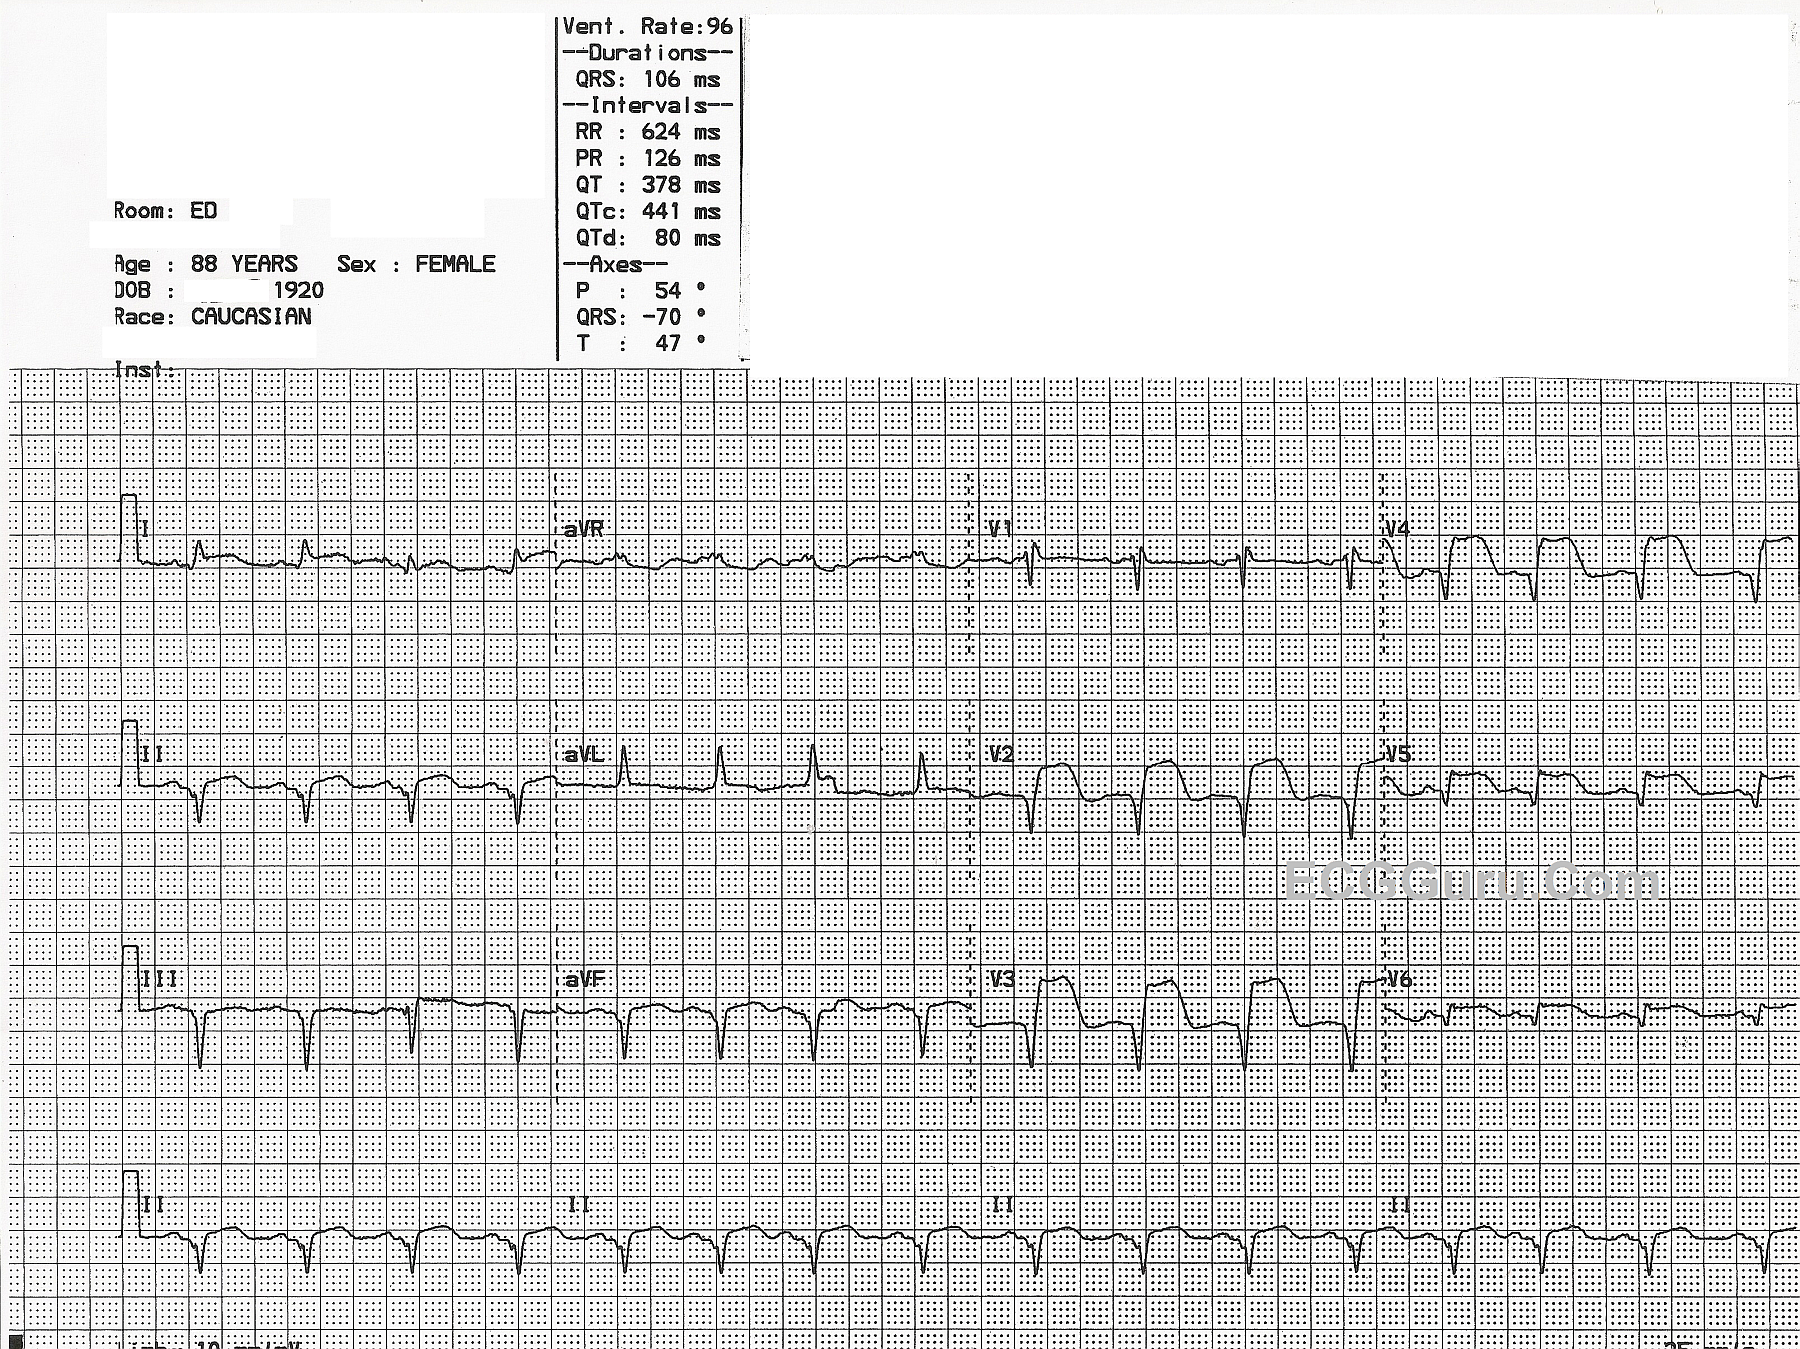
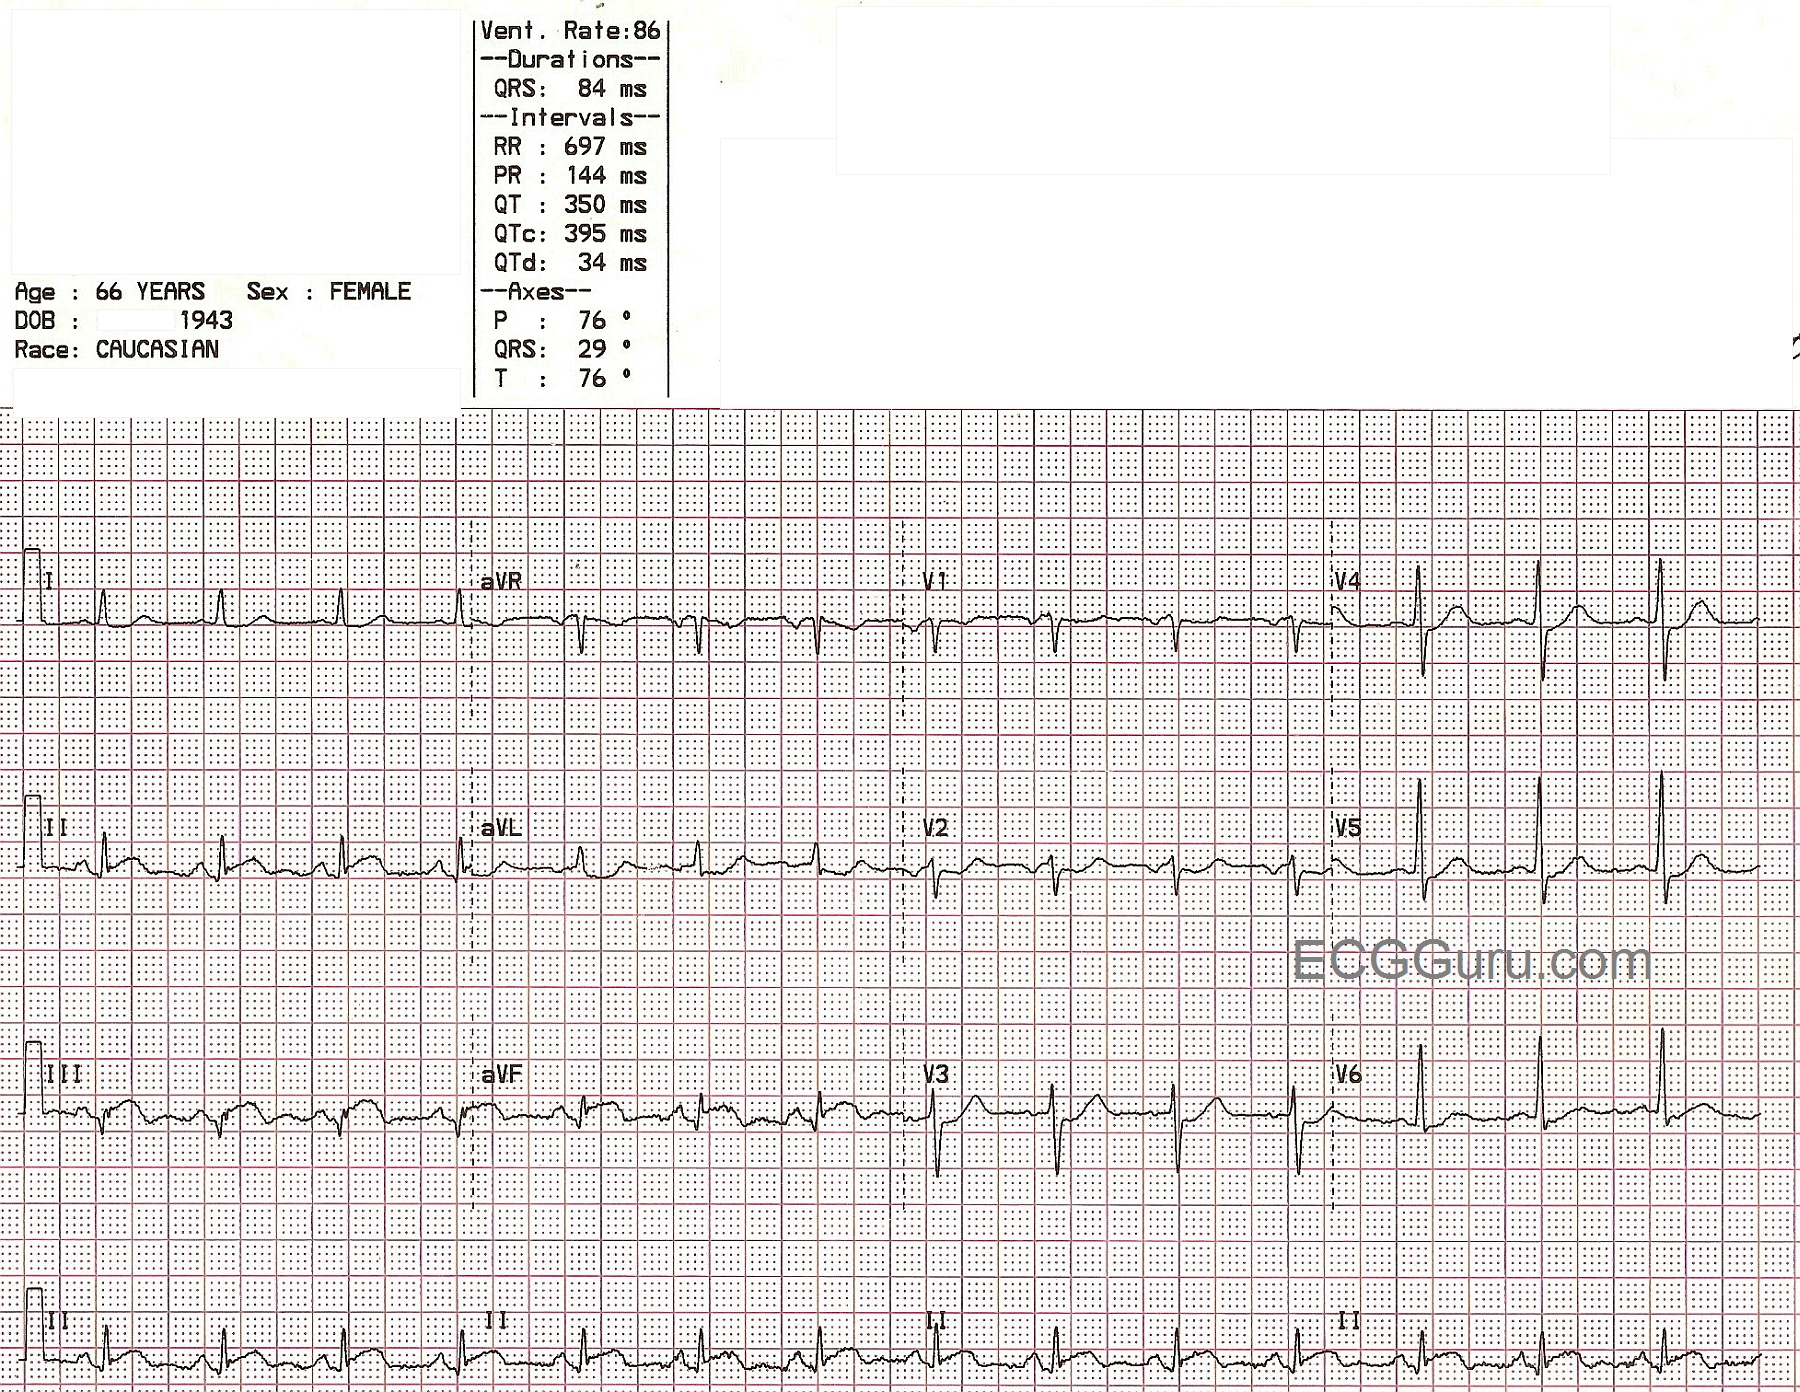
This ECG shows a large, acute anterio-lateral wall M.I., as evidenced by the ST ELEVATIONS in V2 through V6, Leads I and aVL.  To make matters worse, there are PATHOLOGICAL Q WAVES in Leads V2 through V6.  Pathological Q waves indicate areas of necrosis.  Because the myocardium facing the positive electrode is not electrically active, we "see through" the dead tissue to the myocardium on the opposite side of the heart.  Pathological Q waves could be thought of as "reciprocal R waves".  This represents a great deal of dead myocardium, which will be akinetic - not moving.

To make matters worse, she has pathological Q waves in the INFERIOR WALL as well, in Leads II, III, and aVF.  Her ST segments in those leads are flattened and possibly slightly elevated, but not much.  There are no reciprocal ST depressions in I and aVL, because they are affected by the anterior - lateral wall M.I., and are elevated.

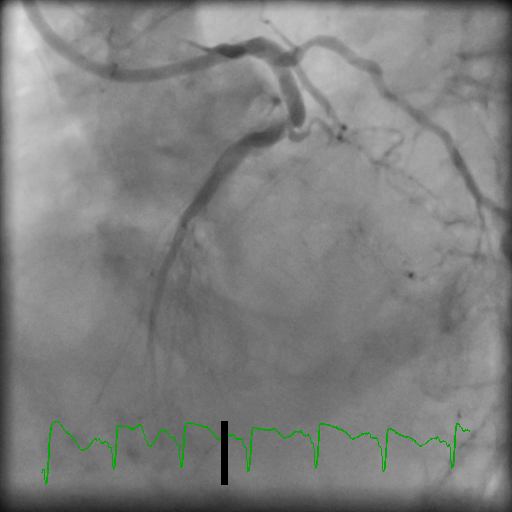
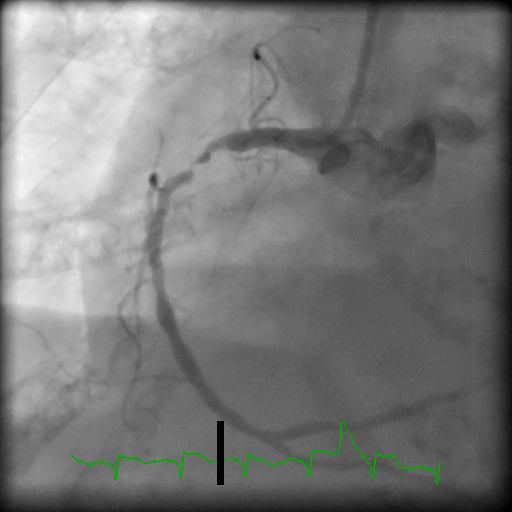
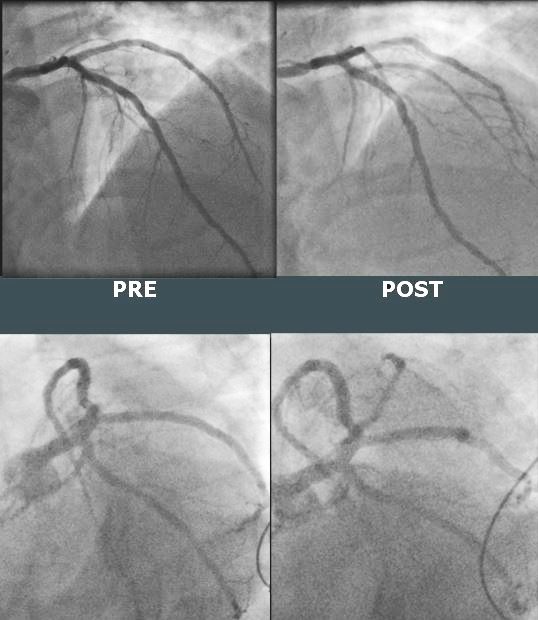
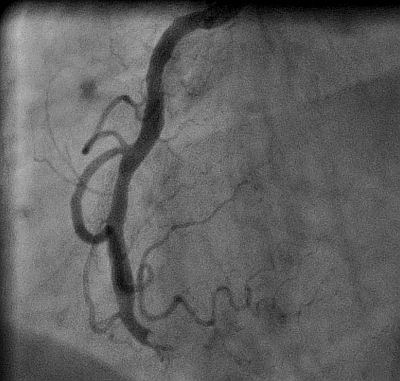
The accompanying photos show her left coronary artery angiogram indicating severe coronary artery disease and a "missing" left anterior descending artery.  This is due to a proximal lesion that occurred around the area of the first diagonal artery, cutting off blood flow to a very large part of her anterior-lateral wall.  The photo of the right coronary artery shows a very tight lesion which is allowing some blood to pass.  The Interventionalist felt that this represented a resolving 100% occlusion (remember, she had been sick for four days).  As the blood clot broke up, blood flowed again, lowering the ST segments.  Unfortunately, permanent damage had already been done, and she had Q waves in the inferior wall also.  This leaves very little of her heart beating, and it is easy to understand why she presented in shock.  She suffered cardiac arrests several times during the procedure, and was managed with a balloon pump and ventilator.

Unfortunately, this type of injury is not survivable, and she died in the CVICU a few hours after her procedure. She contributes to our education by demonstrating the cumulative effects of M.I., especially when permanent damage occurs.  For a look at her ventriculogram, to understand the devastating effects of these injuries, go to our You Tube channel.

Dawn's picture

Acute Lateral Wall M.I.

This week's ECG for your collection was kindly donated by Dr. Stasinos Theodorou, interventional cardiologist with the Limassol Cardiology Practice in Cyprus. It offers a wonderful teaching opportunity, and illustrates how valuable an ECG can be in locating a lesion during an M.I.   Dr. Theodorou previously posted this ECG and the angiograms from the same patient on FaceBook, and he has offered them to the users of the ECG Guru website  free of copyright.

Dr. Theodorou reports that the culprit lesion in this M.I. was initially very difficult to find on angiogram.  In this case the culprit was an ostially occluded second diagonal artery which, due to the anatomy, was almost impossible to spot from the initial diagnostic images.  There was no "stump" because the occlusion was in the ostium - the beginning of the artery.  The patient also had a significant right coronary artery lesion, but it was not the cause of the M.I. because the RCA perfuses the right ventricle and inferior/posterior wall of the left ventricle.  The ST elevation in this ECG is in I and aVL - the area of the high lateral wall.  Because the  ECG appeared to be inconsistent with the angiogram, Dr. Theodorou obtained further projections, allowing him to identify and treat the offending lesion.  This illustrates the importance of the ECG in locating coronary artery lesions, even in this age of high technology and cath labs.  The interventional cardiologist's proficiency in ECG interpretation enabled him to find this "invisible" lesion.

We are grateful to Dr. Theodorou for sharing this valuable learning experience with us.  You can find more from Dr. Theodorou on his website, FaceBook page, and here, on our "Ask the Expert" page.


Angiogram. Diseased Left Coronary Artery, Pacemaker, Swan Ganz Catheter

Click to open: 
Angiogram of Left Coronary Artery With Pacemaker and Swan Ganz Catheter

An angiogram of the left coronary artery of a patient with multi-vessle coronary artery disease.  Pacemaker electrodes are seen in the right atrium and right ventricle.  A Swan Ganz catheter is also visible, with balloon inflated.

Dawn's picture

Inferior Wall M.I. With Angiogram and Ventriculogram


This ECG was taken from a 66-year-old woman who presented to the emergency department complaining of chest pain and shortness of breath.  She attributed her symptoms to her COPD, but stated that her aerosol treatment had not helped.  She waited for some time before deciding to go to the hospital, then drove herself. In the emergency department, she had blood drawn, an I.V. started, and an aerosol treatment of albuterol.  She was then taken to the radiology dept. for a chest xray.  When she returned, a 12-lead ECG was done.  45 minutes had passed since she first arrived at the hospital.  This ECG is shown here.  It shows ST elevation in the inferior leads:  II, III, and aVF.  The patient was taken immediately to the cath lab, where her right coronary artery was found to have a 100% occlusion. (See image accompanying this ECG).  Angioplasty was successful, and stents were placed in the artery.  The patient was found to have anemia, with a hemoglobin of 5.5, and she was given a blood transfusion.  During the cath procedure, a ventriculogram was performed, which showed a stunned and akinetic inferior wall.  Unfortunately, subsequent ventriculogram performed several weeks later showed the lack of motion of the inferior wall to be permanent.  The ventriculogram is also posted here, and at this YouTube link, so you will be able to show your students the mechanical effects on the heart of a delay to treatment in acute STEMI.  See our YouTube site for more ventriculograms and cath videos.

All our content is FREE & COPYRIGHT FREE for non-commercial use

Please be courteous and leave any watermark or author attribution on content you reproduce.