Displaying 1 - 10 of 37
Dawn's picture

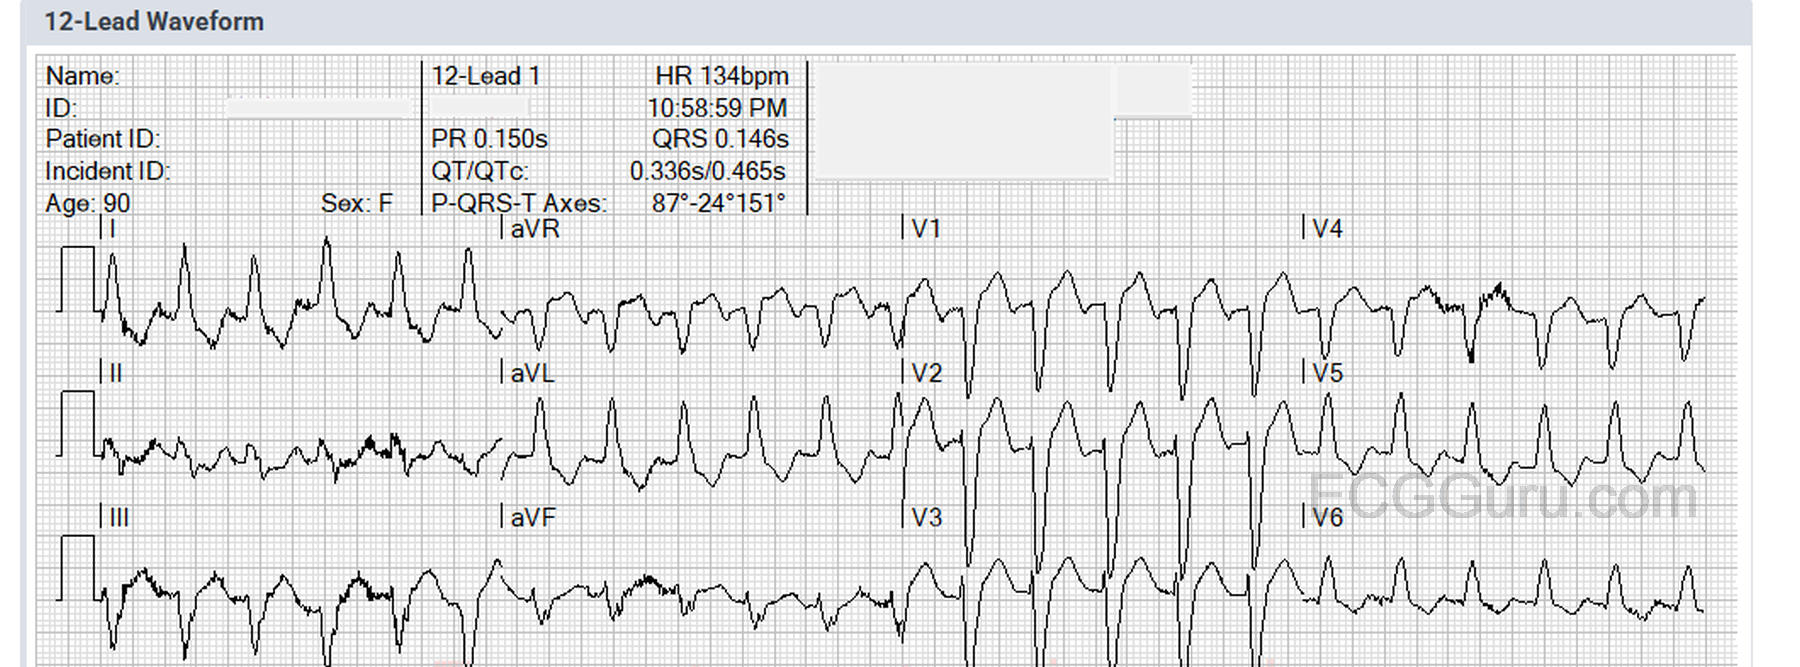
Instructors' Collection ECG: Left Bundle Branch Block in Patient With Takotsubo Myocardiopathy

The Patient:   This ECG was obtained from a 90-year-old woman who was complaining of feeling short of breath while lying in bed. Patient denied relevant medical history (respiratory or cardiac) and denied taking any medications. She also denied chest pain, nausea, or any other symptoms. She was found sitting upright in a recliner with mild subjective respiratory distress. She was completely alert and oriented, and was able to stand and transfer to the EMS stretcher.  We do not have a record of her initial vital signs or lung sounds, but her initial SPO2 on room air was 80%.  This improved to 100% on 15 L of O2 via NRB.  She was transported to the hospital without incident.

 The ECG:  The ECG shows a rate of 134 bpm.  The rhythm is regular.  P waves are difficult to see because of the muscle tension artifact and the rate. I strongly suspect there is a P wave at the end of the T – best seen in aVR, in which you can see the negative P wave right after the T.  The QRS is wide at 146 ms, and the QTc is borderline long at 465 ms, but is affected by the wide QRS being part of the measurement. There is, at this time, no simple and reliable method of evaluating QTc in the setting of wide QRS, but there are formulas available, and being evaluated.  

Dr A Röschl's picture

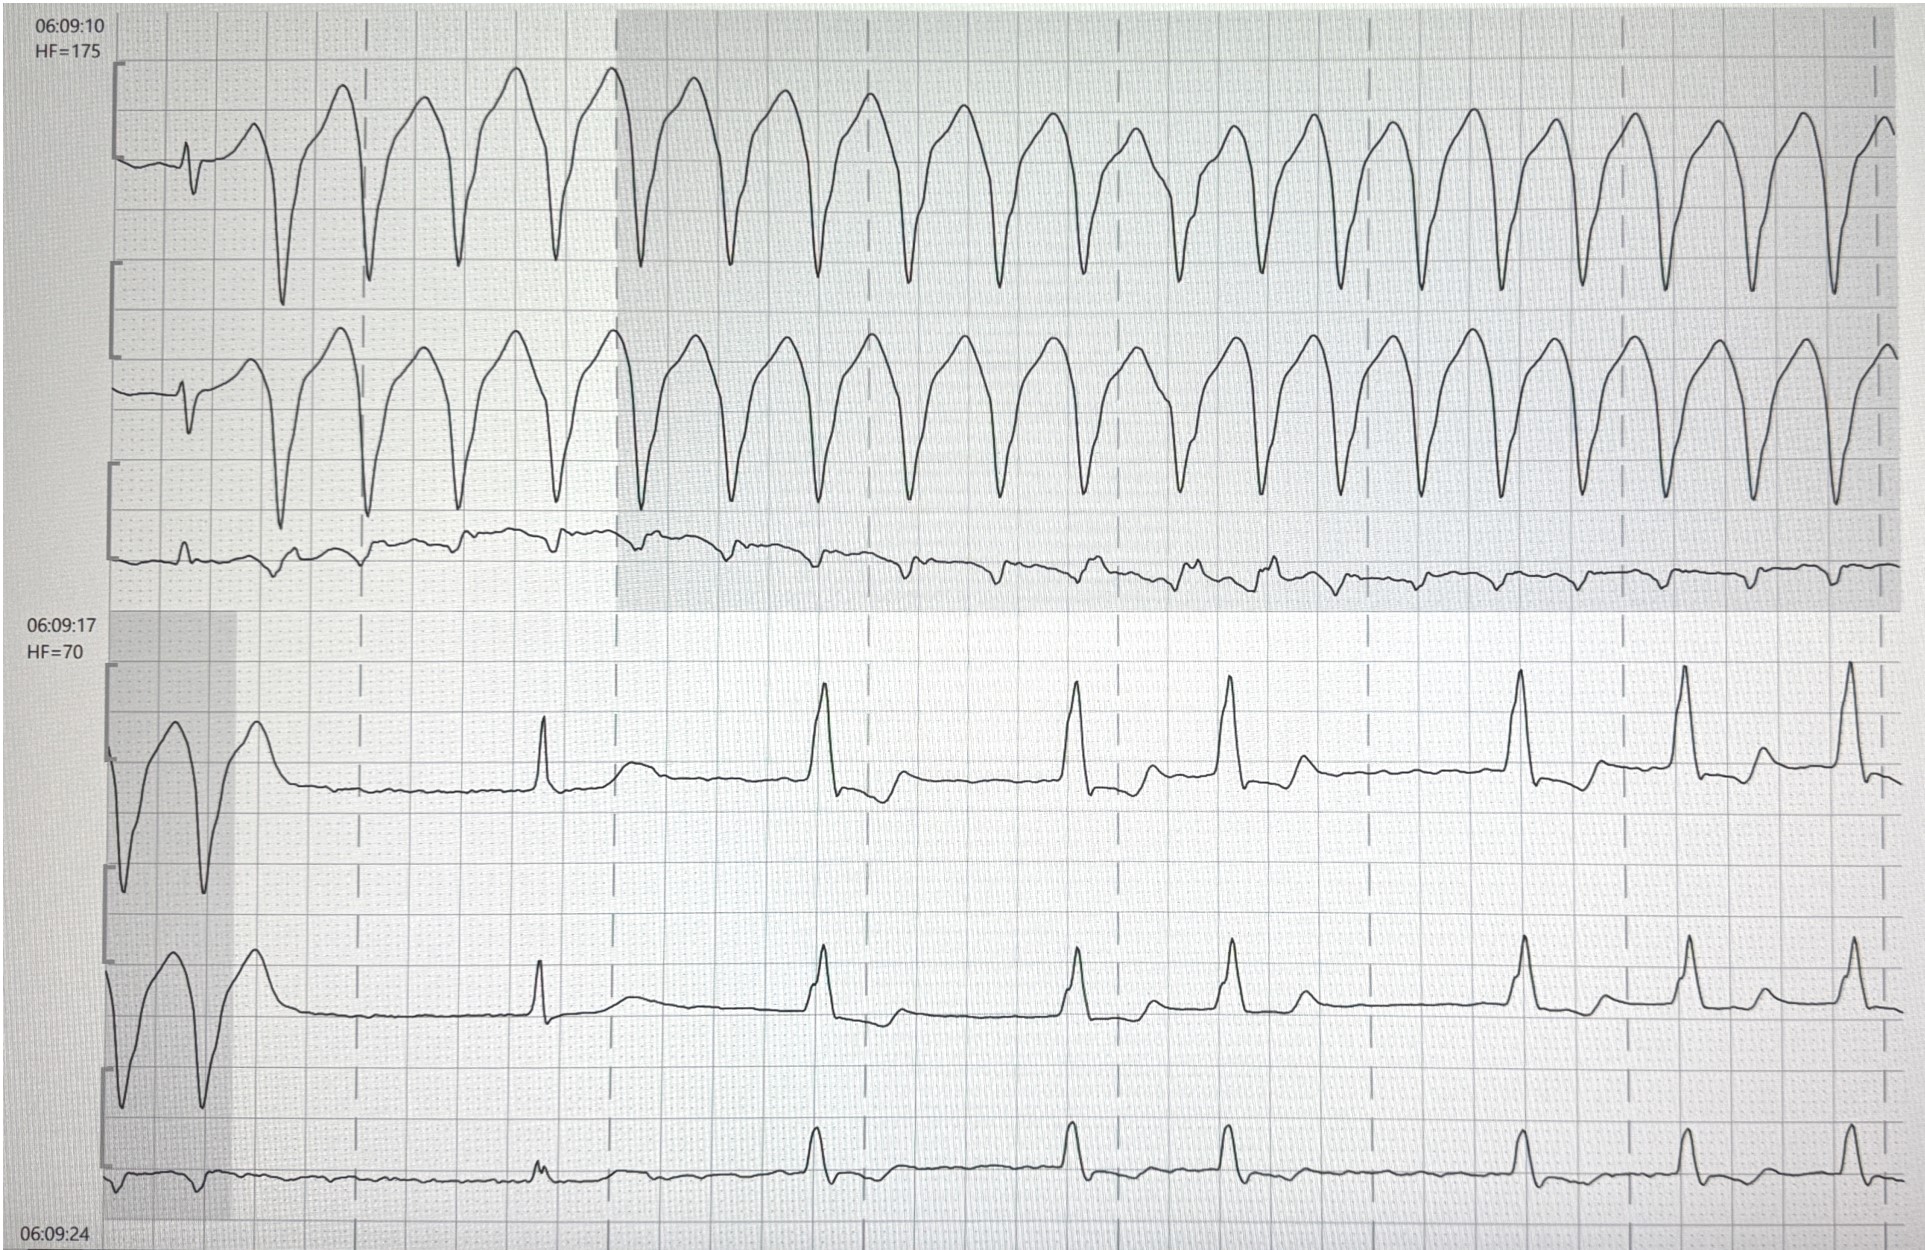
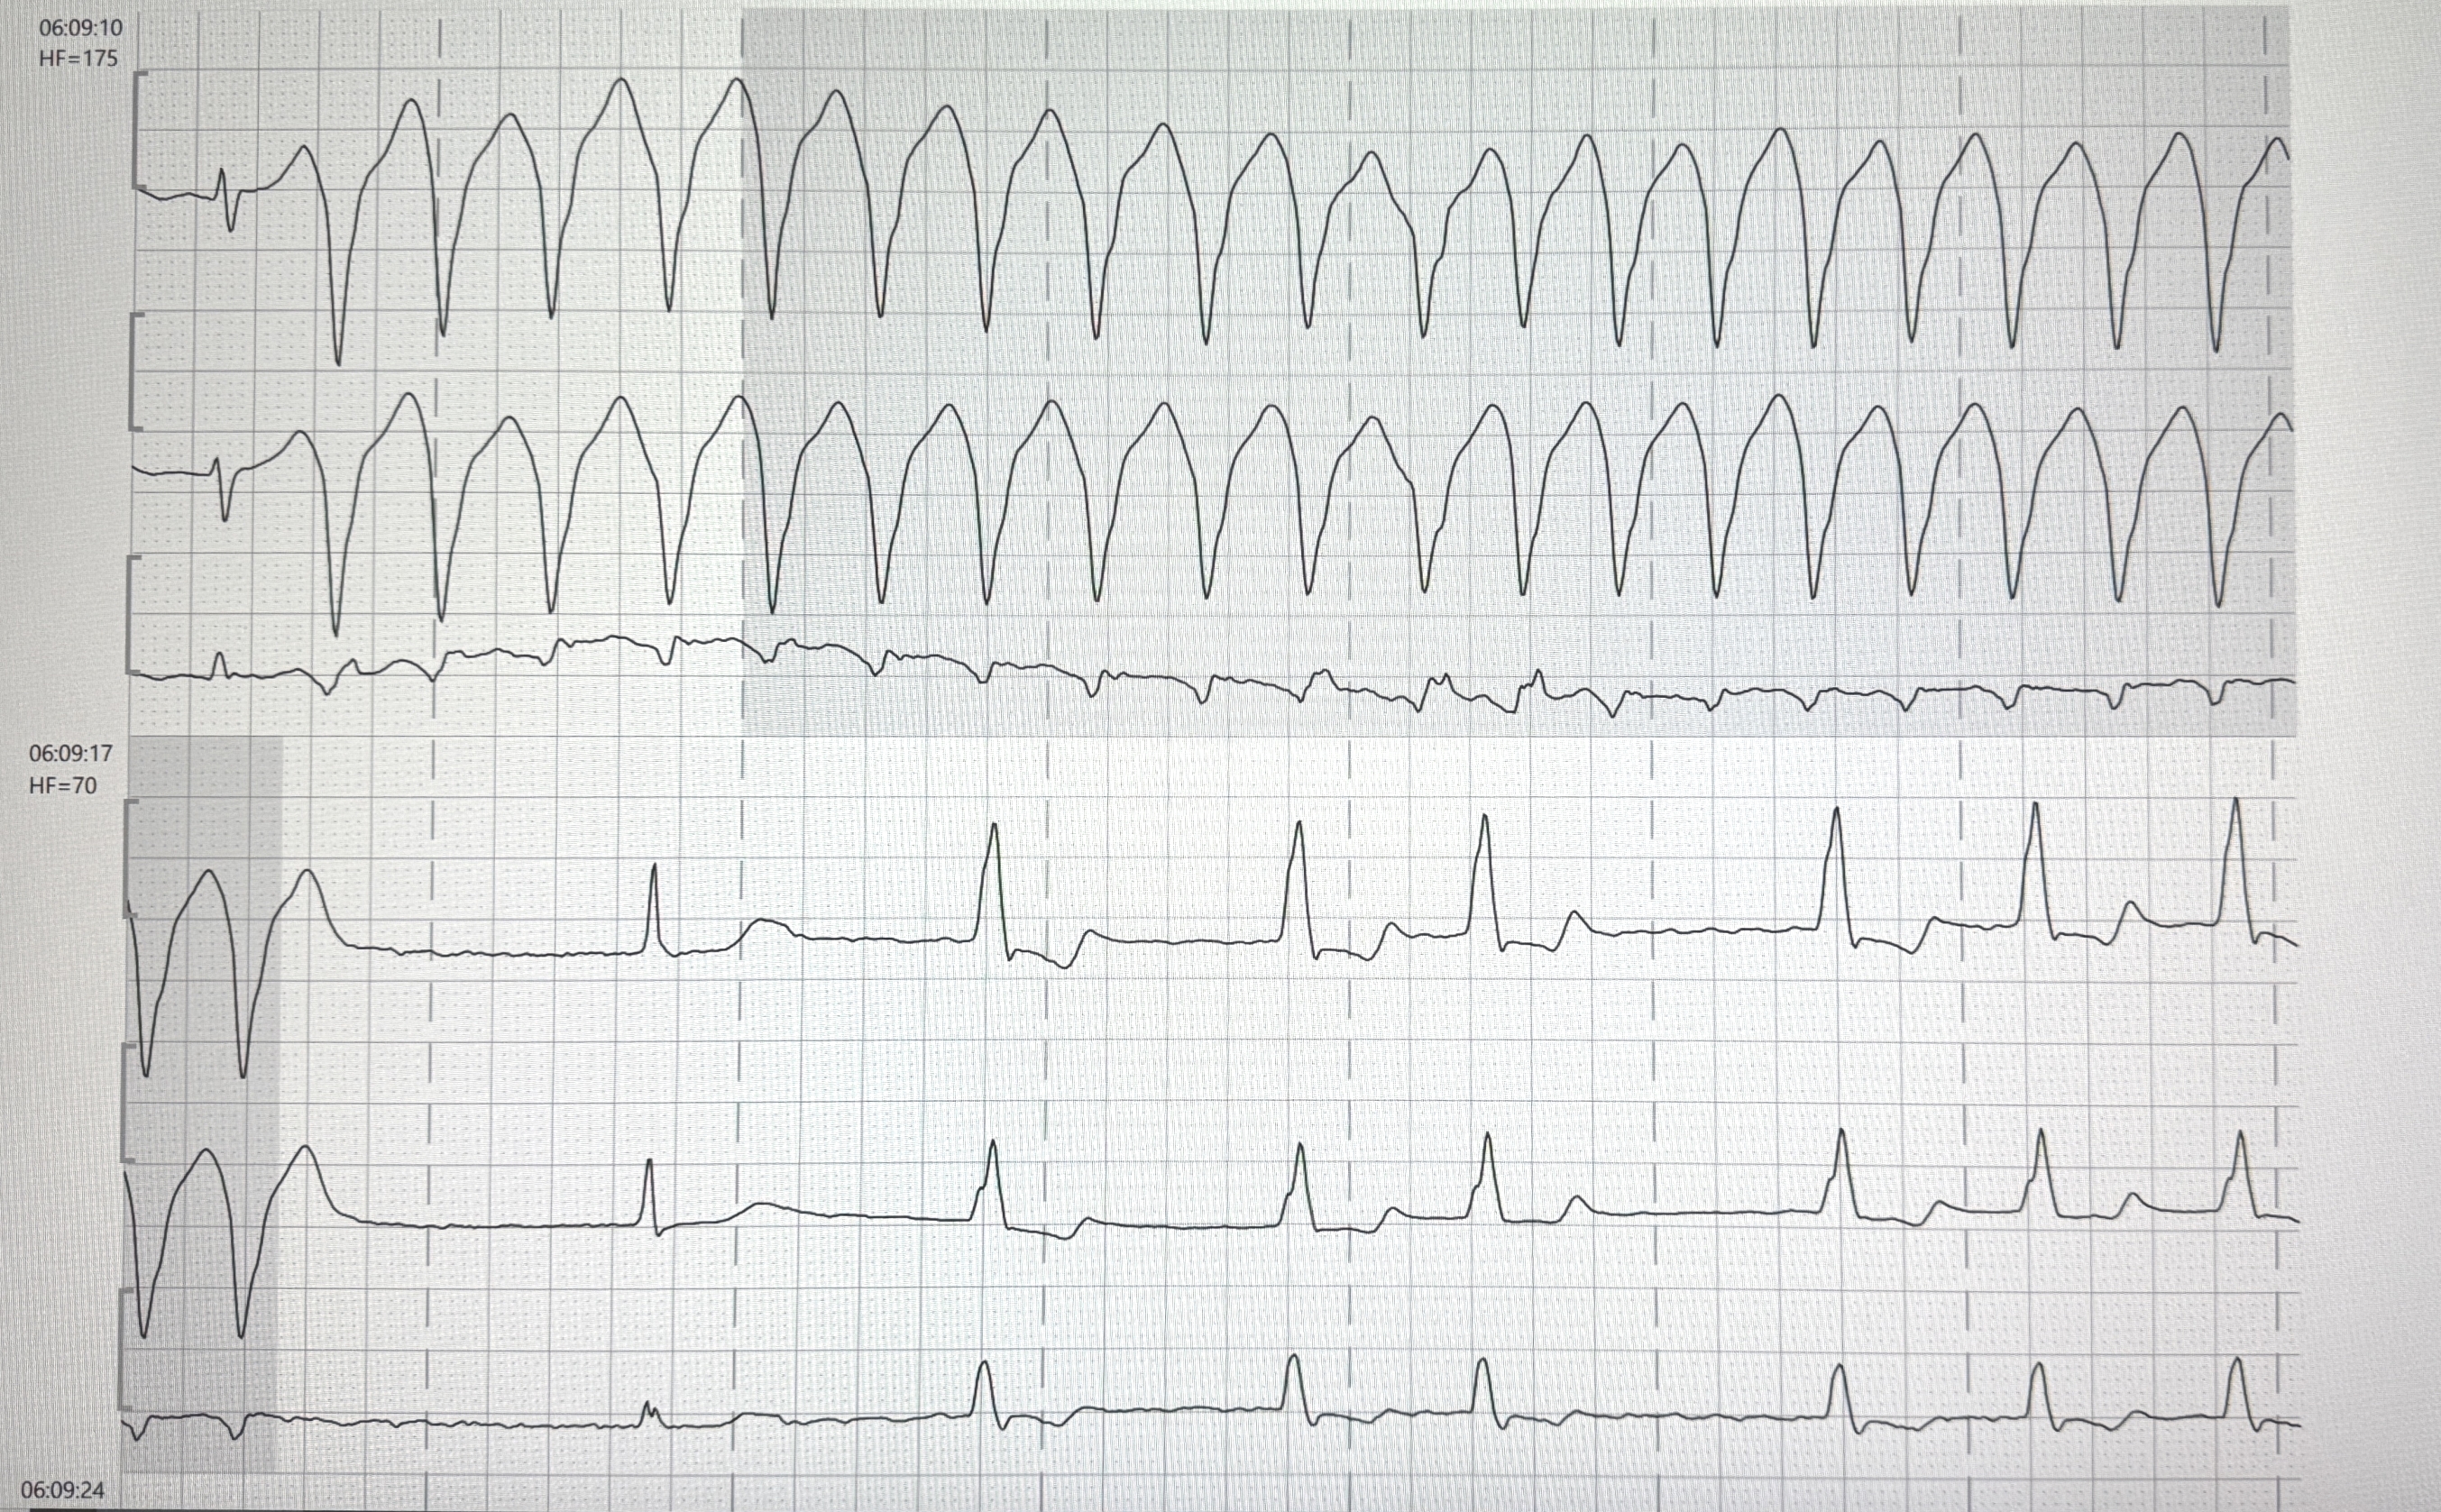
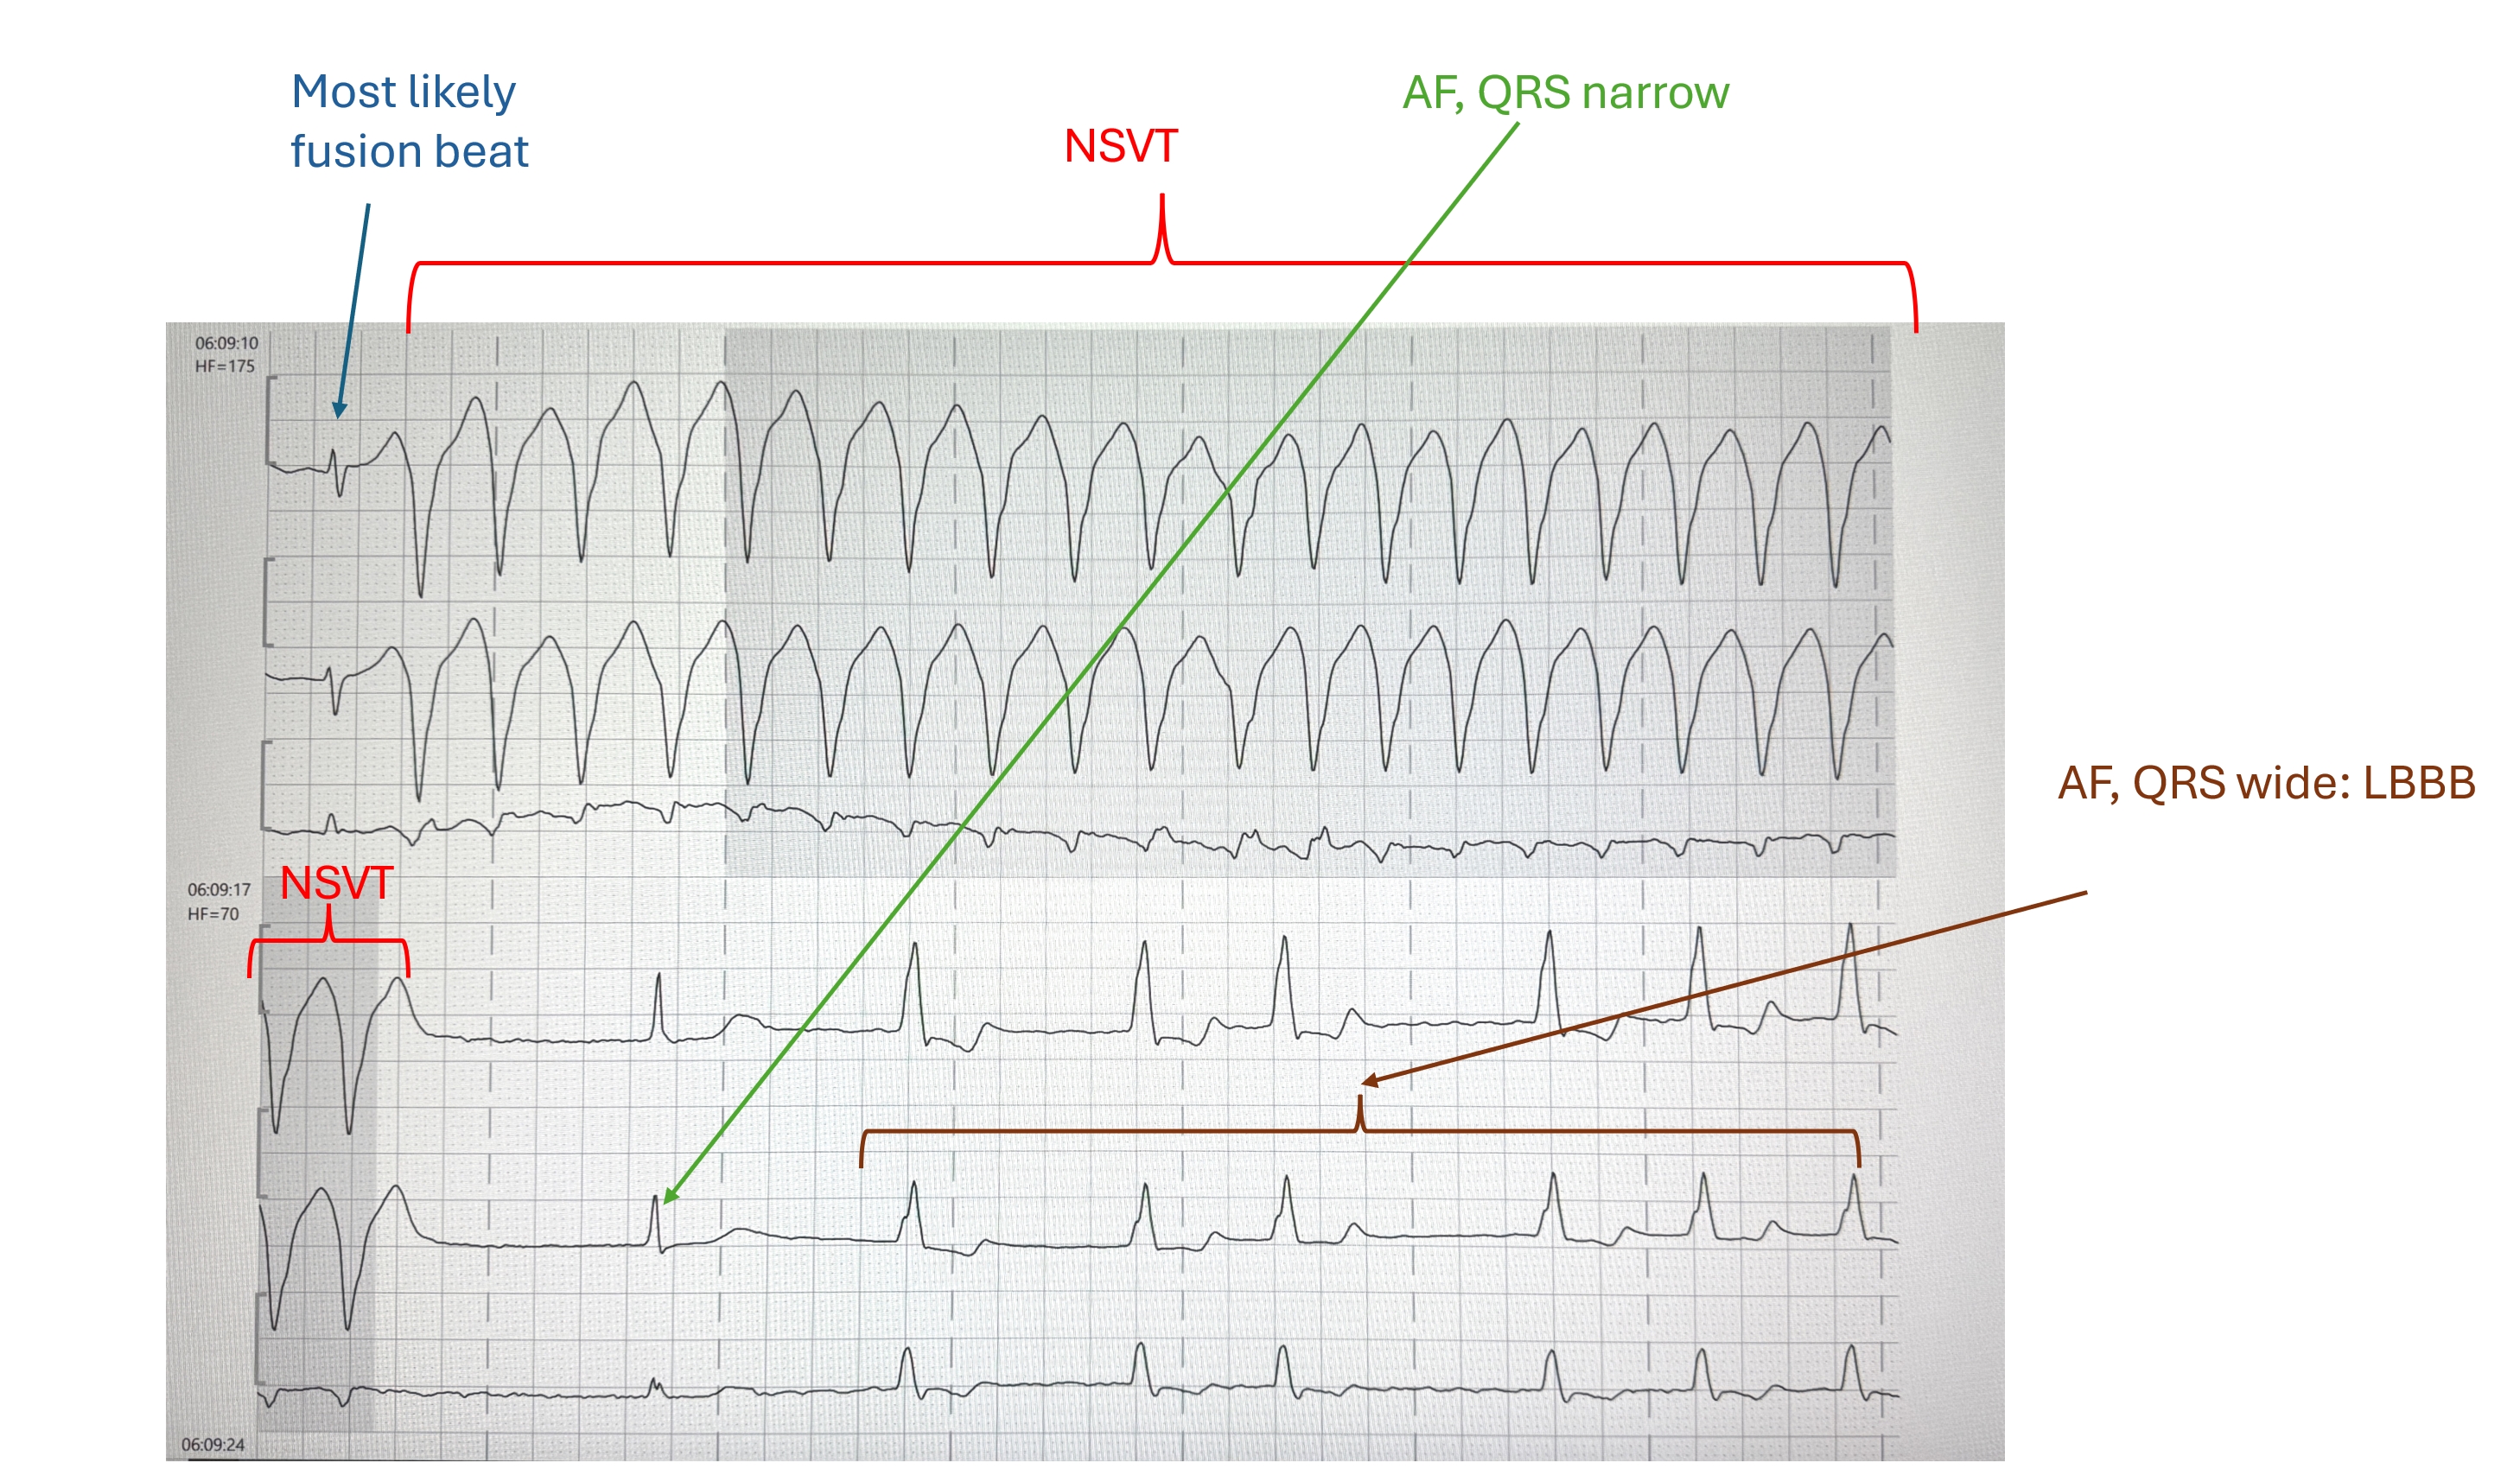
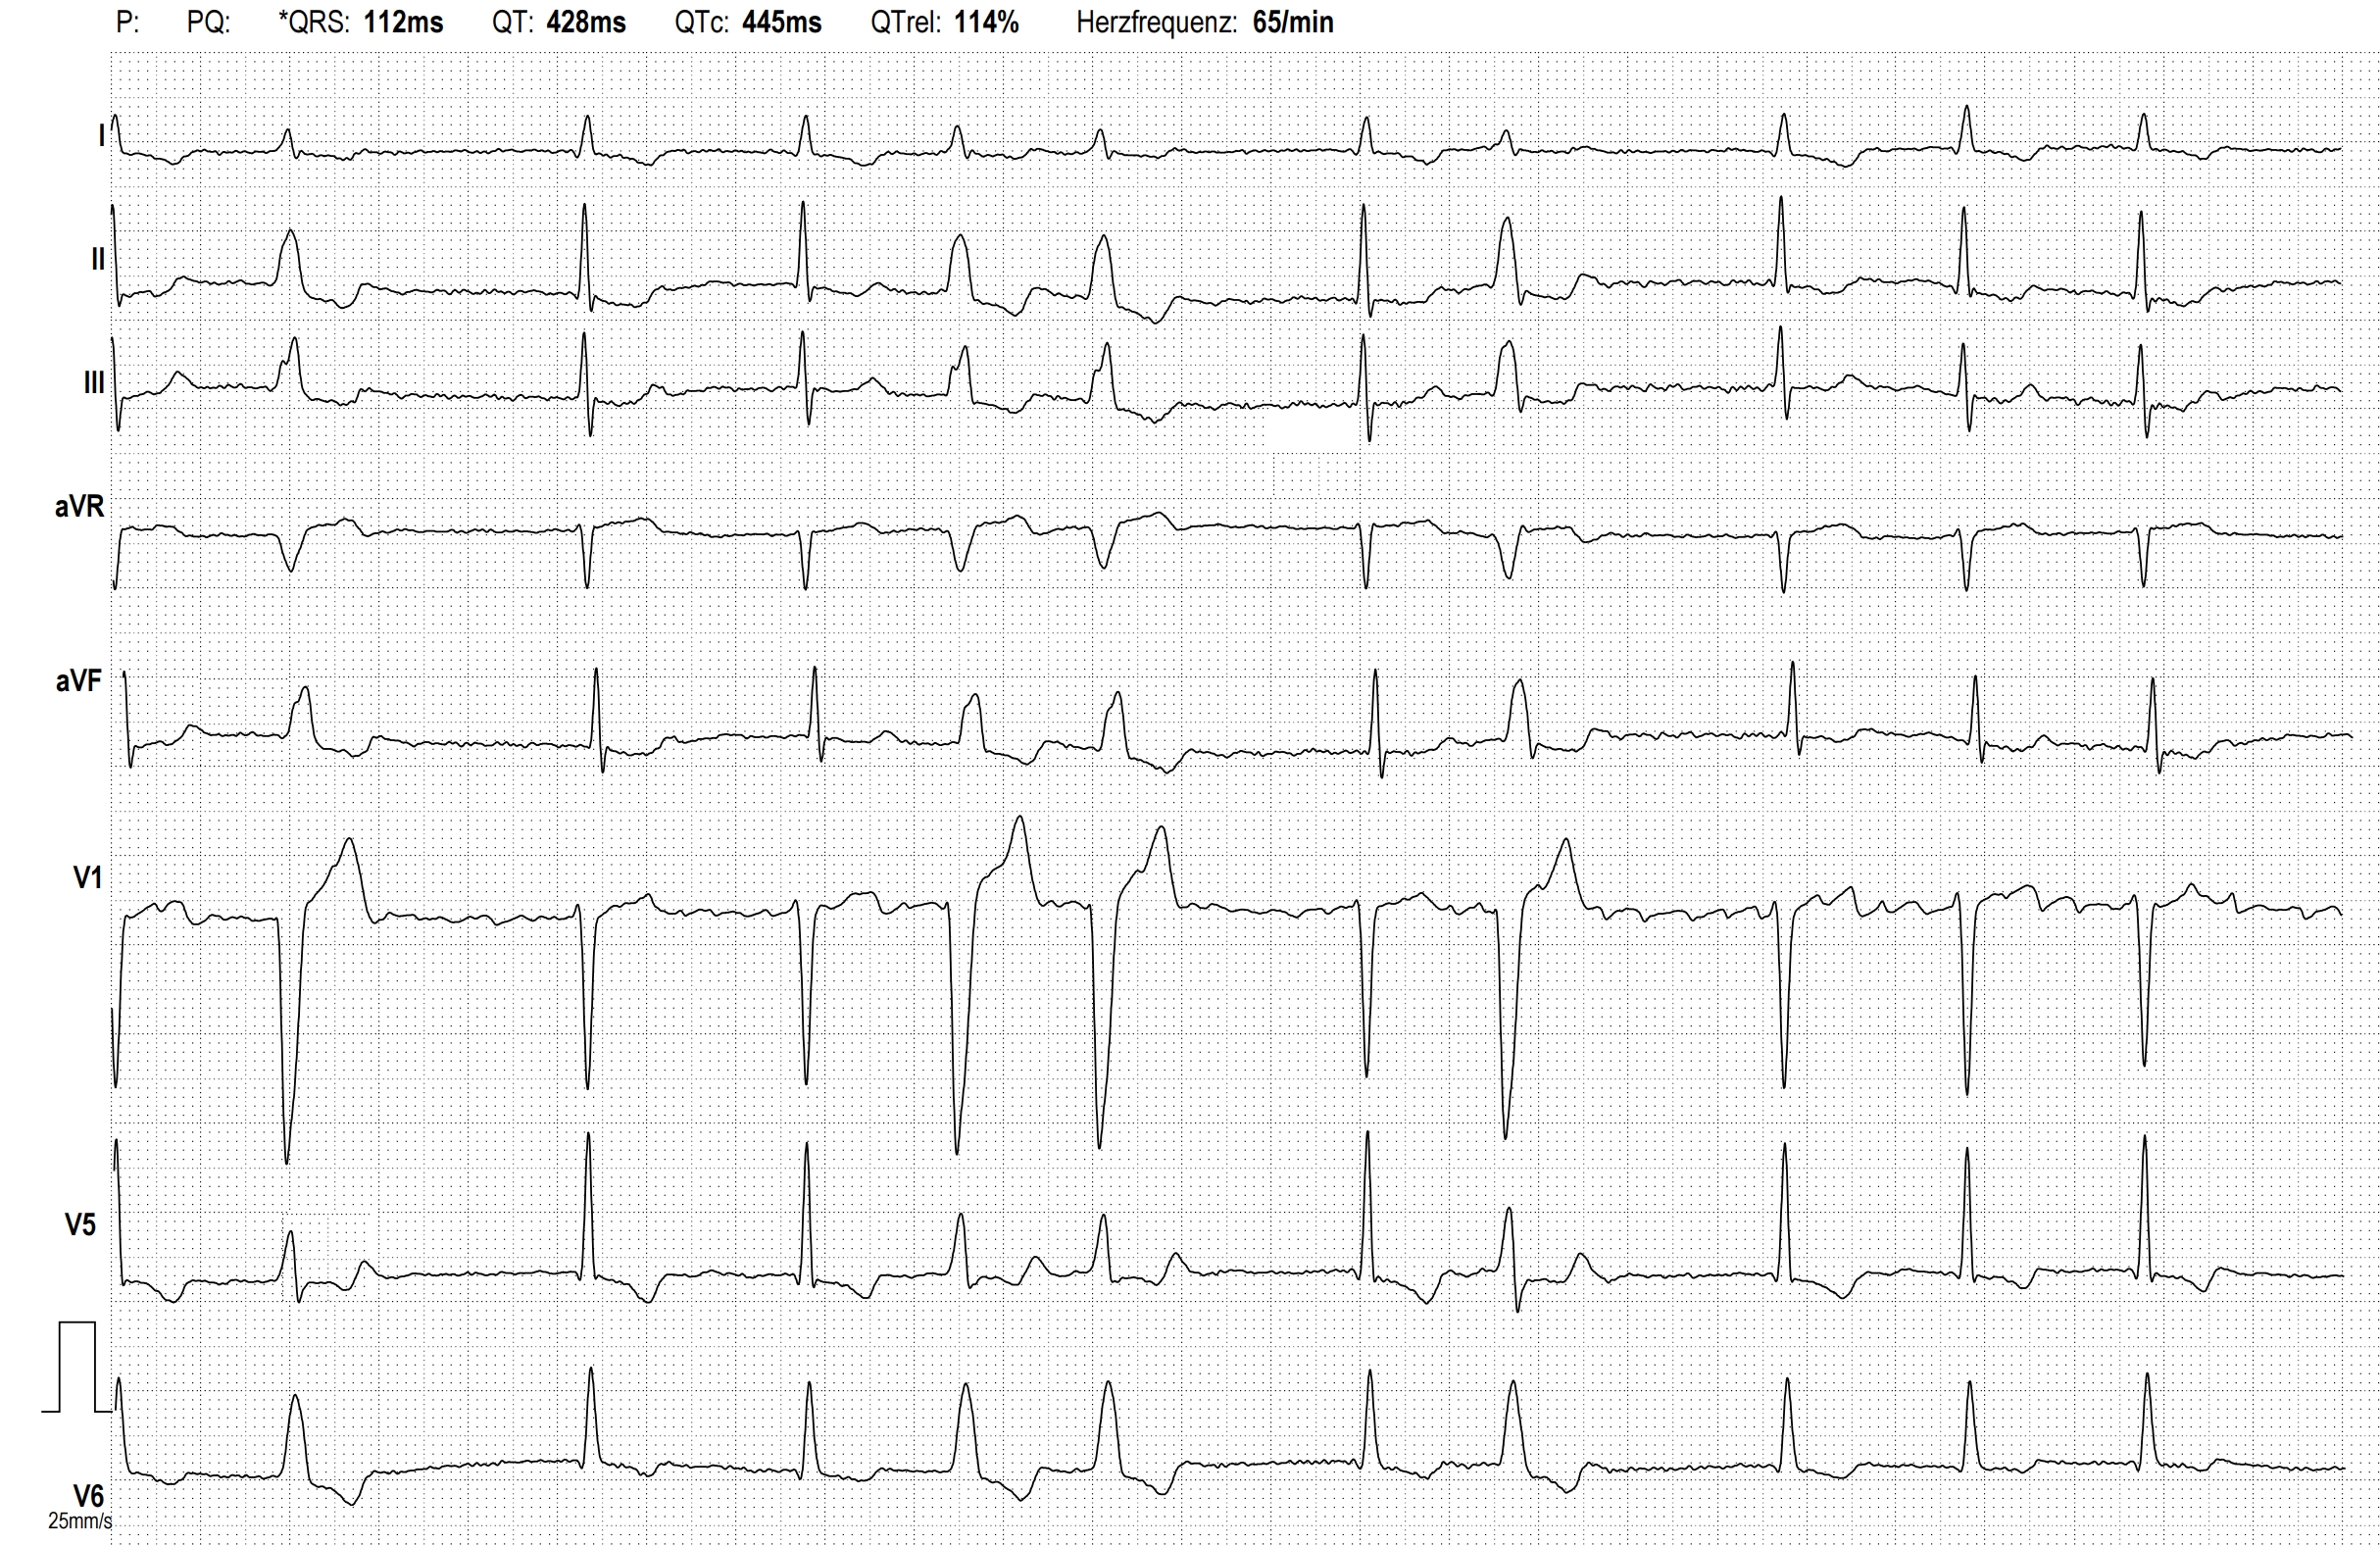
VENTRICULAR TACHYCARDIA, ATRIAL FIBRILLATION AND ABERRANT CONDUCTION

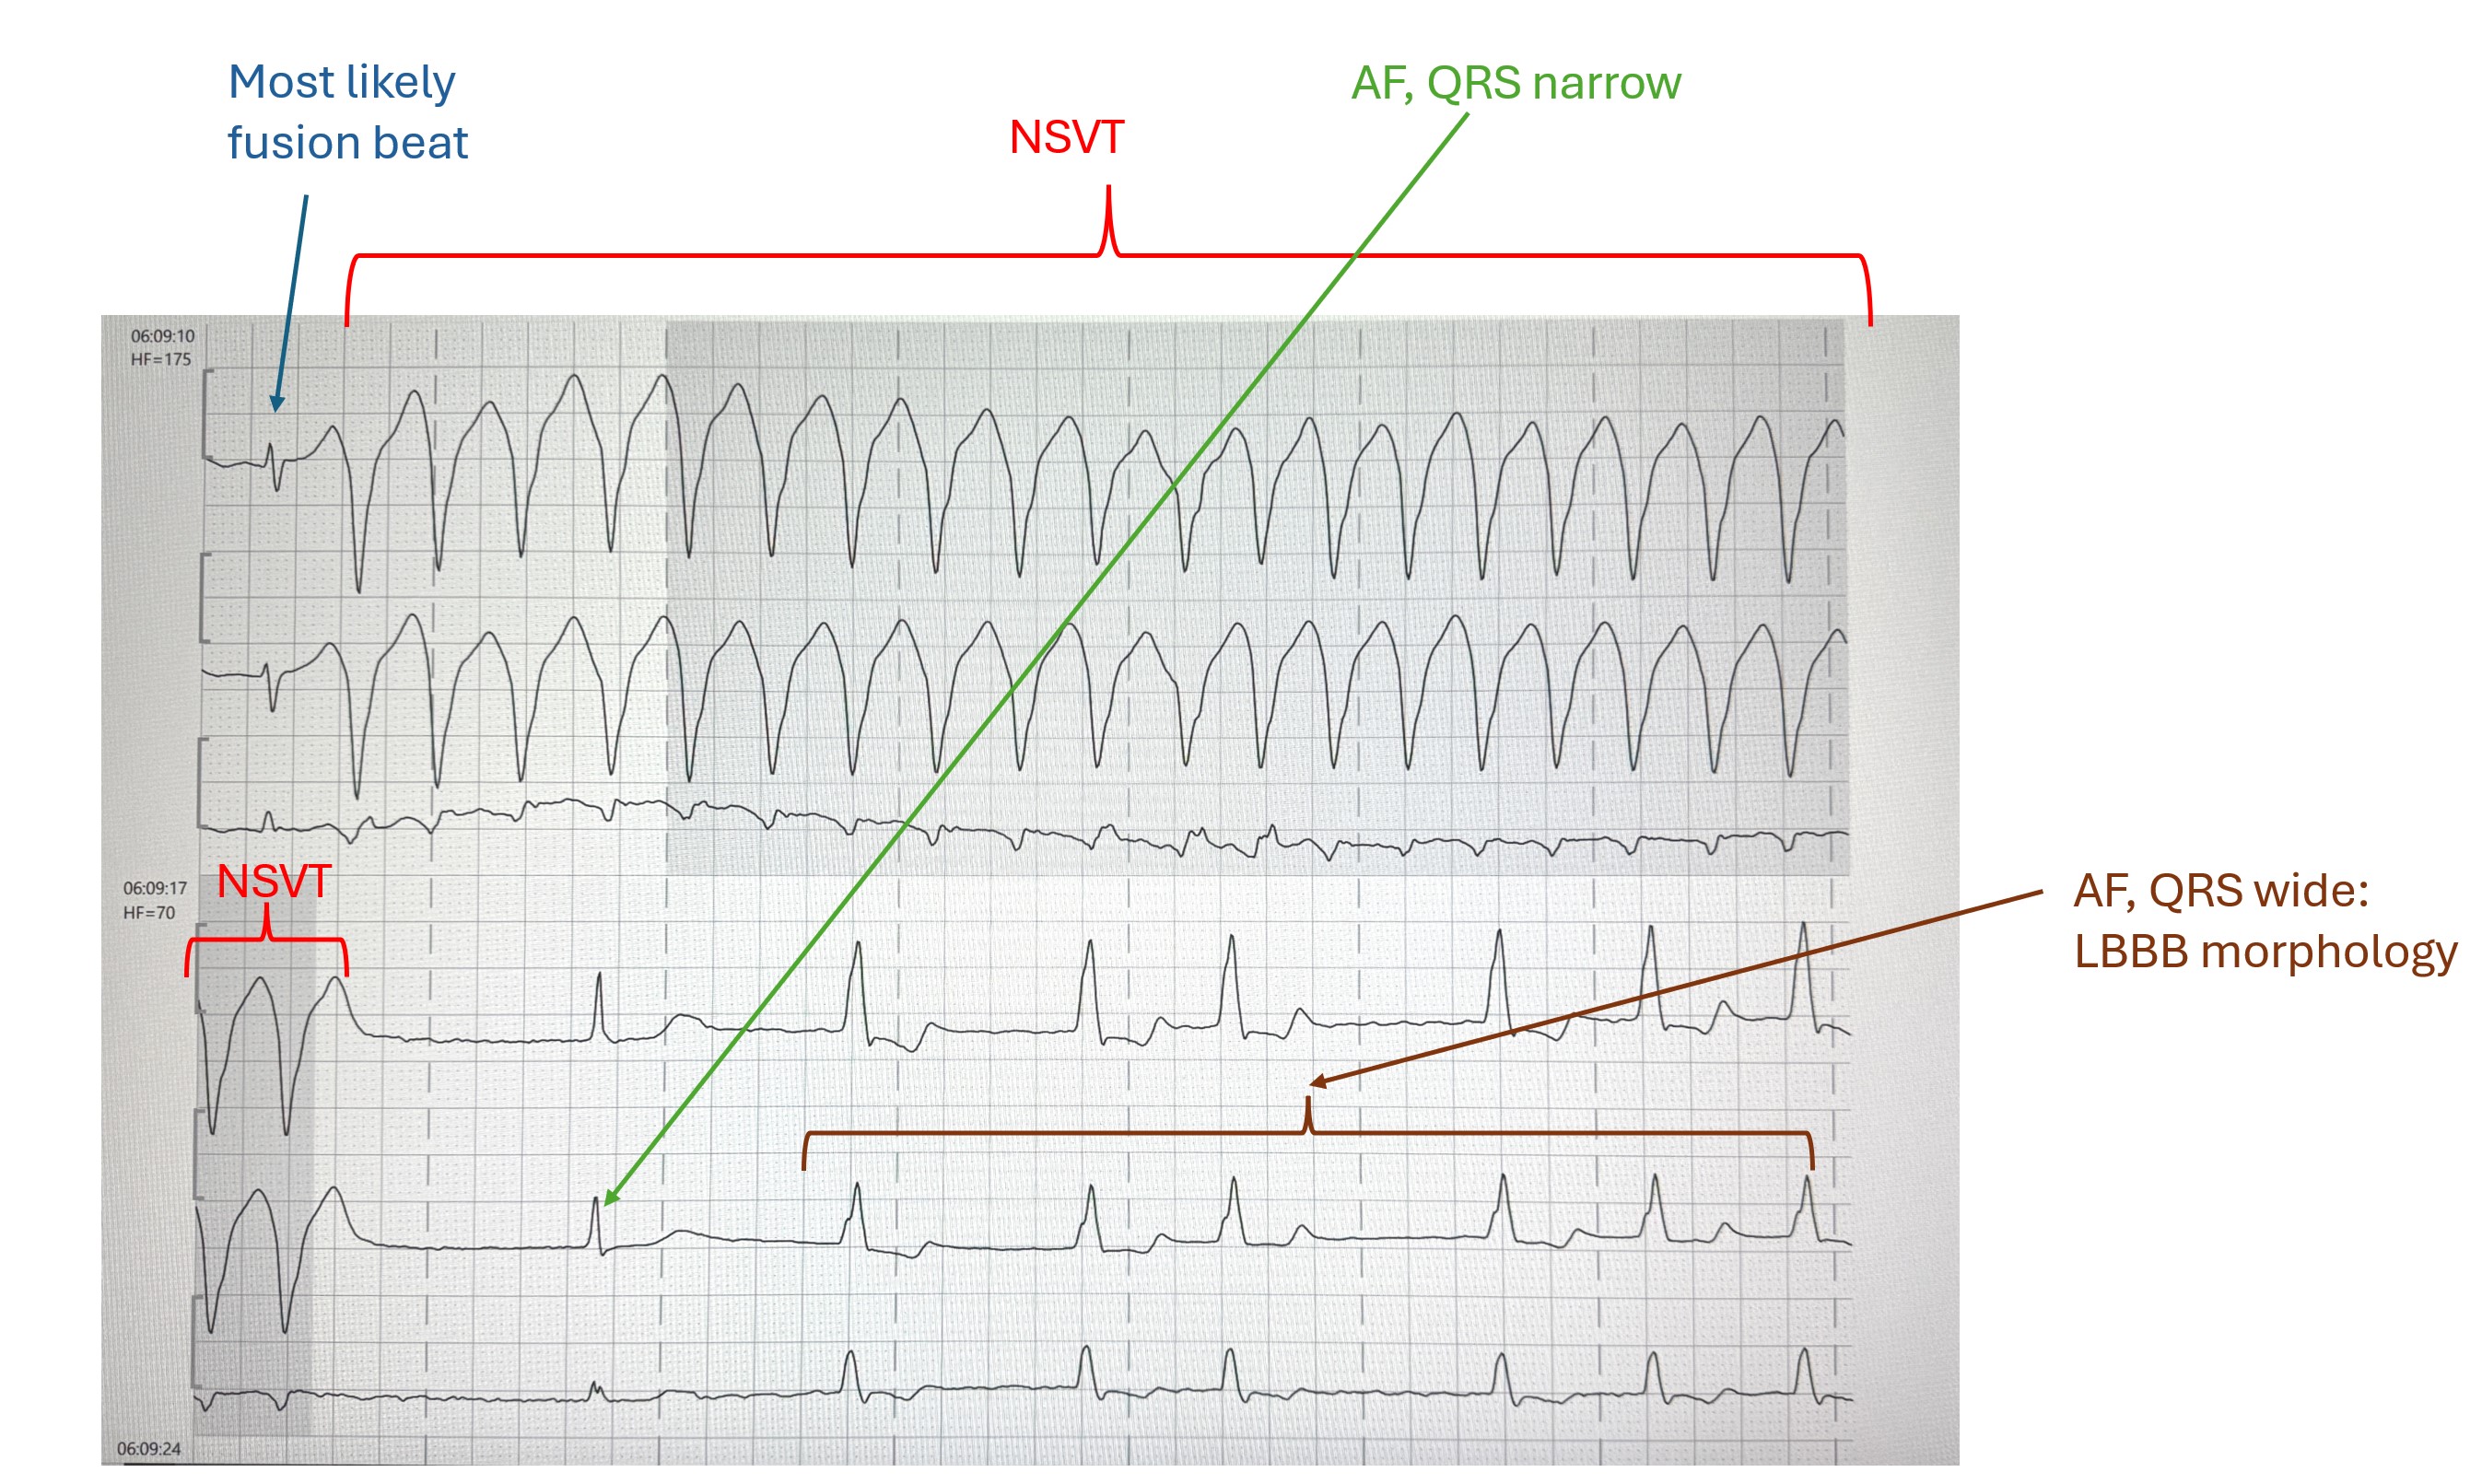
It is not uncommon for several different abnormal changes to occur simultaneously in an ECG, as in this Holter ECG strip. The explanation of the visible ECG changes can be found in the 2nd image

Dr A Röschl's picture

NONSUSTAINED VT

Extract from a Holter ECG, 2 continuous strips, recorded at 25 mm/s. At the top you can see a broad complex tachycardia without recognizable P waves, which ends spontaneously after 2 beats in the lower section. This is a ventricular tachycardia (VT). The very first beat in the 1st strip is most probably a fusion beat. After the end of the VT in the 2nd strip, a narrow QRS complex appears, here you can also recognize that atrial fibrillation is present.

Dawn's picture

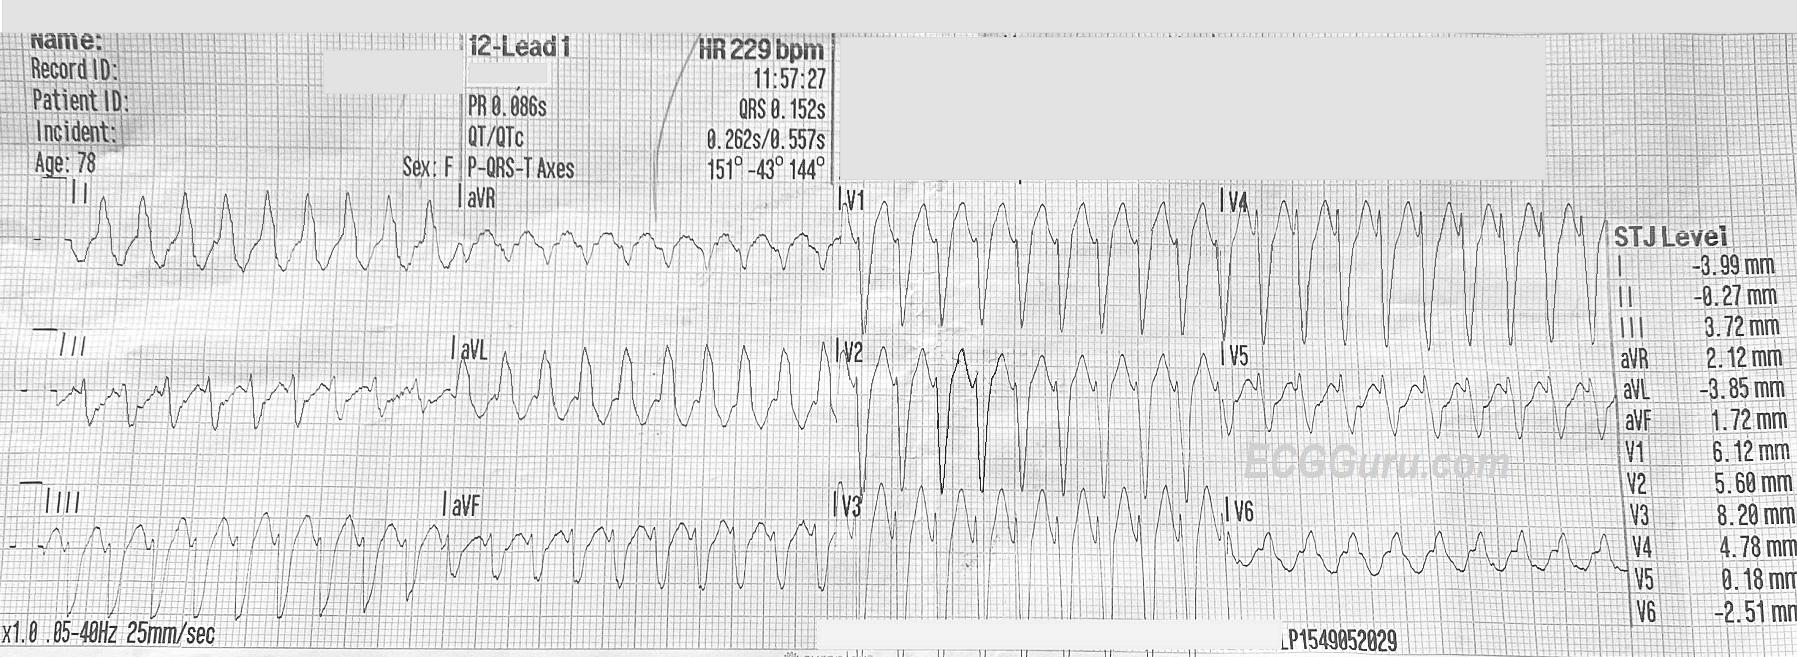
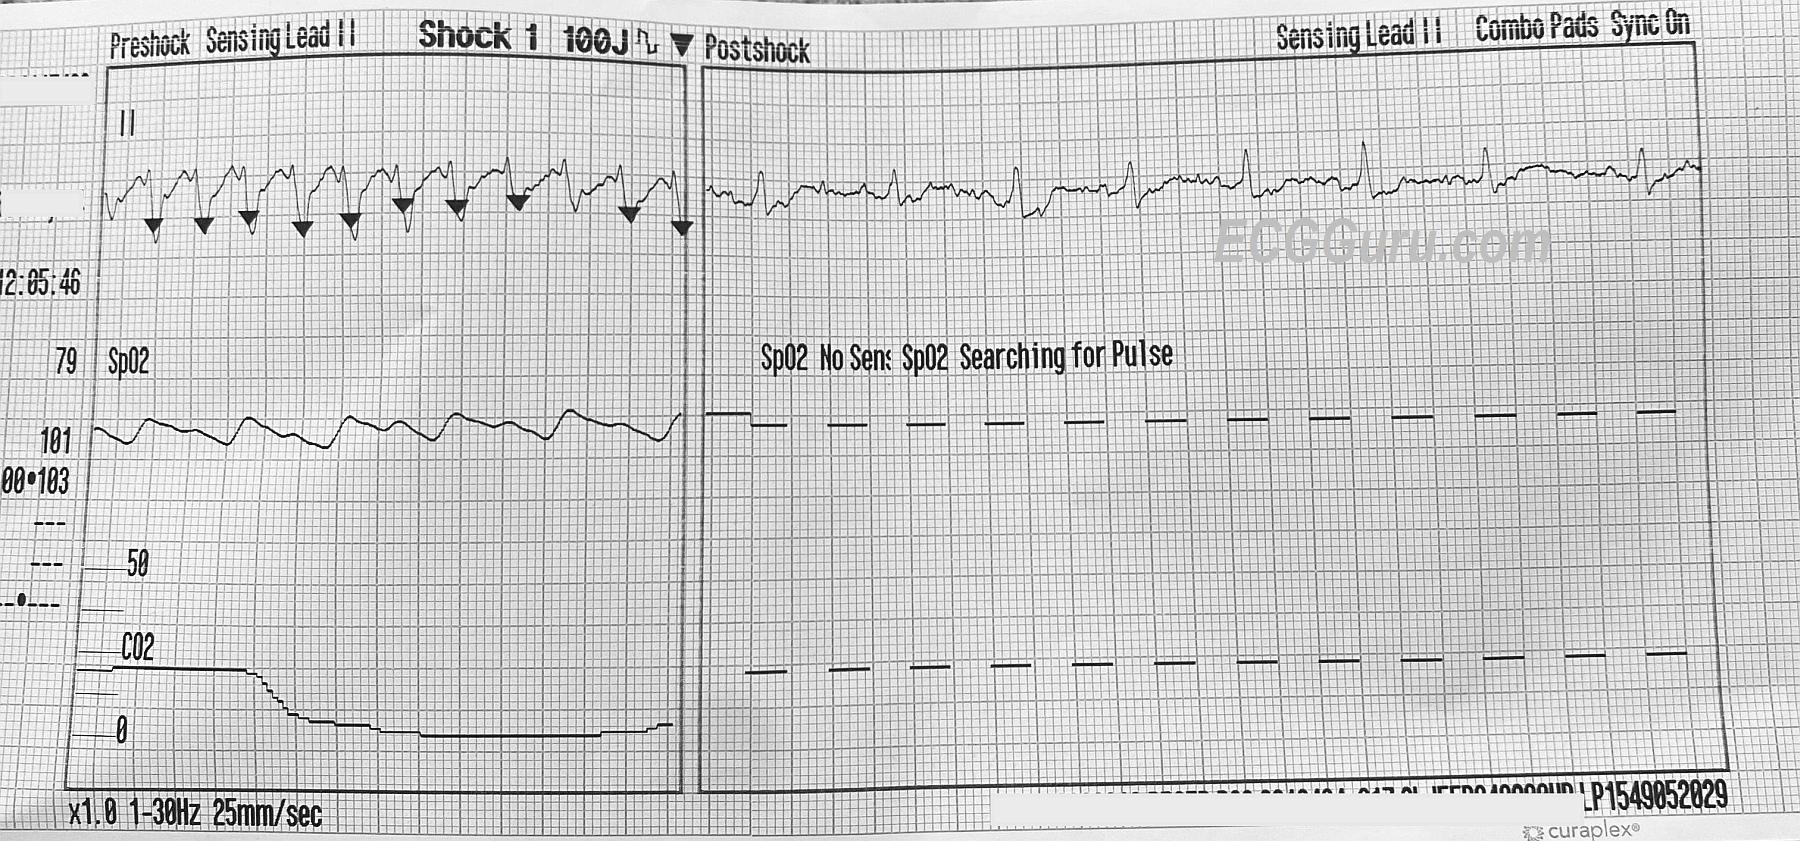
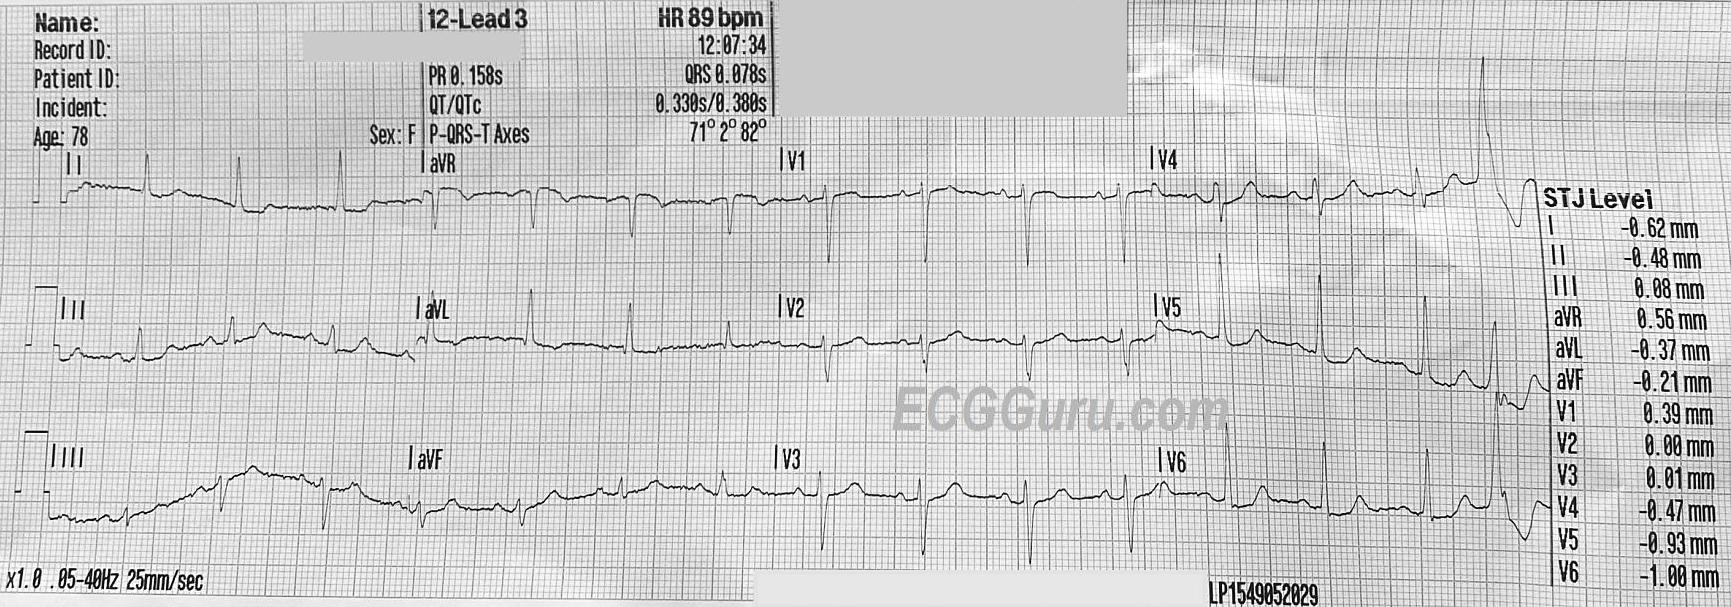
Wide Complex Tachycardia

The Patient:   A 78-year-old woman called emergency responders because she had palpitations. She was alert and oriented.  Her BP was reported as being “stable”.  We do not have information about her past medical history.  We will update this post if we receive information about her outcome. 

ECG Number 1, 11:57 a.m.:  There is a wide-complex tachycardia at a rate of about 230 bpm.  The QRS is .15 seconds (150 ms).  The QRS frontal plane axis is leftward. P waves are not readily seen, but the computer gives a P axis and PRI.  The PRI given is taken from Lead II, which, along with V5, does have P waves. In the other leads, the P waves are buried in preceding T waves.  This photo shows an ECG that is not lying flat, so it is difficult to line up the complexes.  Normally, it helps to look at the leads above or below to determine where waves begin and end, as all three channels are run simultaneously. The QRS complexes have a “typical” left bundle branch block morphology, with an rS complex in V1 and a monophasic R wave in Leads I and V6.  The T waves are “discordant”, they are in the opposite direction from the QRS complexes, which is typical of LBBB. 

ECG Number 2, 12:05 p.m.:   This is a rhythm strip recording a synchronized shock at 100 joules, resulting in conversion of the WCT to a narrow complex, irregular rhythm.  It appears that there is a P wave before every narrow QRS, but artifact prevents proper evaluation. 

Dr A Röschl's picture

Atrial Fibrillation With Rate-related Left Bundle Branch Block

For a better overview, the leads aVL and V2-V4 are not shown in this ECG. The basic rhythm is atrial fibrillation (no P waves or flutter waves visible, but fibrillation waves). When the conduction rate drops, the QRS complexes are narrow. Faster conduction results in wide QRS complexes with LBBB morphology. This is an example of phase 3 (acceleration dependant) LBBB.

Dr A Röschl's picture

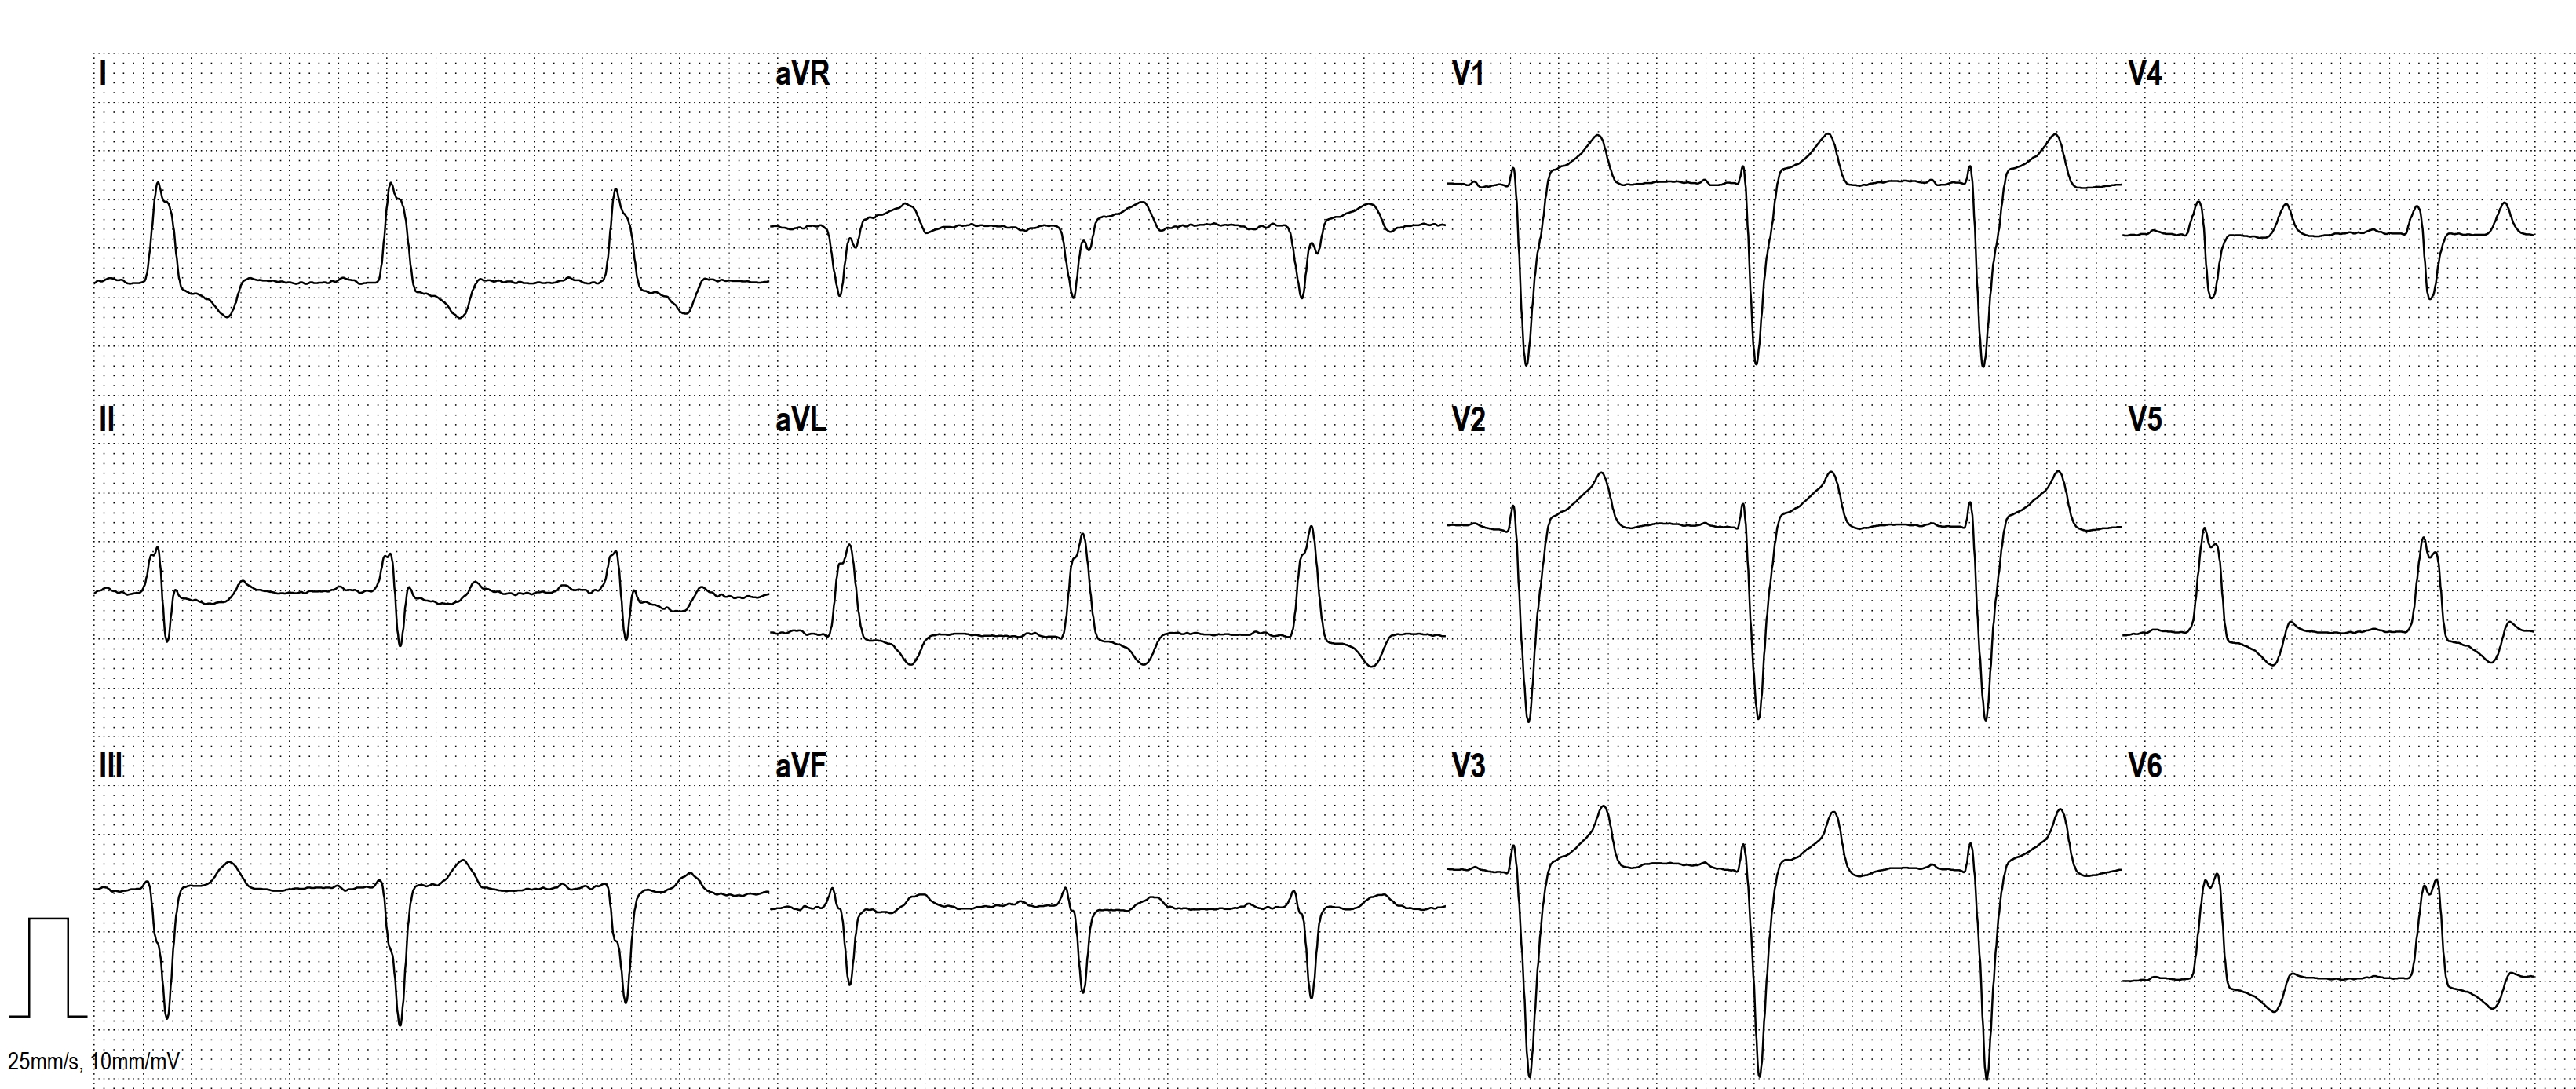
Left Bundle Branch Block

Why is this a left bundle branch block? We see a SR with broad QRS complexes (more than 120 ms). These are positive in the leftward leads I and aVL and in V5 and V6. In the more rightward leads III, aVR, and V1-V3, the QRS complexes are predominantly negative with deep S waves. This is a typical LBBB pattern.

Dr A Röschl's picture

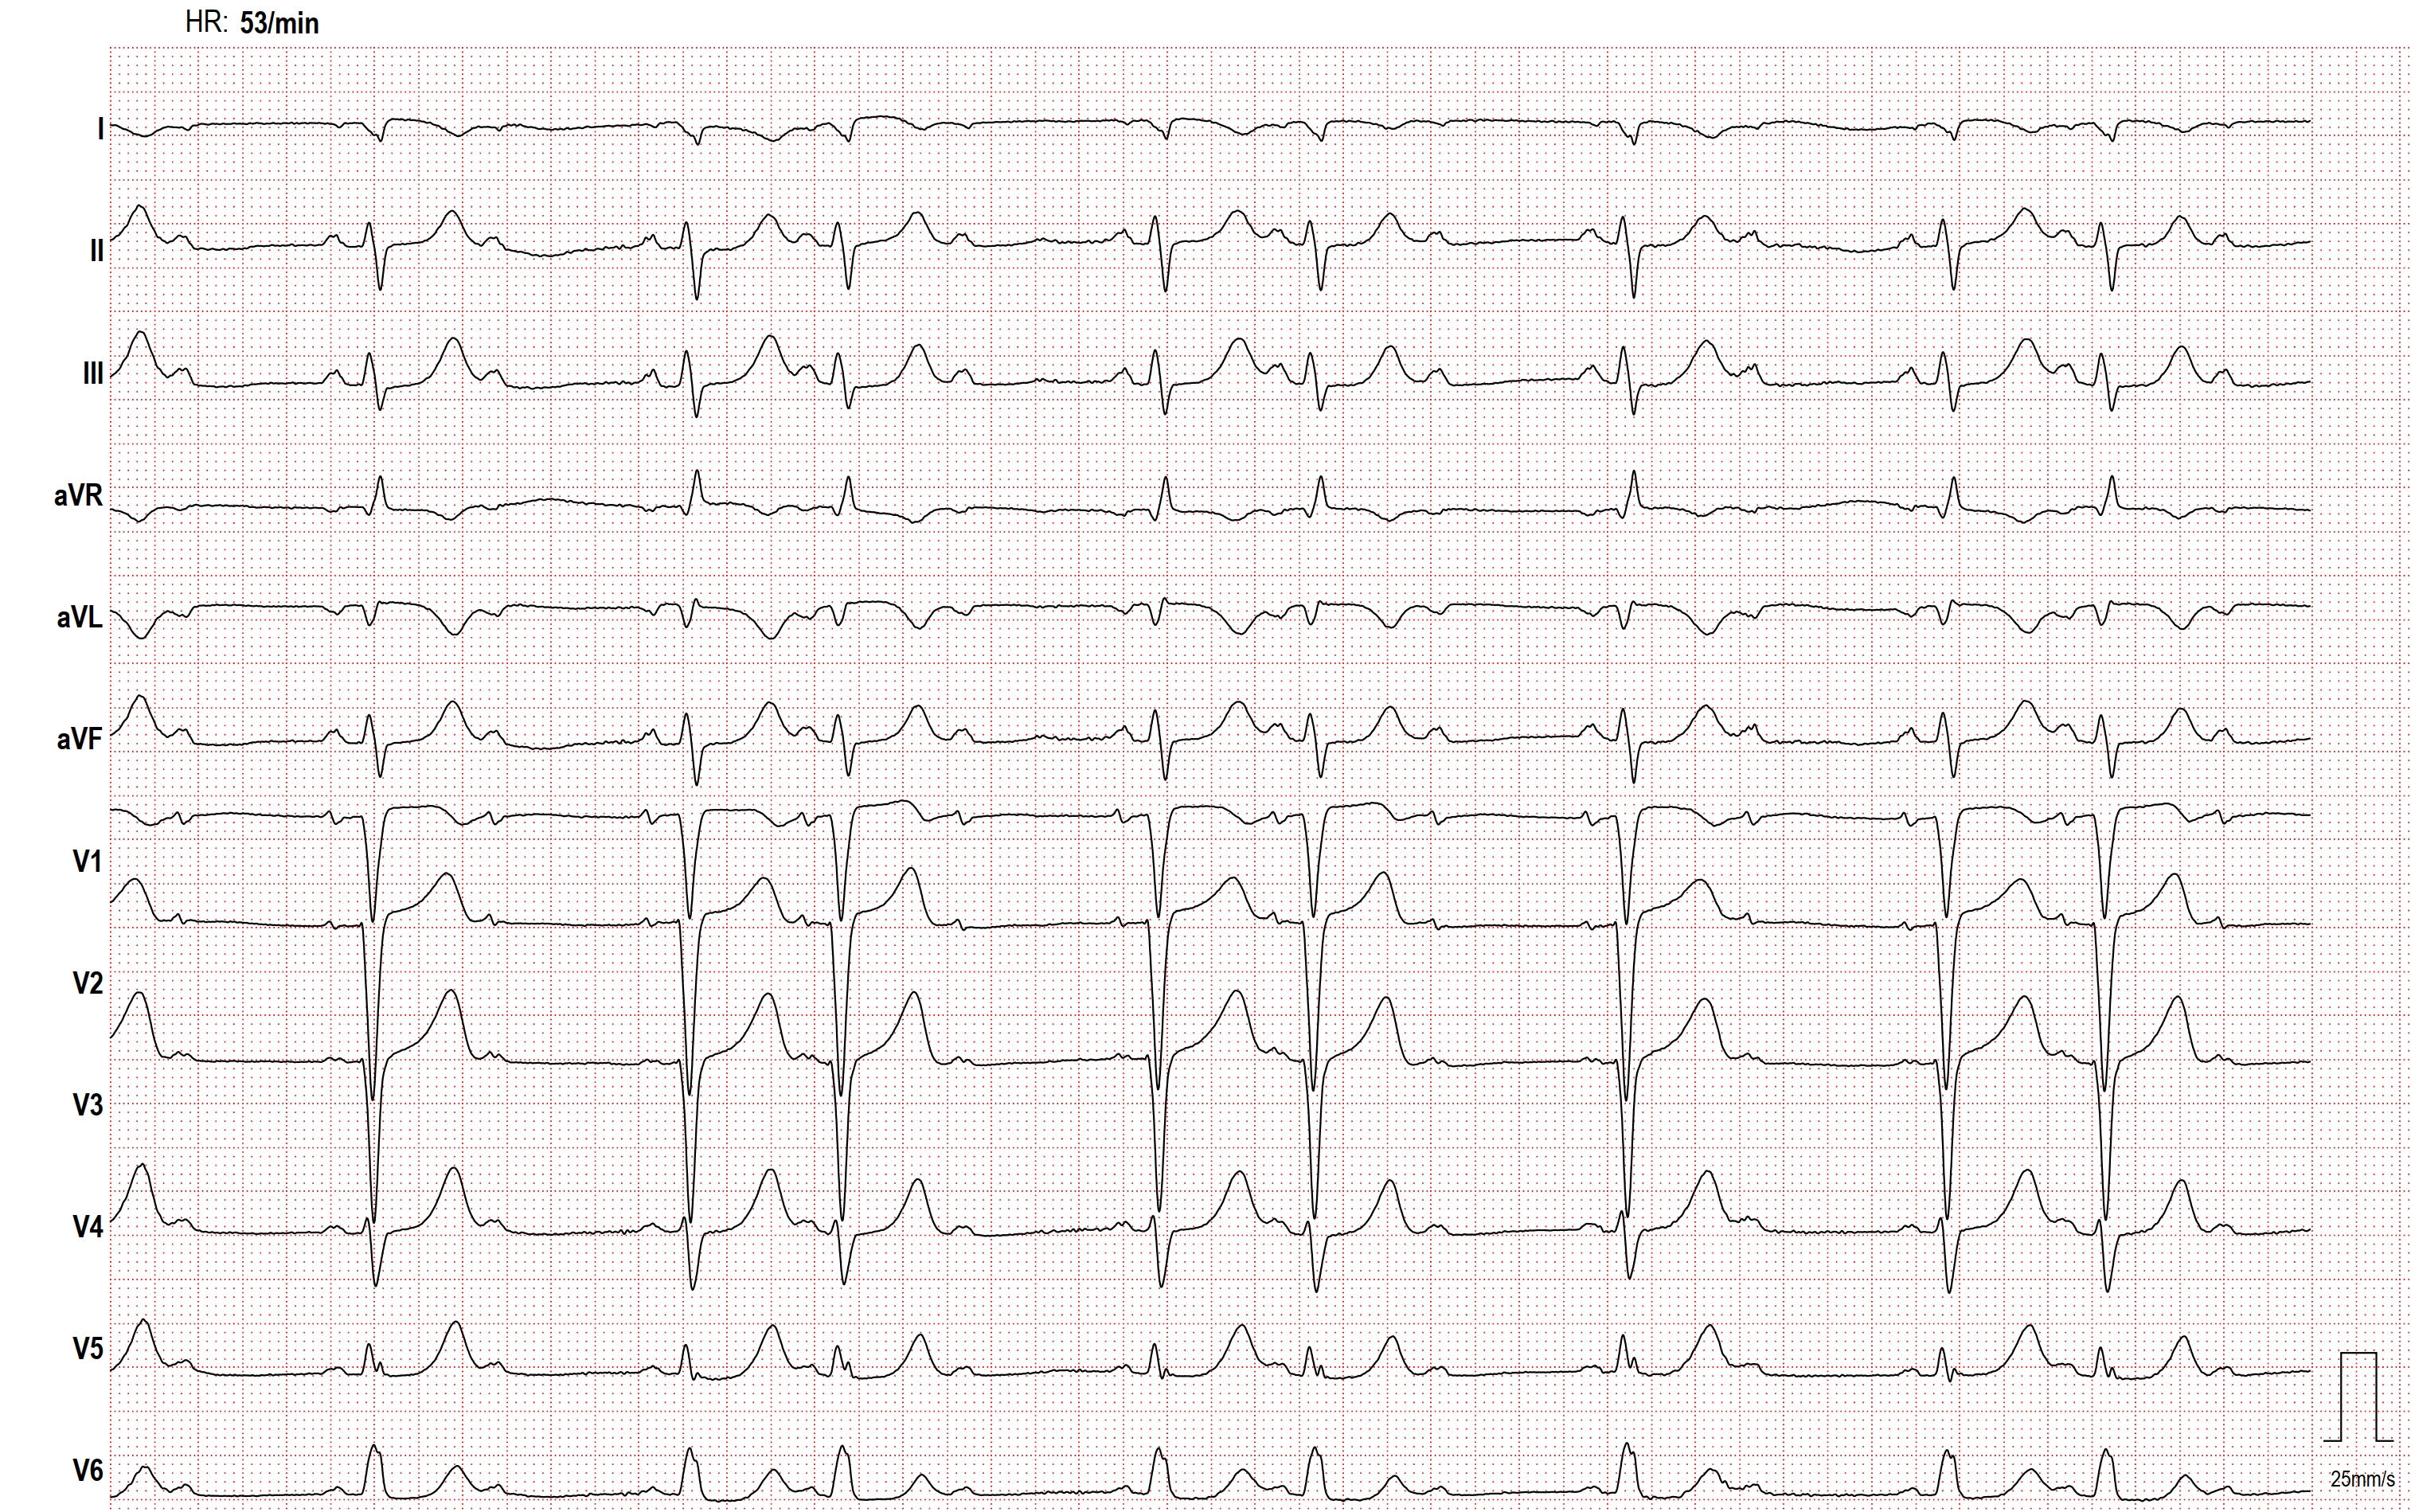
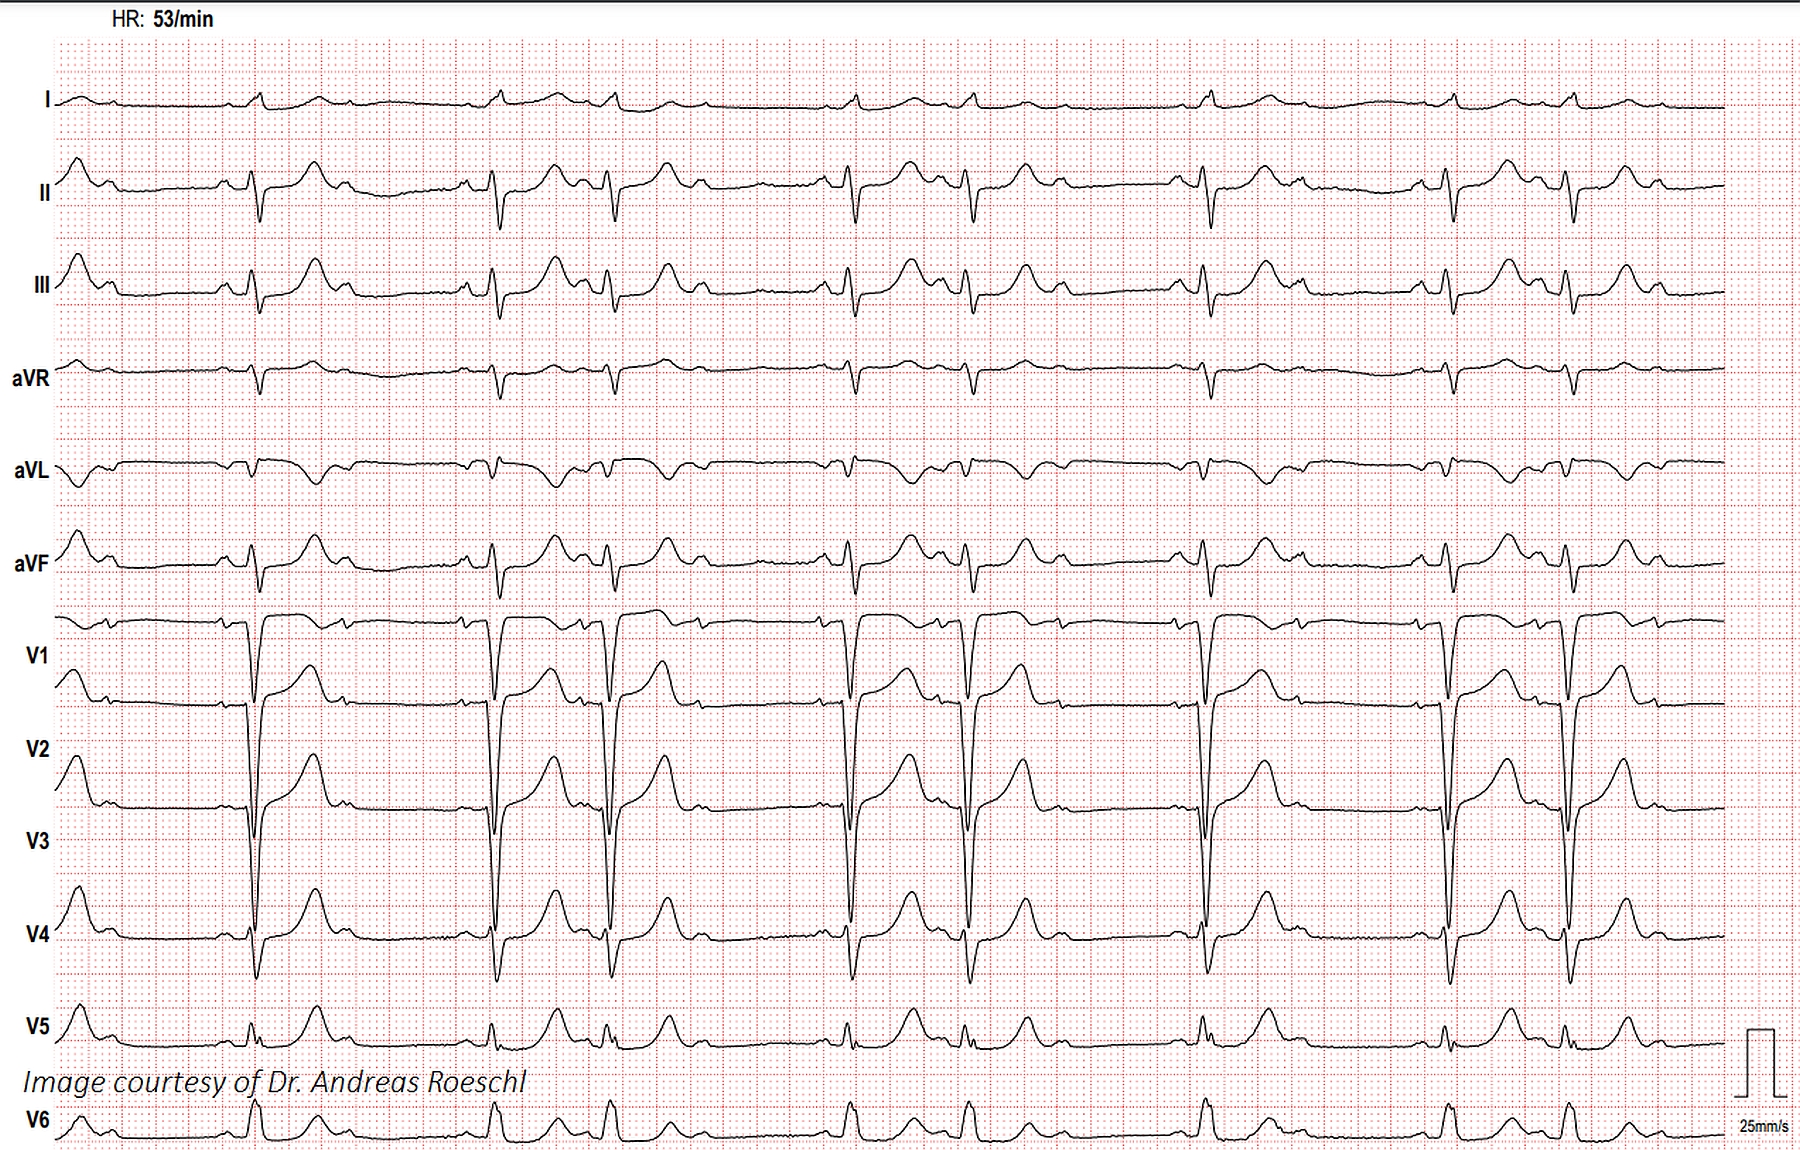
Second-degree AV Block with Left Bundle Branch Block & Lead Reversal

This ECG shows second-degree AV block, Mobitz Type II and an interventricular conduction delay, probably left bundle branch block. The QRS width is about 130 ms, or .13 seconds.

Dawn's picture

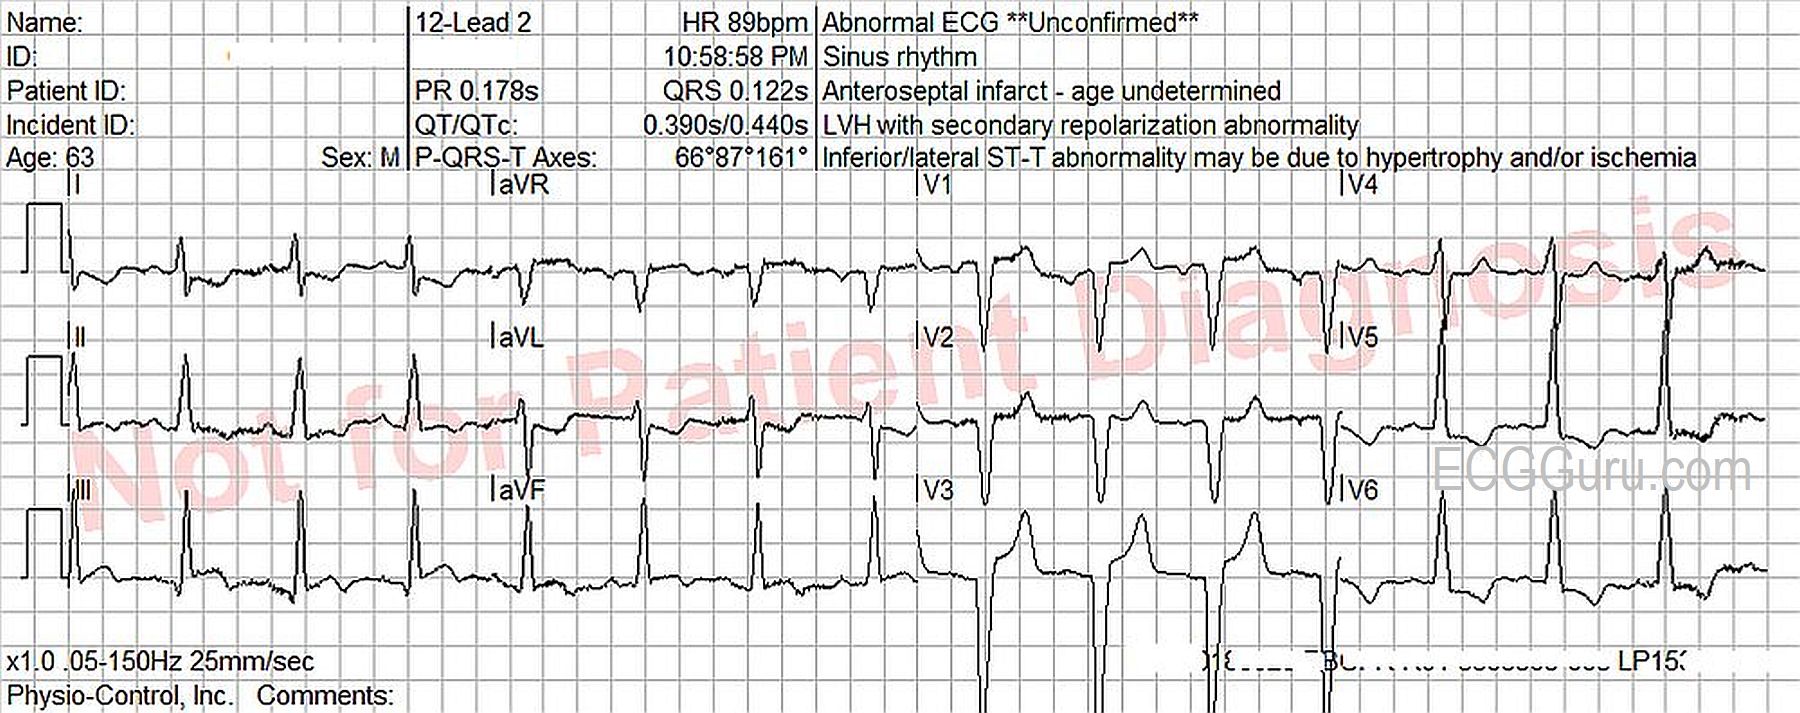
Inferior Wall M.I. In A Patient With Left Bundle Branch Block

The Patient:    A 64-year-old man complaining of chest pain and shortness of breath for 20 minutes.  Long-standing history of triple vessel disease, severe aortic stenosis, hypertension, thrombocytopenia.  Meds unknown.  He was not considered to be a candidate for valve surgery.


The ECG: There is normal sinus rhythm with a rate of 90 bpm.  P waves are not visualized well in all leads, so remember that the three channels of this ECG are run simultaneously.  If you see a P wave in Leads I and II, they are also present in Lead III.  The PR interval is WNL.


The QRS complexes are wide, at .122 seconds (122 ms).  The criteria for left bundle branch block are met. (Supraventricular rhythm, wide QRS, upright QRS in Leads I and V6, negative QRS in V1).  The frontal plane axis is within normal limits, but toward the right, at 87 degrees.  The QRS complexes transition at V4 from negative to positive, but Leads V1 – V3 have no initial r waves.  These are possibly pathological Q waves, likely from a past anterior-septal M.I.


Dawn's picture

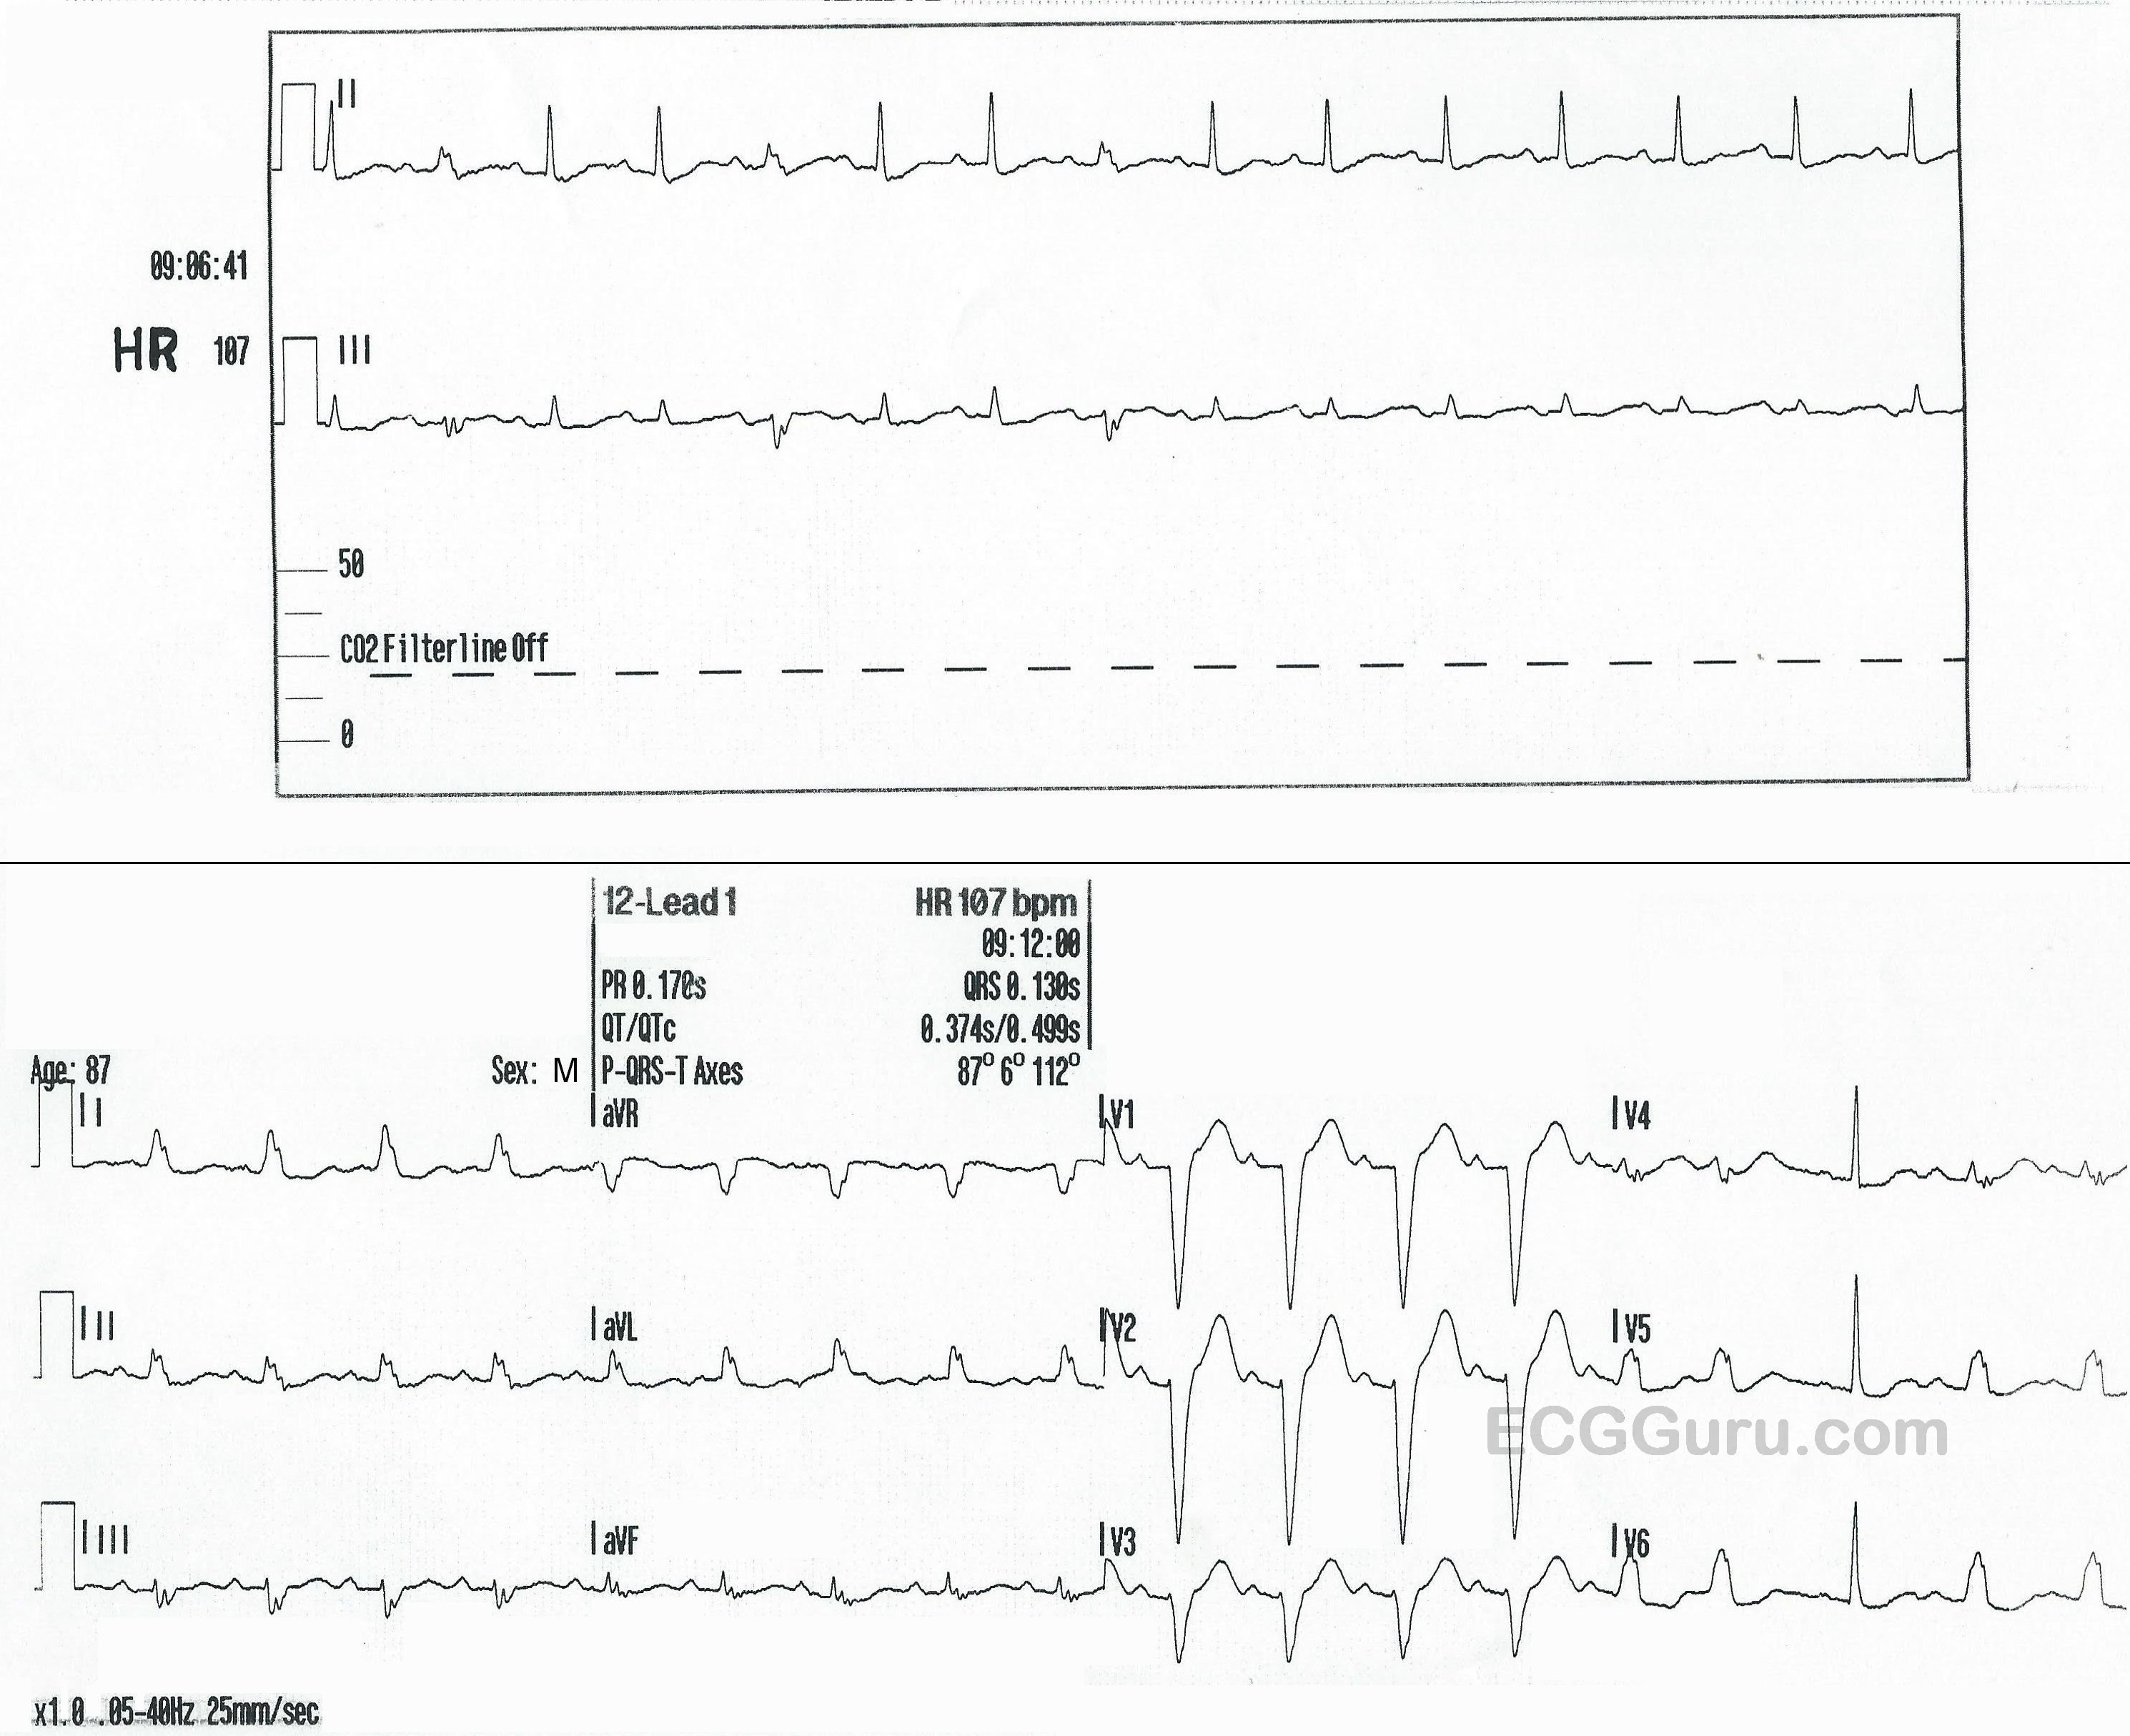
Rate-related Left Bundle Branch Block

The patient:  This ECG is from an 87-year-old man who was transported to the Emergency Department by paramedics. His chief complaint, as reported by caregivers, was lethargy, fever, and a declining mental status.  He appeared tired and slightly confused, and was normotensive.

The ECG:  There are a rhythm strip with two leads, II and III, and also a standard 12-lead ECG. The RHYTHM STRIP shows a tachycardiac rhythm that slows very slightly toward the end.  The rate is around 107 bpm, with an R to R interval of approximately 543 ms in the earlier, regular portion.  There are regular P waves present, all followed by QRS complexes.  Most of the QRS complexes are normal width, but the 2nd, 5th, and 8th are slightly wide at 130 ms, or .13 seconds.

These wider QRS complexes represent aberrant conduction with LBBB occurring intermittently.  Aberrant conduction often occurs due to a faster heart rate, but the only clue here is the intermittent conduction disturbance seems to disappear when the rate slows very slightly.  It is hard to determine mechanism of aberrant conduction when we have only a ten-second rhythm strip.

The 12-LEAD ECG  has essentially the same rate and rhythm, except all the beats in the first ¾ of the ECG are conducted aberrantly, in a LEFT BUNDLE BRANCH BLOCK pattern.  This indicates that the LBB is refractory at this time.  Beat No. 15 is premature (PAC).  The pause after the PAC allows the left bundle branch to repolarize, conducting one single beat normally.


Dawn's picture

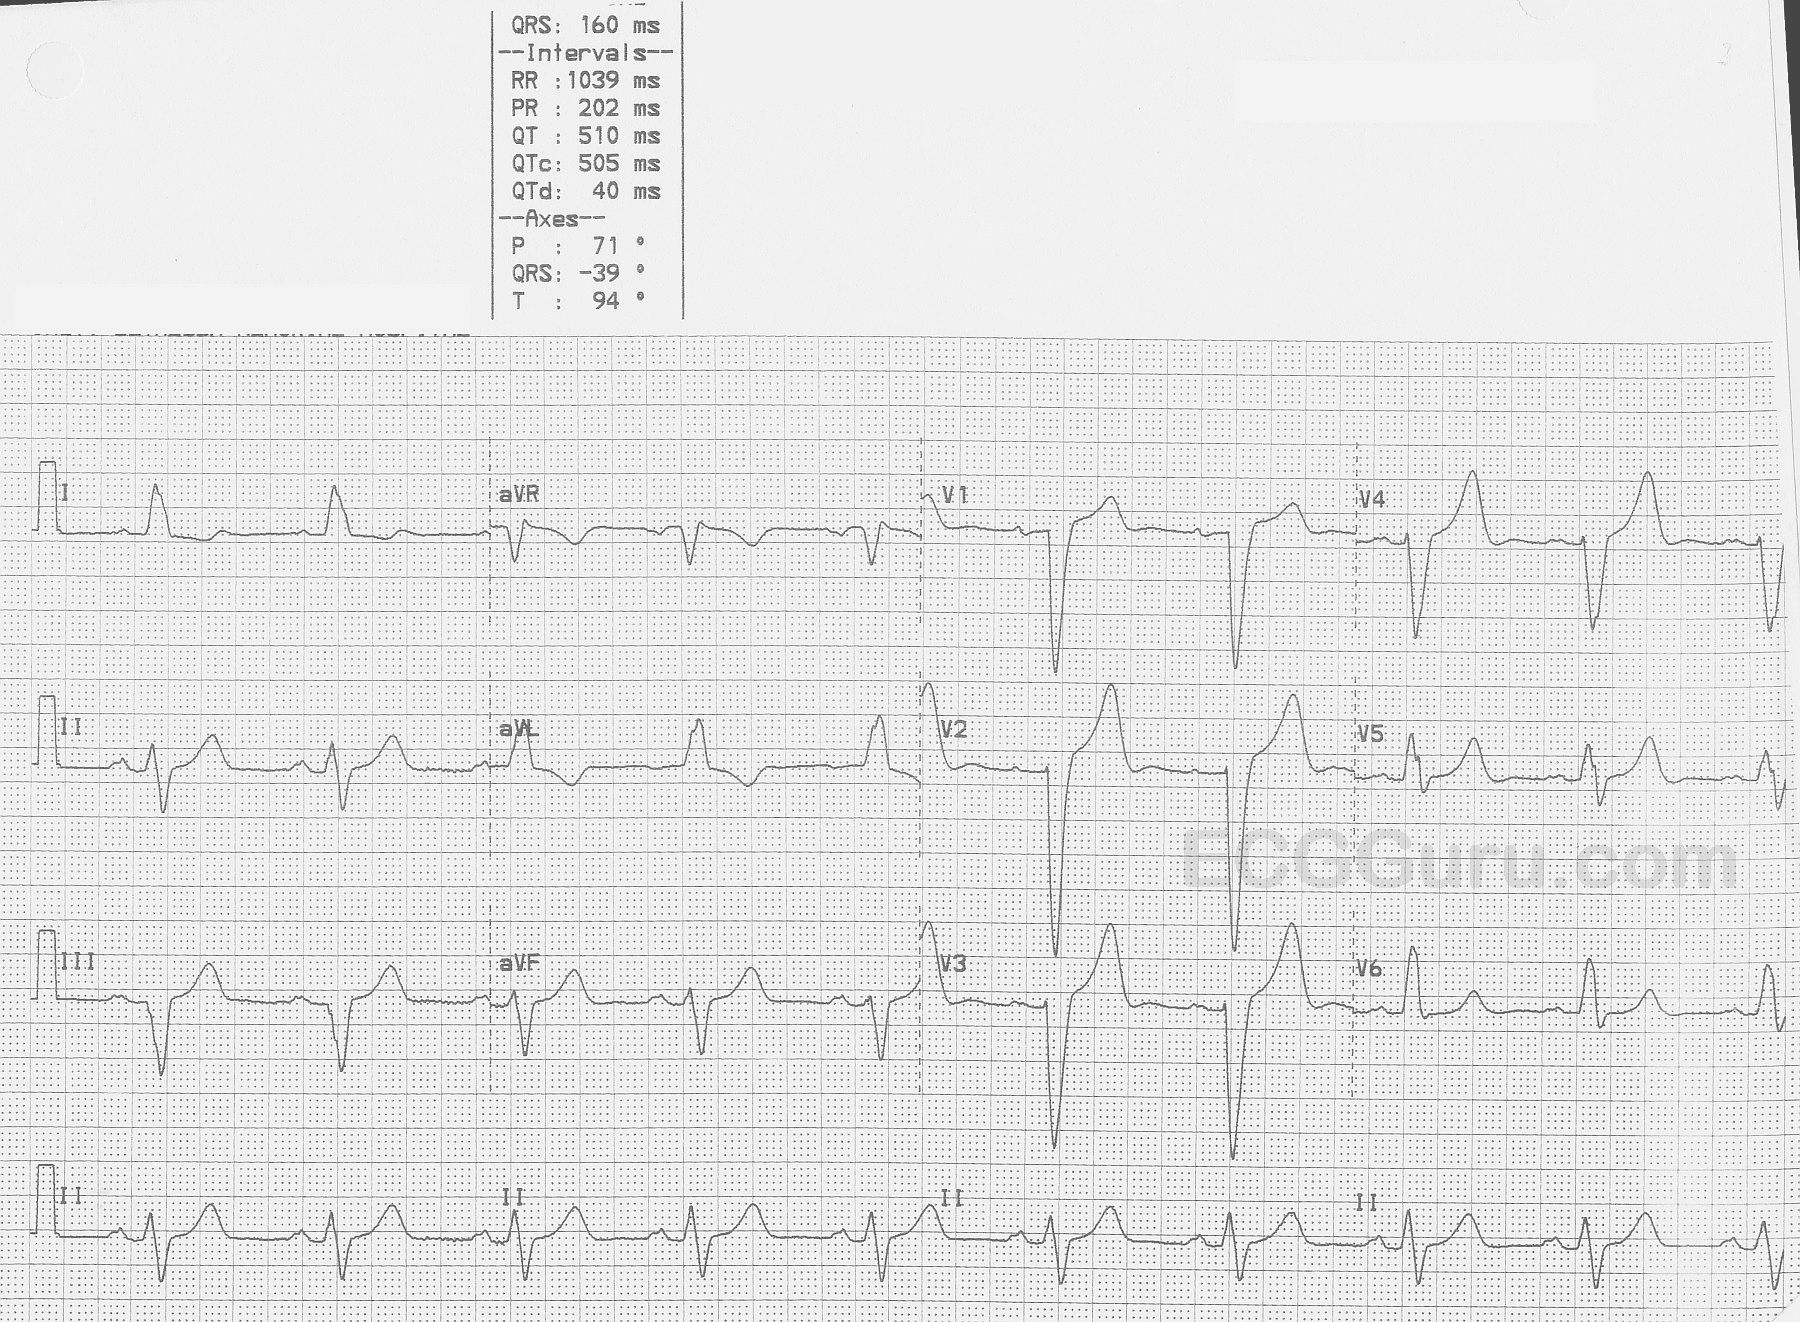
Left Bundle Branch Block

This ECG is taken from an elderly man with heart failure. 

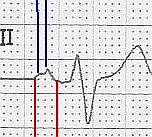
The ECG   The first feature that might capture your attention is the wider-than-normal QRS complex, which is 160 ms (.16 seconds).  The rate is 58 bpm. We do not know the patient’s medications or baseline rate.  There are P waves present, and so the rhythm is SINUS BRADYCARDIA. The P waves are broad , > 110 ms in Lead II (red lines in close up) and bifid, with greater than 40 ms between the two peaks in Lead II (blue lines).  In V1, the P waves are biphasic, with the terminal negative portion greater than 40 ms duration (red lines). This meets the ECG criteria for LEFT ATRIAL ENLARGEMENT, or preferably, LEFT ATRIAL ABNORMALITY. (https://LITFL.com/left-atrial-enlargement-ecg-library/) ECG criteria are not highly accurate for detecting atrial enlargement, and abnormal findings should be confirmed by anatomic measurement. (https://www.ncbi.nlm.nih.gov/pmc/articles/PMC2244611/).

The QRS complexes, as mentioned, are wide. Because there is sinus rhythm, we know the delay in conduction is due to interventricular conduction delay, and not to ventricular rhythm.  This ECG meets the criteria for LEFT BUNDLE BRANCH BLOCK. 

·        Supraventricular rhythm 

·        Wide QRS (>.12 seconds)

Pages

All our content is FREE & COPYRIGHT FREE for non-commercial use

Please be courteous and leave any watermark or author attribution on content you reproduce.