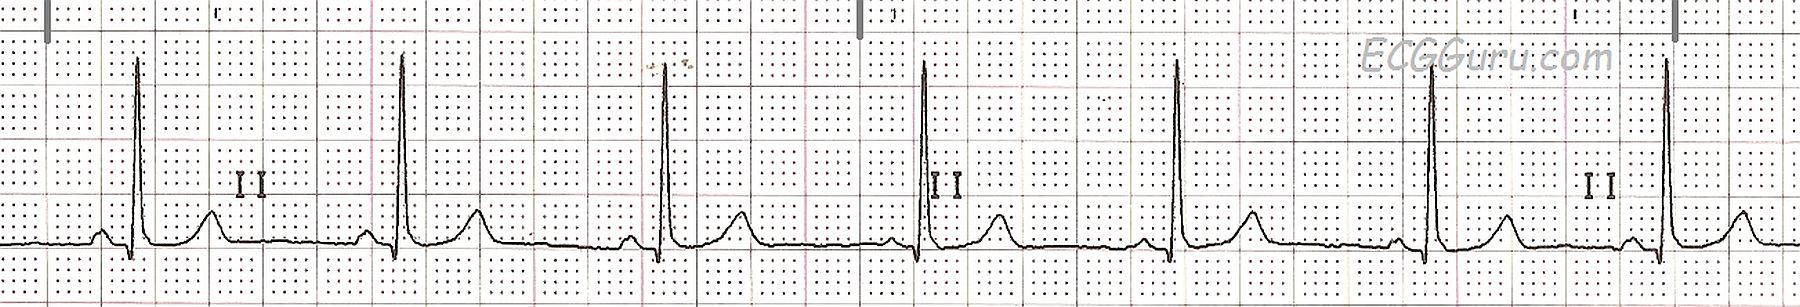
We try to remember to include some good old "Normal Sinus Rhythm" strips from time to time. Teachers often have large collections of strange and unusual strips that their colleagues have saved for them. But, then they find themselves resorting to electronic rhythm generators for samples of "normal". Here is a strip from a healthy, 23-year-old woman showing NSR. The rate is 65 bpm, QRS duration 76 ms, PRI 136 ms, QTc 410. There are no abnormal ST segments or T wave changes. There are very slight rate changes from beat to beat, and the P waves appear to change morphology a bit. This can be due to the patient's breathing movements, and we would not delve too deeply into this in light of the fact that this is an ECG from an asymptomatic young ECG student. Absolute precision would come from an generator, but rarely from a human being. This is a good strip to teach rate and interval determination.
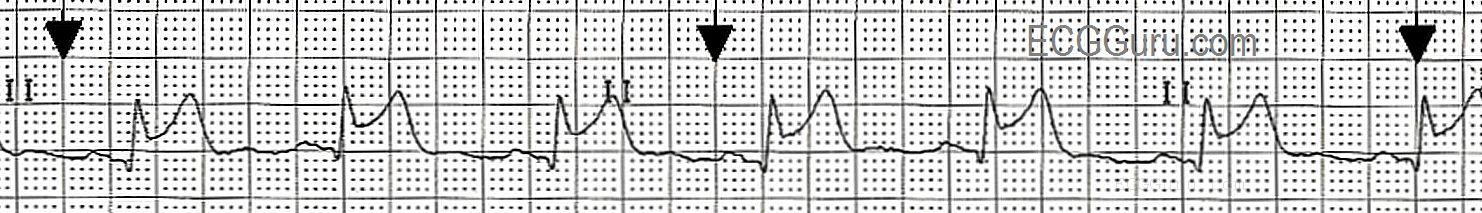
This Lead II rhythm strip was taken from a 12-Lead ECG performed on a 66-year-old man who was having an acute inferior wall M.I. The rhythm is normal sinus rhythm at 65 bpm. The QRS complex is slightly wide at 112 ms (.11 seconds). The patient did not have a bundle branch block pattern on his 12-lead ECG. The PR interval is .17 seconds, and the P waves are widened and have a "double peak". This can be a sign of left-sided heart failure, and is called P Mitrale. Your students should be advised not to try to diagnose acute M.I. from a monitor strip, as ST segments can be inaccurate on some types of monitors. However, any derangement of the ST segment on a monitor strip calls for an immediate 12-Lead ECG for confirmation.