Displaying 1 - 6 of 6
Dawn's picture

Wide Complex Tachycardia

This pair of ECGs feature one of our recurring themes:  wide-complex tachycardia (WCT). It is a fascinating topic, as tachycardia has many causes and many mechanisms, and wide QRS also has many causes, with the mechanism being slow conduction through the ventricles. 

Sometimes, it is not possible to diagnose the true origin of a WCT from one ECG, or even serial ECGs.  Is the tachycardia due to increased sympathetic activity (fear, dehydration, exercise, hypoxia, hypovolemia, etc.)?  Or is the fast rate due to reentry, where one impulse gets “caught” in a loop, repeating itself rapidly, and depolarizing the myocardium with each pass?  What is the location of the pacemaker that is responsible for the rhythm?  Is it a supraventricular rhythm that has suffered an intraventricular conduction delay, widening the QRS?  Or is the rhythm originating in a ventricular pacemaker, without the ability to travel on the fast highway that is the intraventricular conduction system? 

If you or your students work in an acute care setting, such as pre-hospital or emergency department, you may not be with the patient long enough or be able to conduct enough tests to determine without a doubt the answers to the above questions.  Some WCTs cause such severe symptoms that they must be dealt with quickly, to avoid rapid deterioration to ventricular fibrillation.  For that reason, there is a widely-accepted rule for WTC treatment:

TREAT ALL WIDE-COMPLEX TACHYCARDIA AS IF IT IS V TACH UNTIL PROVEN OTHERWISE.    

Dawn's picture

Anterior-lateral M.I. With Wide QRS

The Patient:  An elderly man presents with chest pain, pallor, diaphoresis and weakness.

The ECG:     The rhythm is normal sinus at a rate of about 76 bpm with normal intervals. The QRS complexes are wide at about .14 seconds (140 ms).  There is ST segment elevation in all precordial leads, except for possibly V6.  The shape of the ST segments in the anterior wall range from coved upward in a “frowning” shape (V1) to very straight (V5 and V6).  There is also ST elevation in aVL with ST straightening in Lead I.  There is ST depression in the inferior leads, II, III, and aVF.  Lead II is equally biphasic while I and aVL are positive, indicating an axis that is shifted slightly to the left.  With his symptoms and this alarming ECG, he was sent promptly to the cath lab.

Interpretation:  The rather obvious ST-elevation M.I. is extensive, covering the entire anterior wall, and extending into the high and low lateral walls . This was confirmed in the cath lab, as the patient had an occlusion of the left anterior descending artery near the bifurcation of the circumflex.  The wide QRS meets the criteria for left bundle branch block (wide QRS, negative QRS in V1 and positive QRS in V6 and Lead I).  However, it doesn’t have the “look” of LBBB with the low-voltage seen in the anterior wall. After the offending artery was opened and stented, the wide complex became narrow and was considered to be an interventricular conduction delay that was due to the ischemia.  The ST depression in the inferior wall is most likely reciprocal.

Dawn's picture

Syncope and tachycardia

The patient:  This ECG is taken from a 55-year-old man whose wife called 911 because he had a syncopal episode.  When the paramedics arrived, he was conscious and alert, and denied any symptoms.  He gave a history of "cardiac", diabetes, and opiate abuse.  We do not know the nature of his cardiac history or his medications.  

It is difficult to pinpoint a definite diagnosis with this lack of information and a clearly abnormal ECG.  We will limit our discussion to listing the abnormalities seen:

The ECG rhythm:  There is a fast, regular rhythm that is supraventricular in origin (there are P waves).  When a supraventricular rhythm has a rate of about 150 per minute, we should ALWAYS consider ATRIAL FLUTTER WITH 2:1 CONDUCTION.  Atrial flutter produces P waves (flutter waves) at approximately 250-350 per minute.  The normal AV node is able to conduct half of these, at a rate of about 150 per minute. Atrial flutter with 2:1 conduction is the most common presentation of new-onset atrial flutter.  It is often missed by people who expect to see several flutter waves in a row, producing the "sawtooth pattern".  That being said, atrial flutter is usually discernable in at least a few leads if it is present.  We do not see any signs of flutter waves in this ECG.

That leaves us with a differential diagnosis of sinus tachycardia vs. one of the regular supraventricular tachycardias like reentrant tachycardias or atrial tachycardia.  Sinus tachycardia can be recognized by several features. If we are fortunate enough to witness the onset or offset of the fast rhythm, will will recognize sinus tachycardia by a "warm up" or gradual speeding up of the rate, and a "cool down", or gradual slowing.  On the other hand, SVTs often have abrupt onset and offset.  Sinus tachycardia often has a very obvious cause, such as hypovolemia, fever, pain, anxiety, vigorous exercise, or hypoxia.  Sinus tachycardia usually has a distinct, upright P wave in Lead II, and a clearly-seen, often negative, P wave in Lead V1.  This ECG does not show the onset of the tachycardia, and is not long enough to evaluate for rate changes. Lead II appears to have upright P waves on the downslope of the previous T waves. V1 has deeply negative P waves, and V4 has the most clearly-seen P waves.  Without being positive, this looks more like sinus tachycardia than a reentrant tachycardia.  It would help to know more about the patient's condition.

Dawn's picture

ECG Challenge: Wide-complex Rhythm

This ECG Challenge is taken from a 95-year-old man.  We do not know his clinical information, except that he called 911 for assistance.  We also do not have information on his past medical history.  The QRS complexes are wide, and there are P waves present.  What do you think the etiology of this rhythm is?

Feb. 22, 2017 UPDATE:  The wide complexes in this ECG indicate an intraventricular conduction defect.  The most likely IVCD at this man's age is left bundle branch block.  However, the morphology of the QRS complexes in V5 and V6 are NOT typical of LBBB.  Usually, there is very little or no S wave in those leads.  We cannot confirm that lead placement is correct, and failing to place the left sided electrodes (V4 through V6) correctly can affect the transition of the R waves in the precordial leads.  It would be SO helpful to know more about this patient, of course, but a lot is possible by age 95.

For a more in-depth look at this ECG, please refer to the Comments below.

Dawn's picture

Hyperkalemia in a DKA Patient

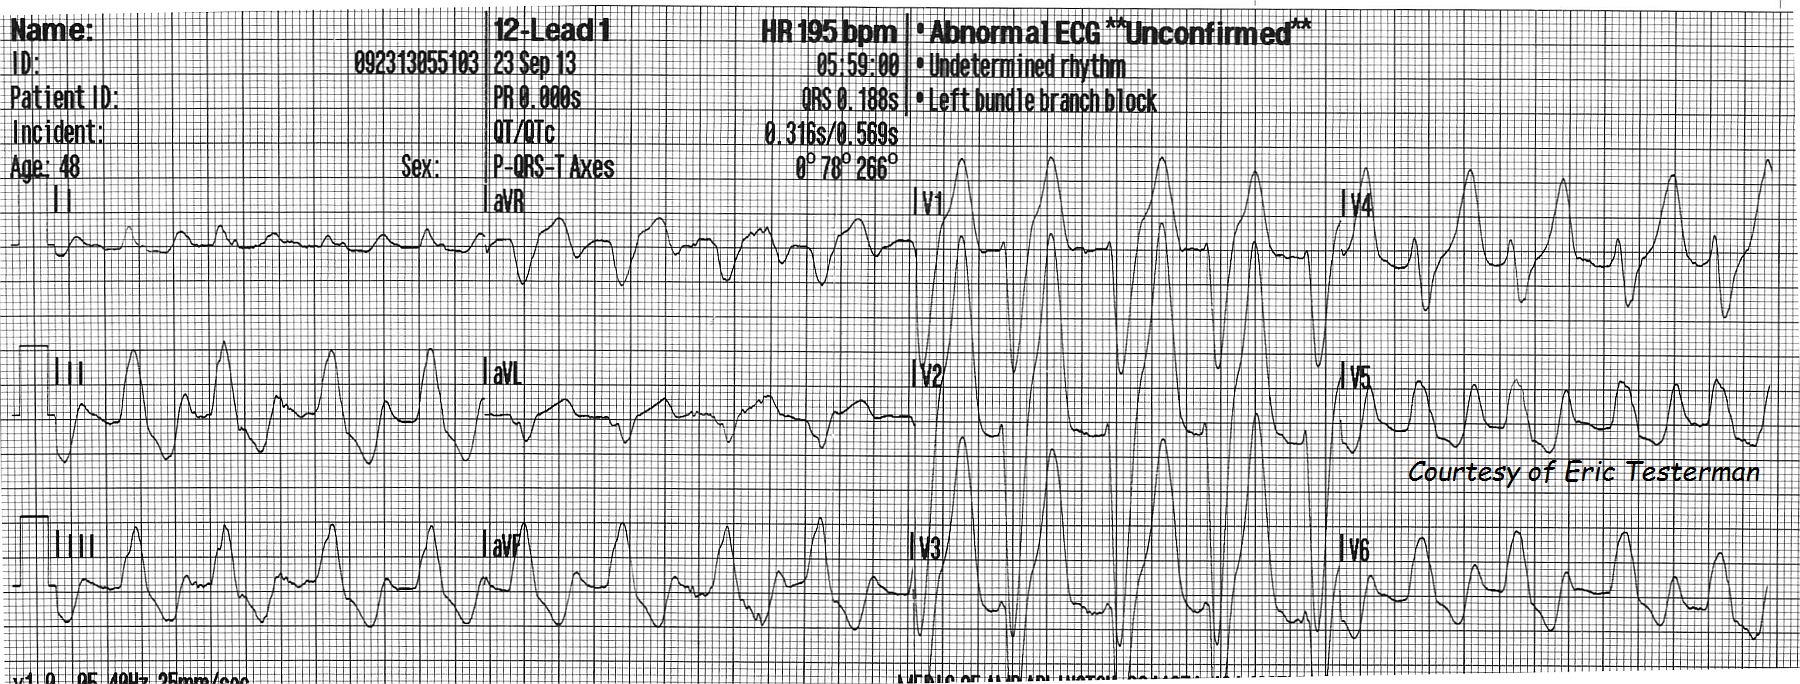
For your collection, we present another interesting set of ECGs from Paramedic Erik Testerman.  They are from a 48 year old man who presented responsive only to painful stimuli, with deep, rapid (Kussmaul's) respirations.  His blood glucose in the field read as "HIGH" - too high for the glucometer to register a number.  He was treated with 3 large-bore IVs, 2 liters of NSS IV, O2.  At the hospital, his blood glucose again registered as "HIGH" on the glucometer, arterial O2 was 90%, CO2 15 (low), pH 6.8 (acidotic), HCO3 -2 (depleted).  His serum potassium was 7.0 ( greater than 5.5 is high ).  We do not have the rest of his chemistry panel.

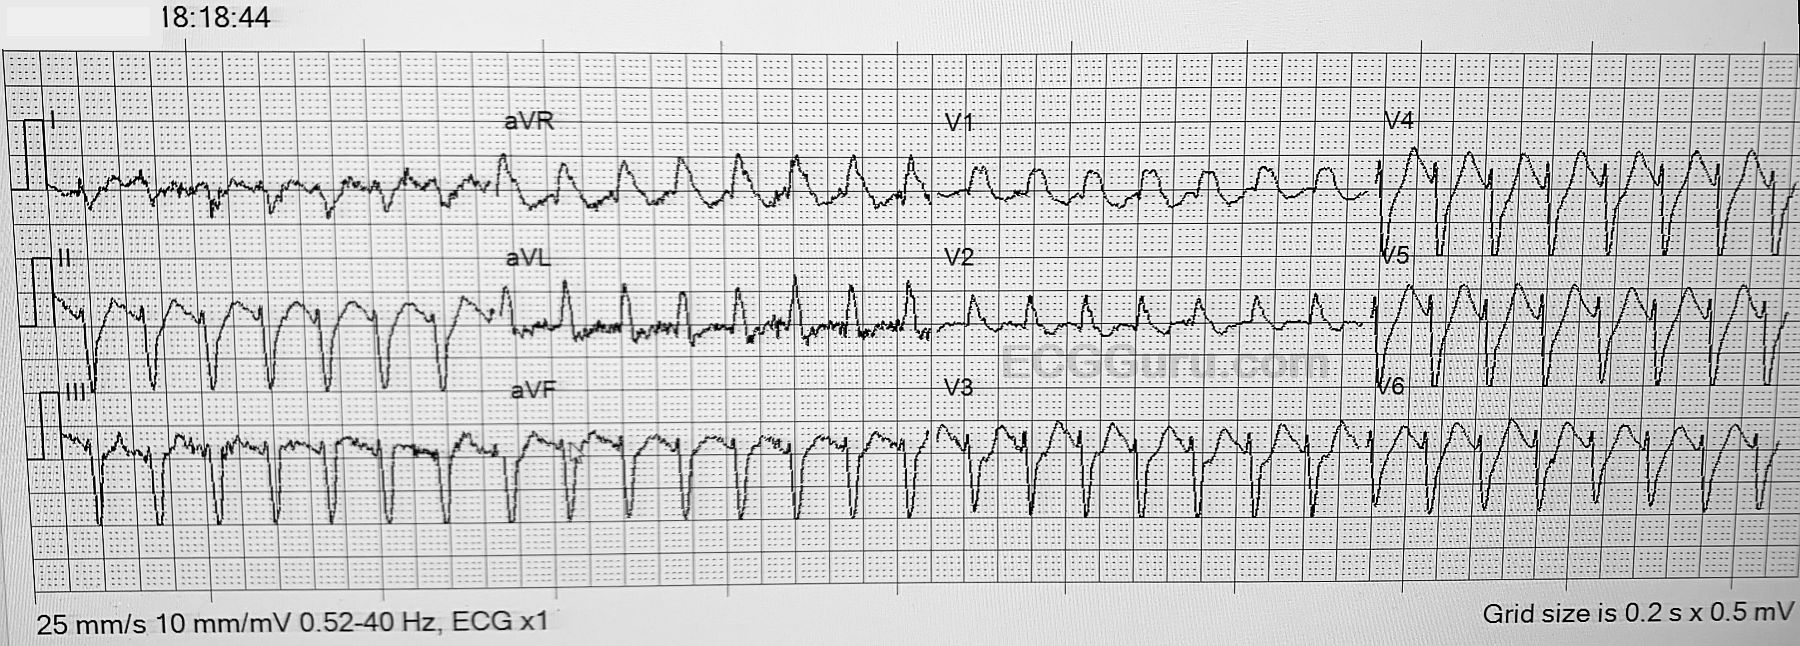
The first ECG, at 5:59 am, shows some signs of early hyperkalemia.  One of these signs is wide QRS, at .188 sec (normal is less than .12).  This ECG even meets the criteria for LBBB, as noted in the machine's interpretation, but the widening is more likely due to the high potassium.  There is a right axis deviation.  Left axis deviation is more likely in LBBB. LBBB pattern with right axis deviation can be a sign of biventricular enlargement, but, again, this may be an intraventricular conduction delay that is NOT LBBB.  Another sign of hyperkalemia is that P waves are not evident.  They can either be flattened until they disappear, or the PR interval can become so long the P wave is lost in the preceding T wave.  The T waves are unusually tall and peaked in the chest leads - disproportionate to the wide QRS complexes.  There are ST depressions in the inferior leads.

For a good, systematic approach to the ECG changes associated with hyperkalemia, we recommend Life In The Fast Lane, by Ed Burns.

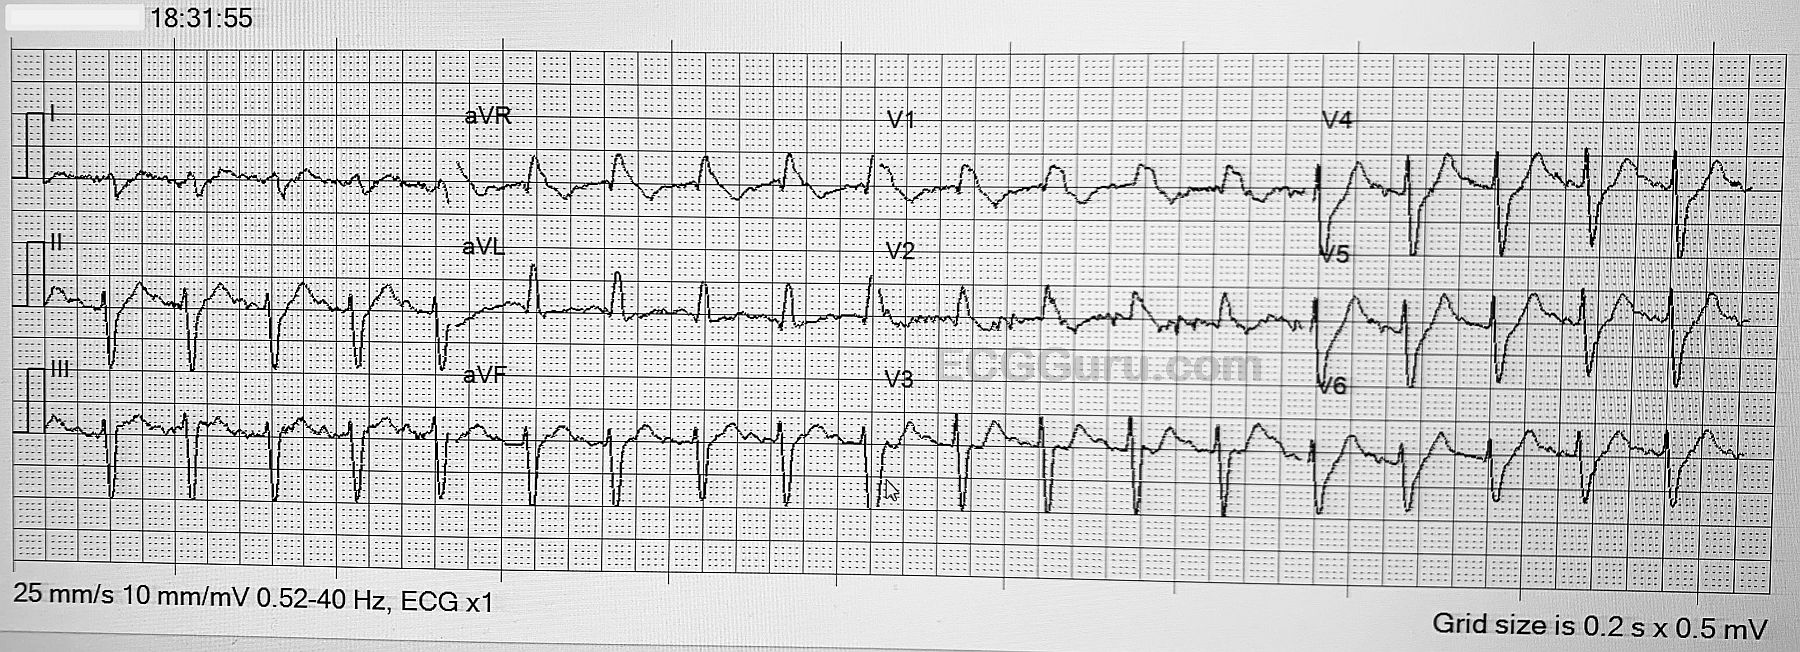
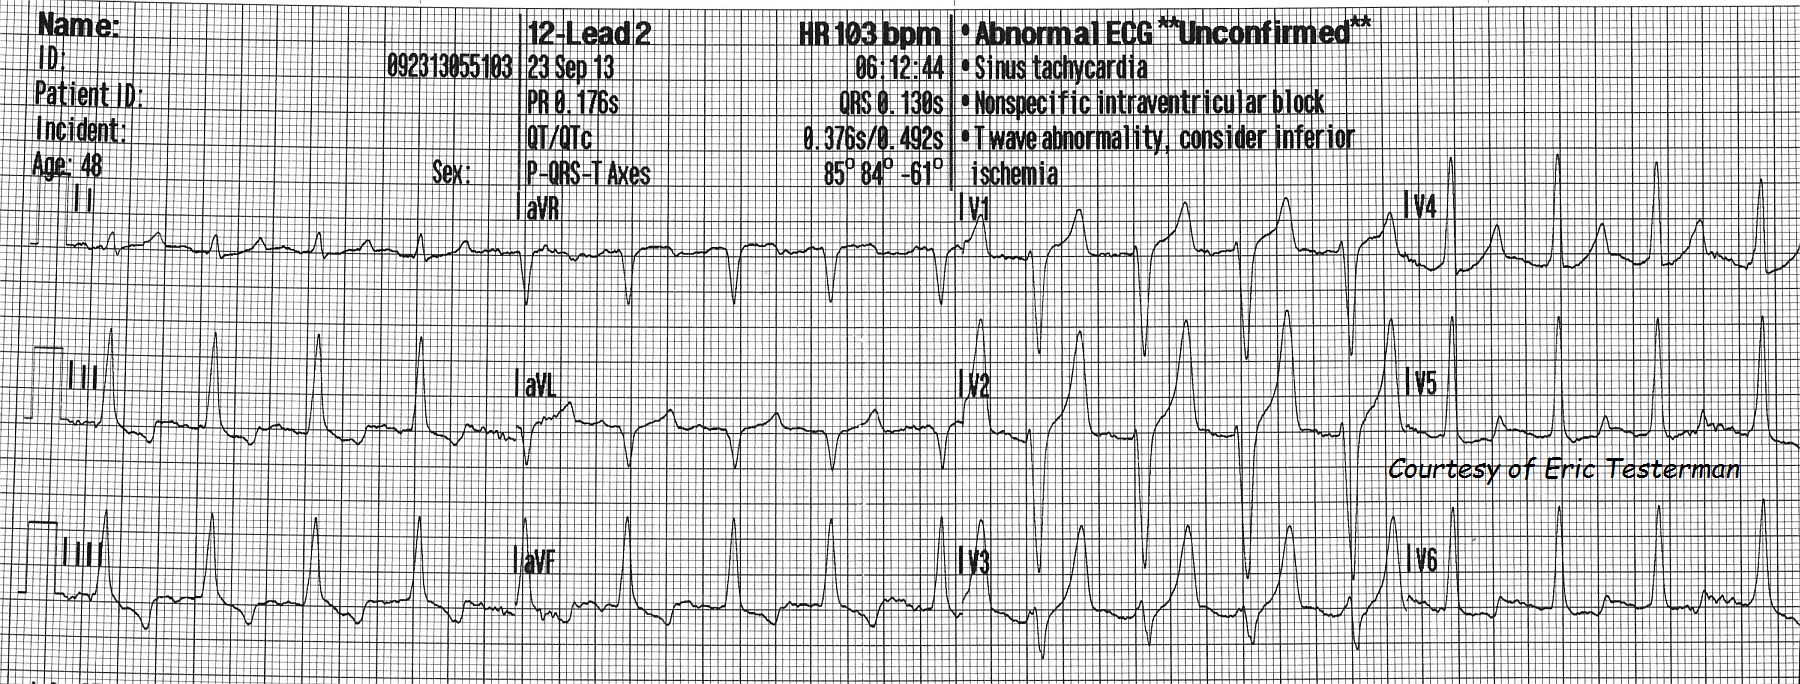
ECG number 2 was taken 13 minutes later, still in the pre-hospital phase.  The QRS is now .13 seconds, and the tall, narrow, peaked T waves are very evident in Leads V1 through V3.  There is  T wave inversion and ST depression in the inferior leads.  These are all possible signs of hyperkalemia, but also of other conditions.  Unfortunately, hyperkalemia is a "mimic" of many conditions on the ECG.  For a very interesting discussion of this topic, please go to Dr. Amal Mattu's ECG Discussion of the Week, October 14, 2013.   

Dawn's picture

Wide Complex Bradycardia in Digitalis Toxic Patient

This ECG is from a female patient who presented with weakness. Her labs revealed digitalis toxicity and hyperkalemia. Actual lab values not available. With digitalis toxicity, hypokalemia and hyperkalemia are possible. In severe hyperkalemia, the "tall peaked T waves" can become much shorter, as the QRS and T waves widen. The p waves disappear, and soon the ECG resembles a "sine" wave. This is a very serious emergency!


All our content is FREE & COPYRIGHT FREE for non-commercial use

Please be courteous and leave any watermark or author attribution on content you reproduce.