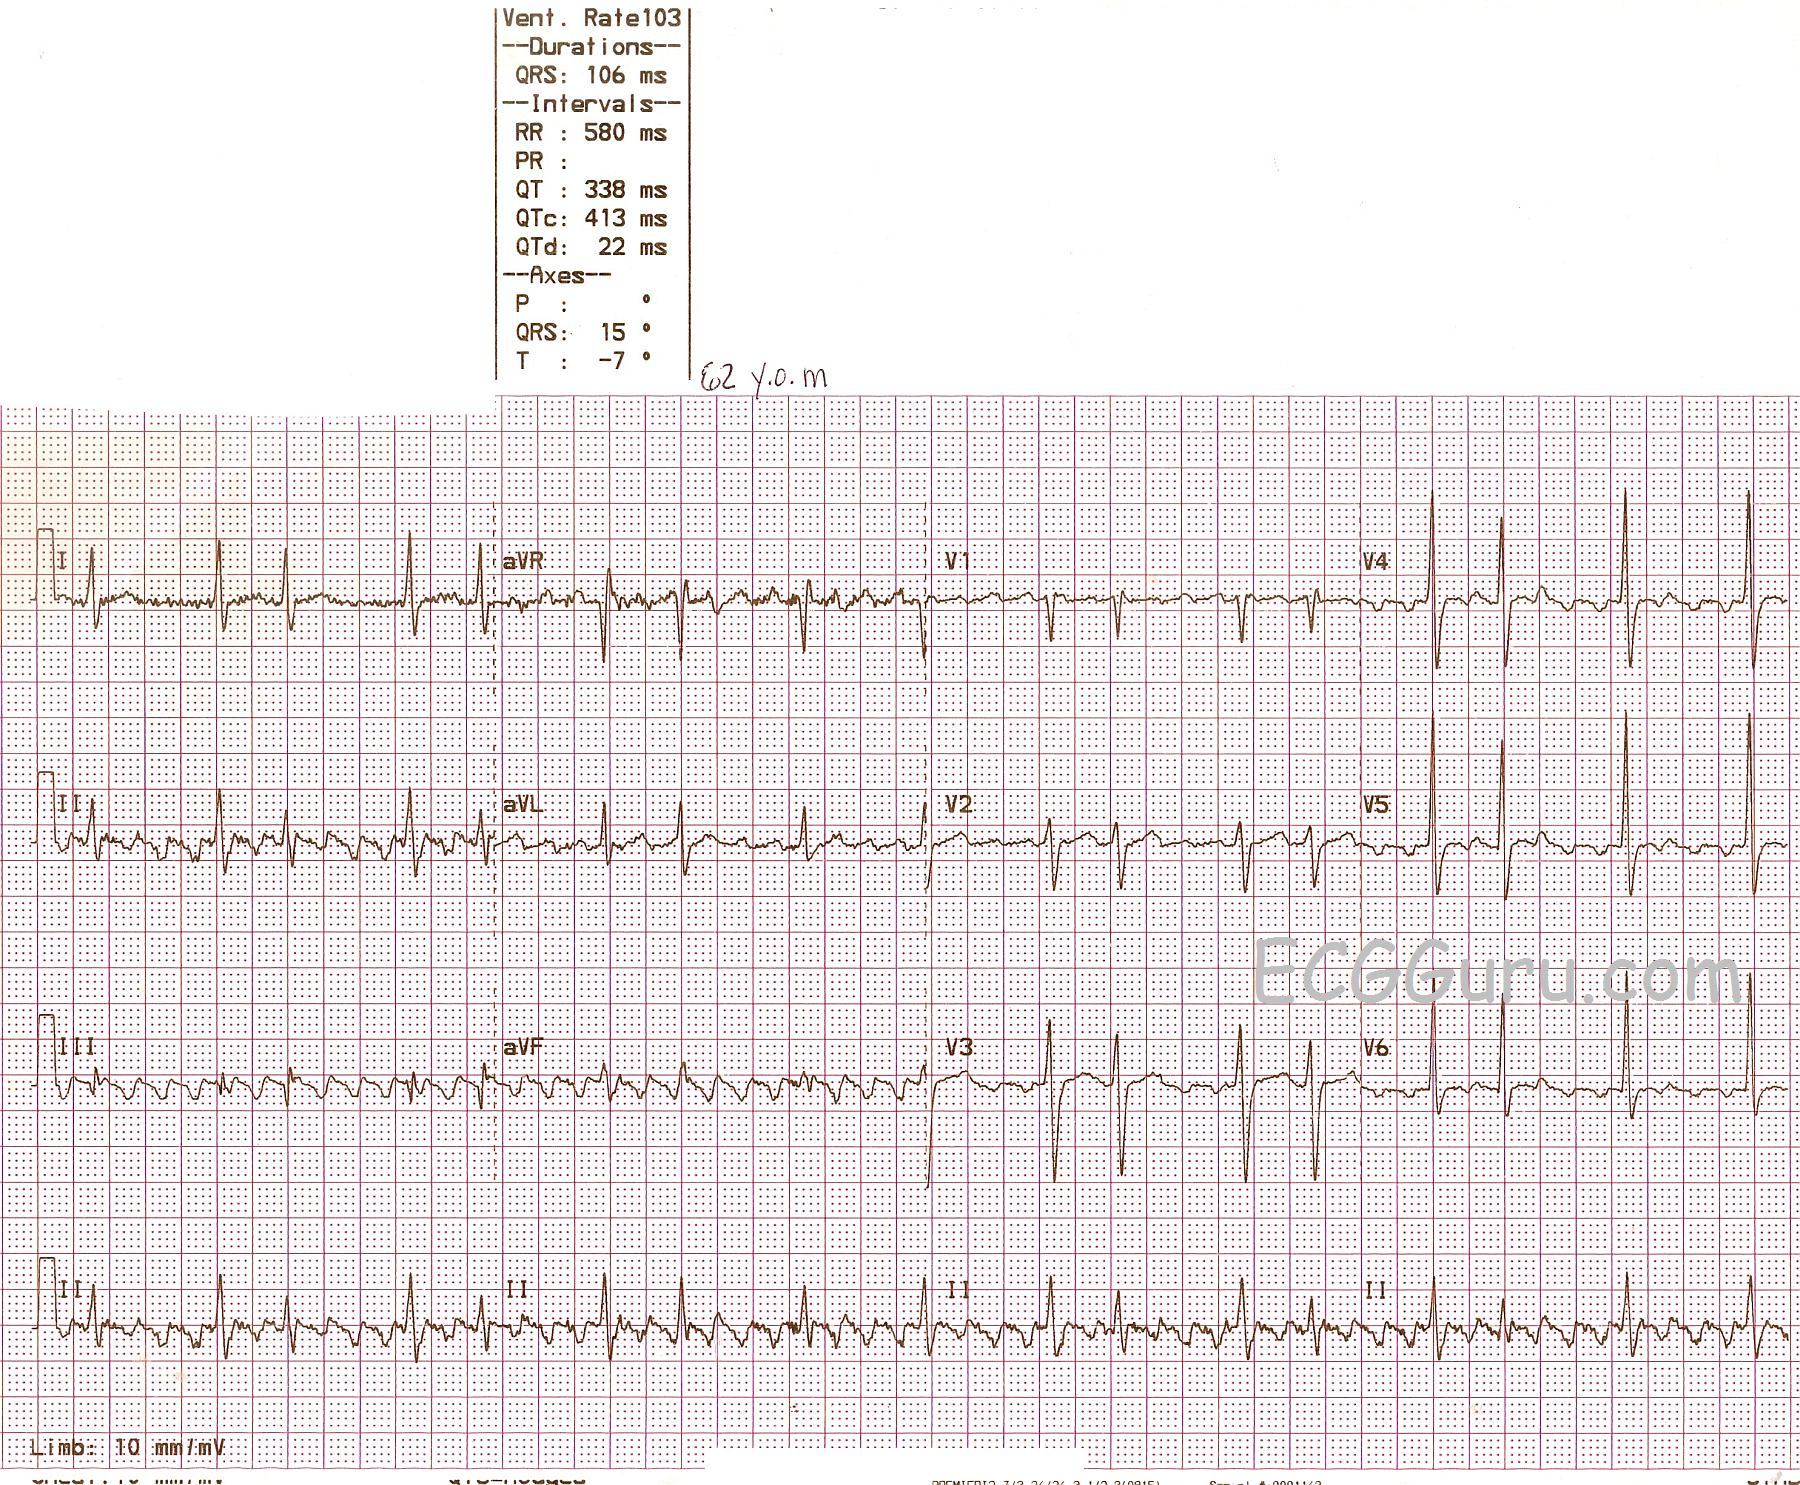
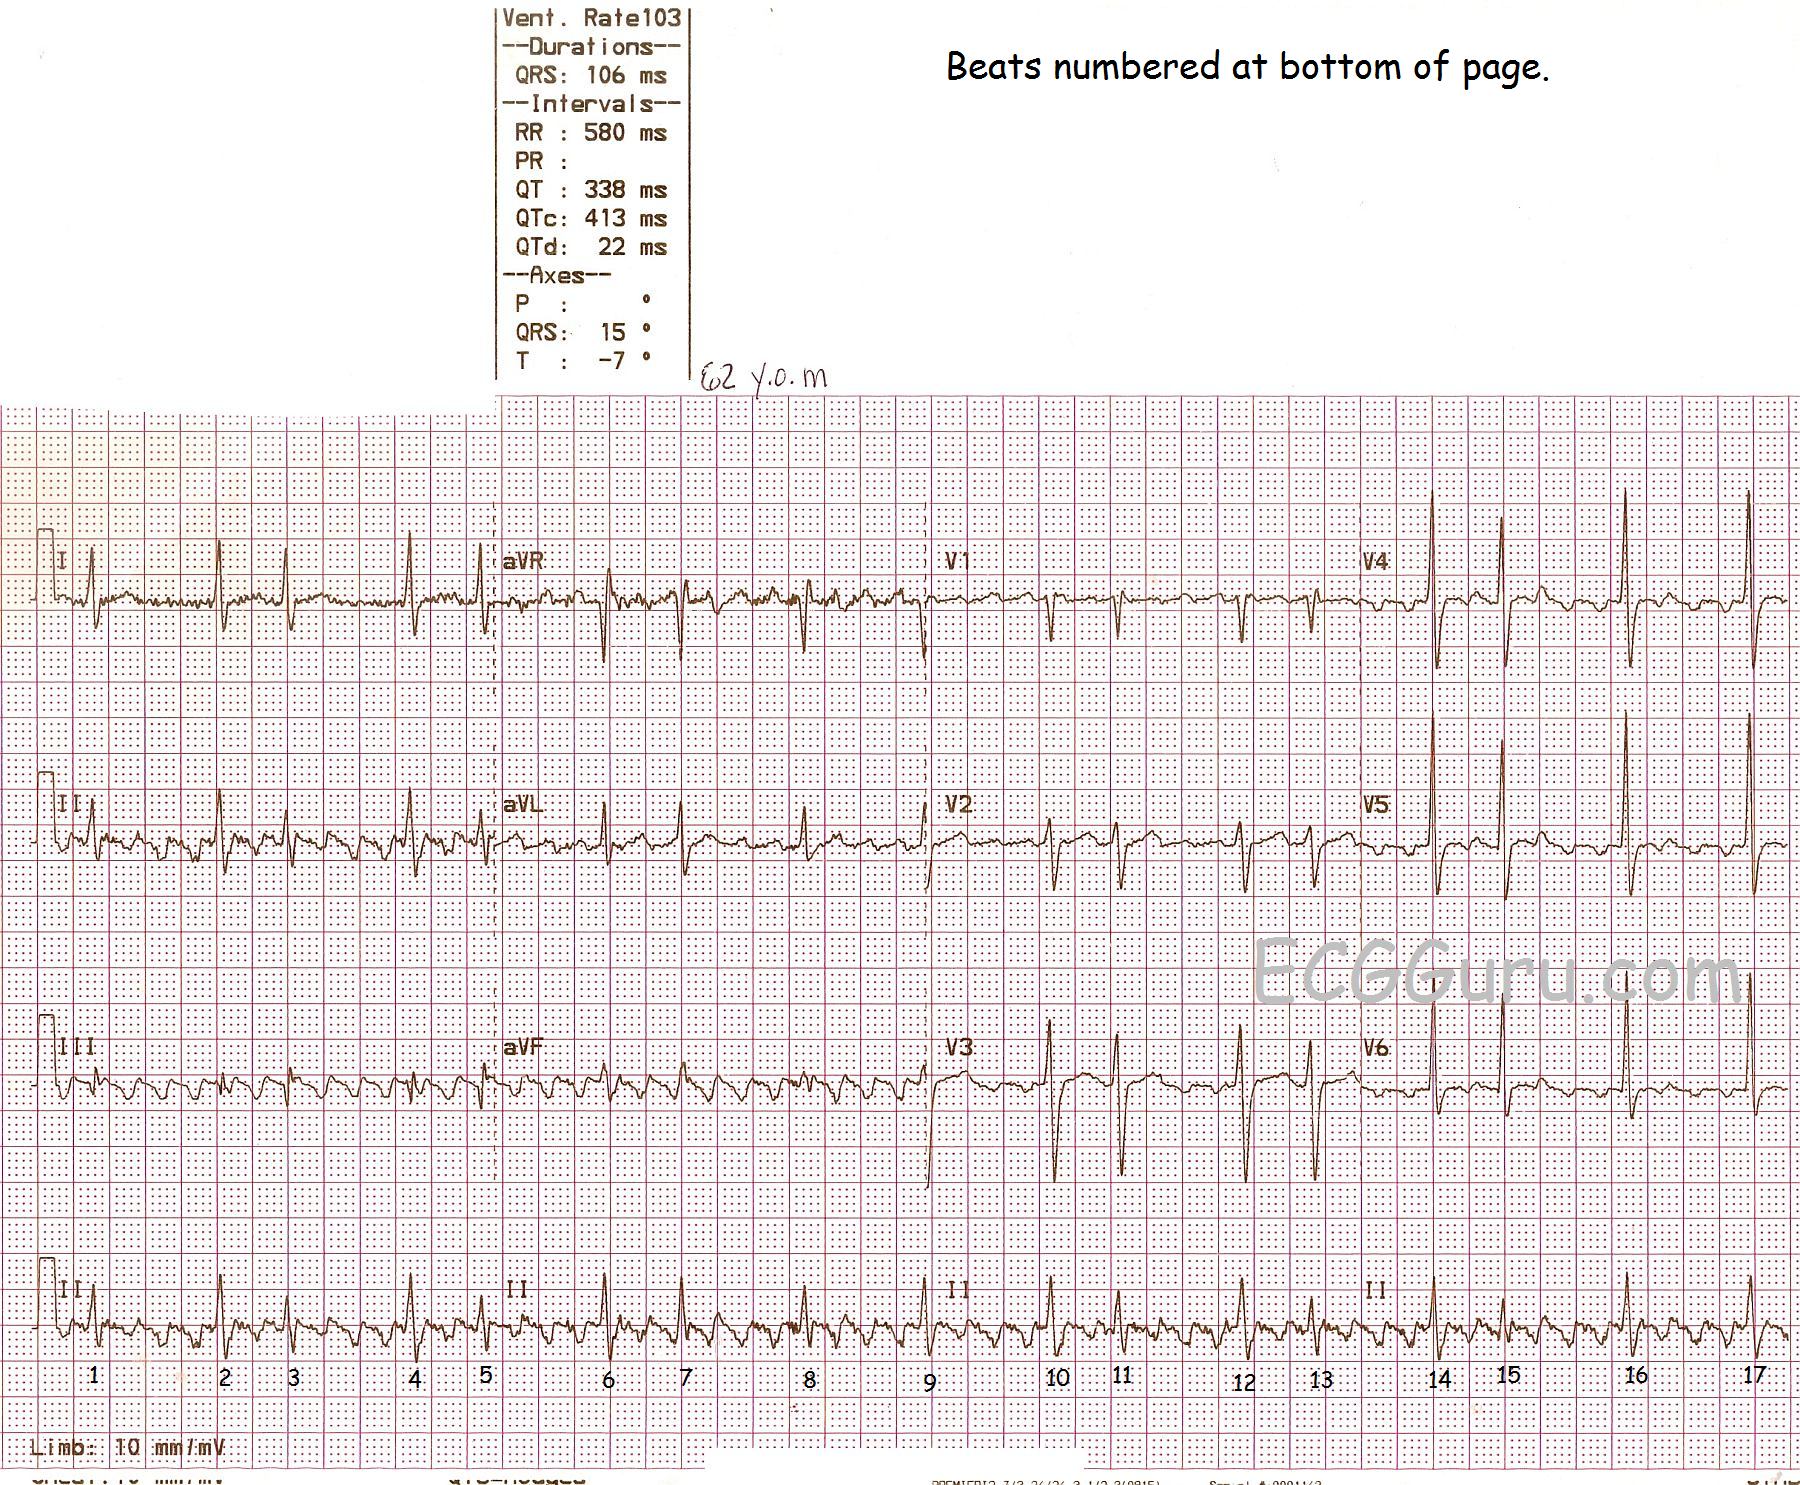
This ECG provides an example of atrial flutter with variable conduction. There are two distinct R - R intervals, making this a somewhat regularly-irregular rhythm, as opposed to the irregular irregularity of atrial fibrillation. The flutter waves (P waves) are very easy to see in most leads, but not in all. If you are teaching students who are making the transition from reading monitors and rhythm strips to 12-lead ECGs, this is a great ECG to illustrate for them how the more leads you have, the more you will see. The flutter waves are invisible in Lead I and, to the untrained eye, they may be hard to see in the precordial leads. The four channels on this ECG are run simultaneously, so if P waves or flutter waves are visible in one lead, they are also present in all leads that line up vertically with that one. In other words, the Lead II rhythm strip at the bottom confirms that flutter waves exist across the entire ECG.
The R - R intervals in this ECG reflect alternating 2:1 and 4:1 conduction. There are a couple of times when the 4:1 ratio repeats itself without alternating. Often, the length of these varying R - R intervals will be multiples of each other, or have a common denominator. These do not appear to, and may reflect the fact that, when R to P intervals lengthen, R to R intervals sometimes shorten. In other words, the PR intervals, which are difficult to measure in atrial flutter, may be changing. I would invite my colleagues with more expertise in this area to comment below.
There are no blatant ST segment abnormalities here, but ST segments can be very difficult to assess in atrial flutter because of the flutter waves. We do not have clinical data, other than this is a 62-year-old man.