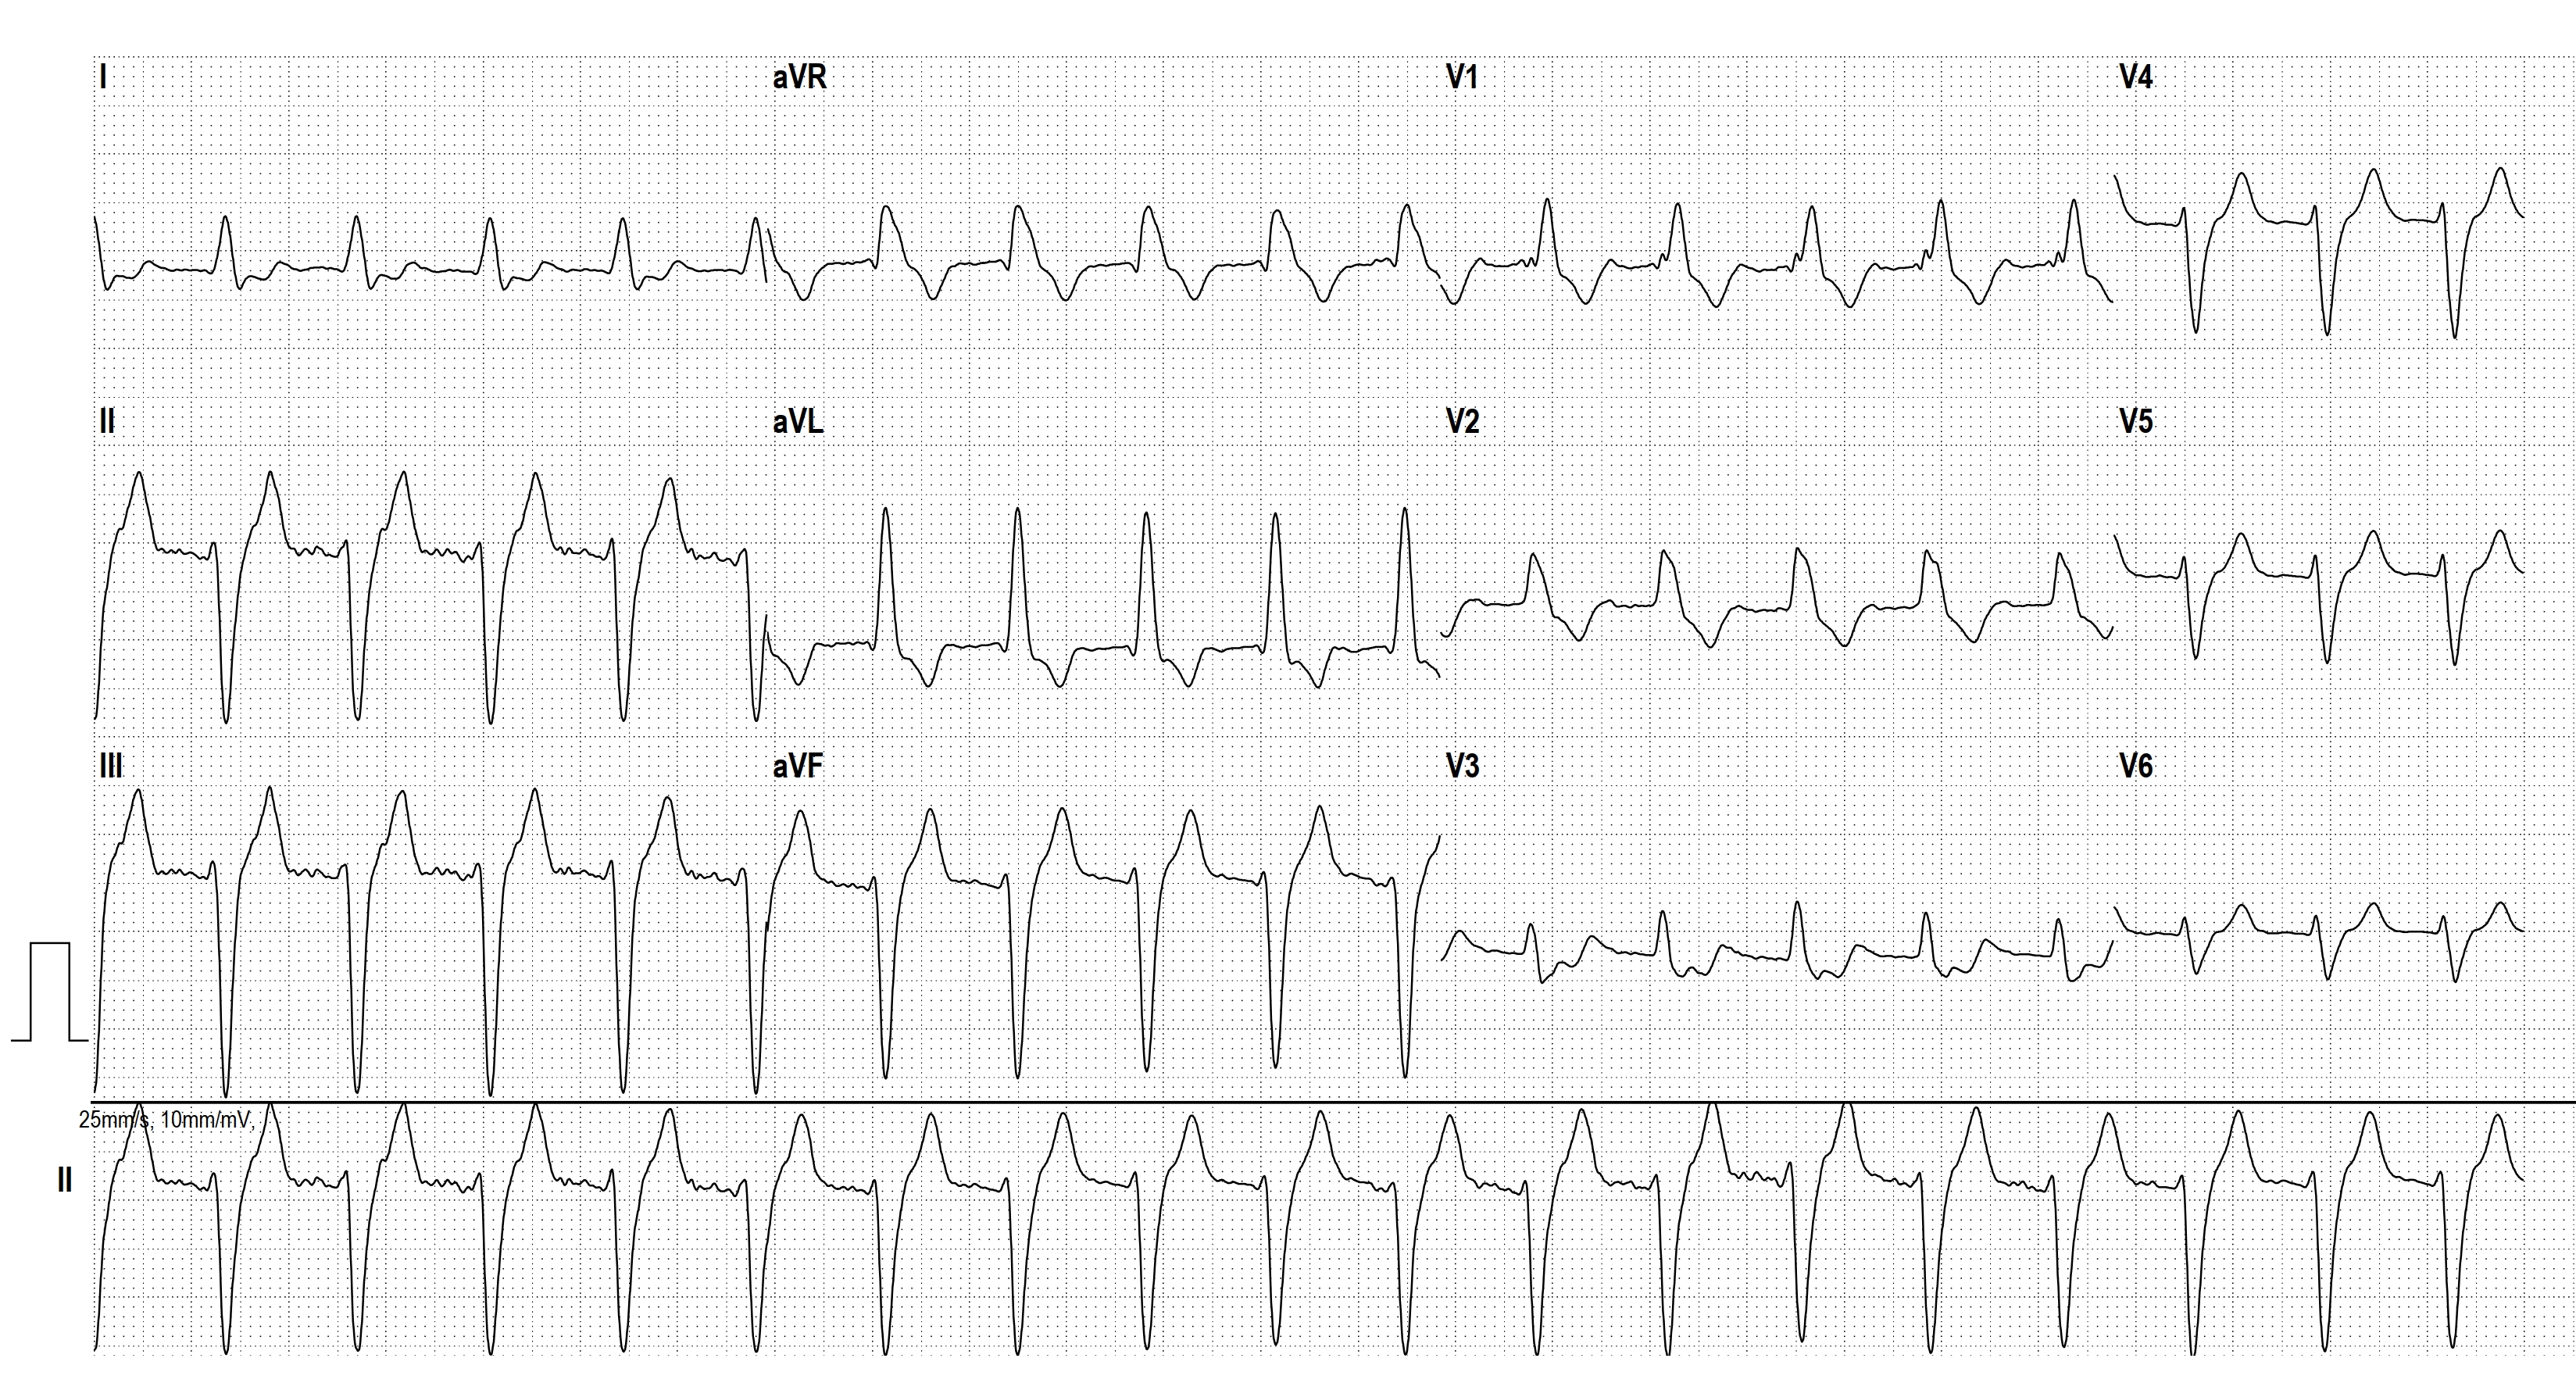
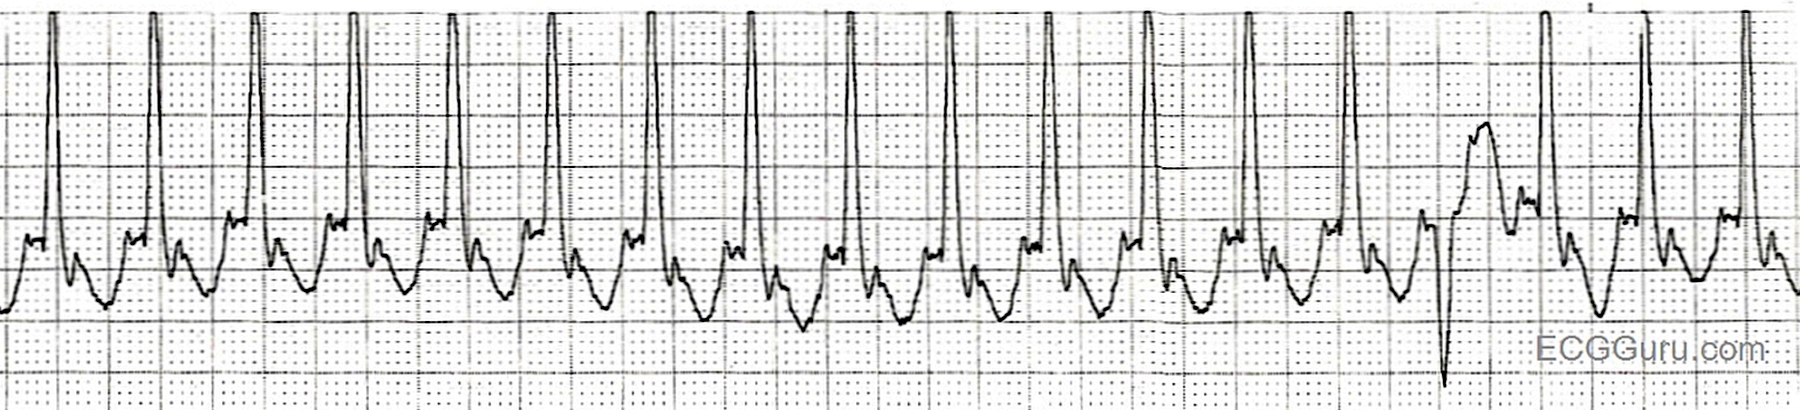
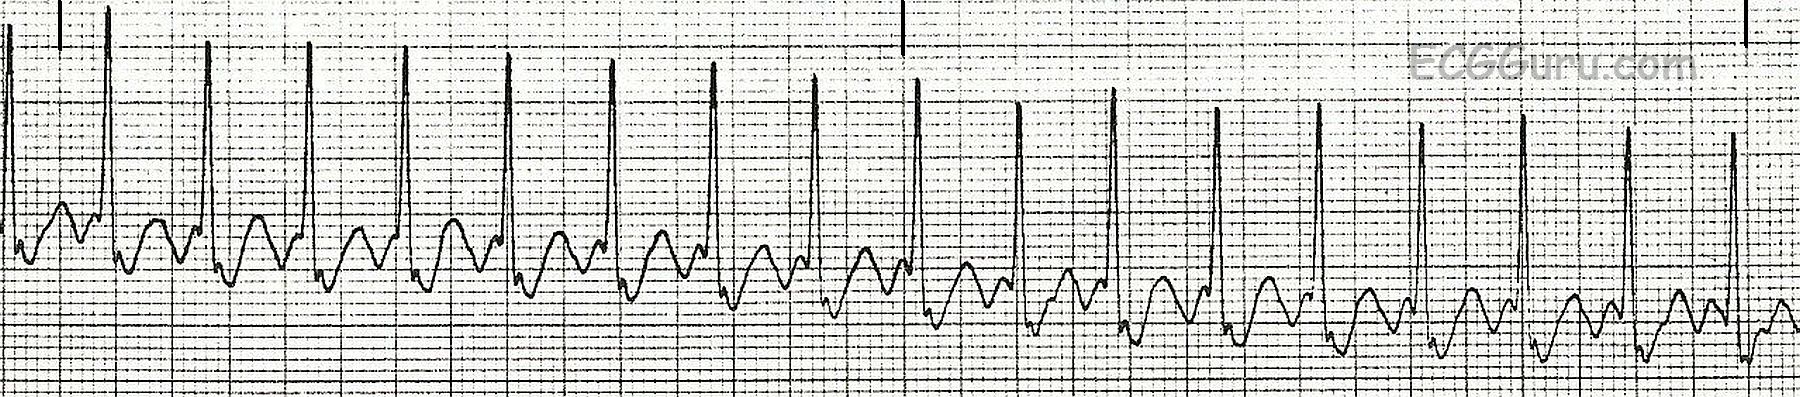
One of the most frequently misdiagnosed rhythms, atrial flutter with 2:1 conduction often masquerades as sinus tach. Sinus tach usually has an obvious cause, such as exercise, severe hypovolemia, or age less than 6 months. Atrial flutter usually produces flutter waves (P waves) at a rate of 250 - 350 per minute. Therefore, a 2:1 conduction ratio would result in a heart rate of about 125 - 175 bpm).
Often, students are taught about atrial flutter using an electronic rhythm generator or a book with limited illustrations, and they become acustomed to seeing atrial flutter with 3:1 or 4:1 conduction. The flutter waves are very easy to see in such a situation. However, the AV node, if not affected by medication, is usually well able to conduct at a rate of 150 or more. Therefore, the physiological block that protects us from extreme rates will keep the heart rate around 150 bpm in atrial flutter.
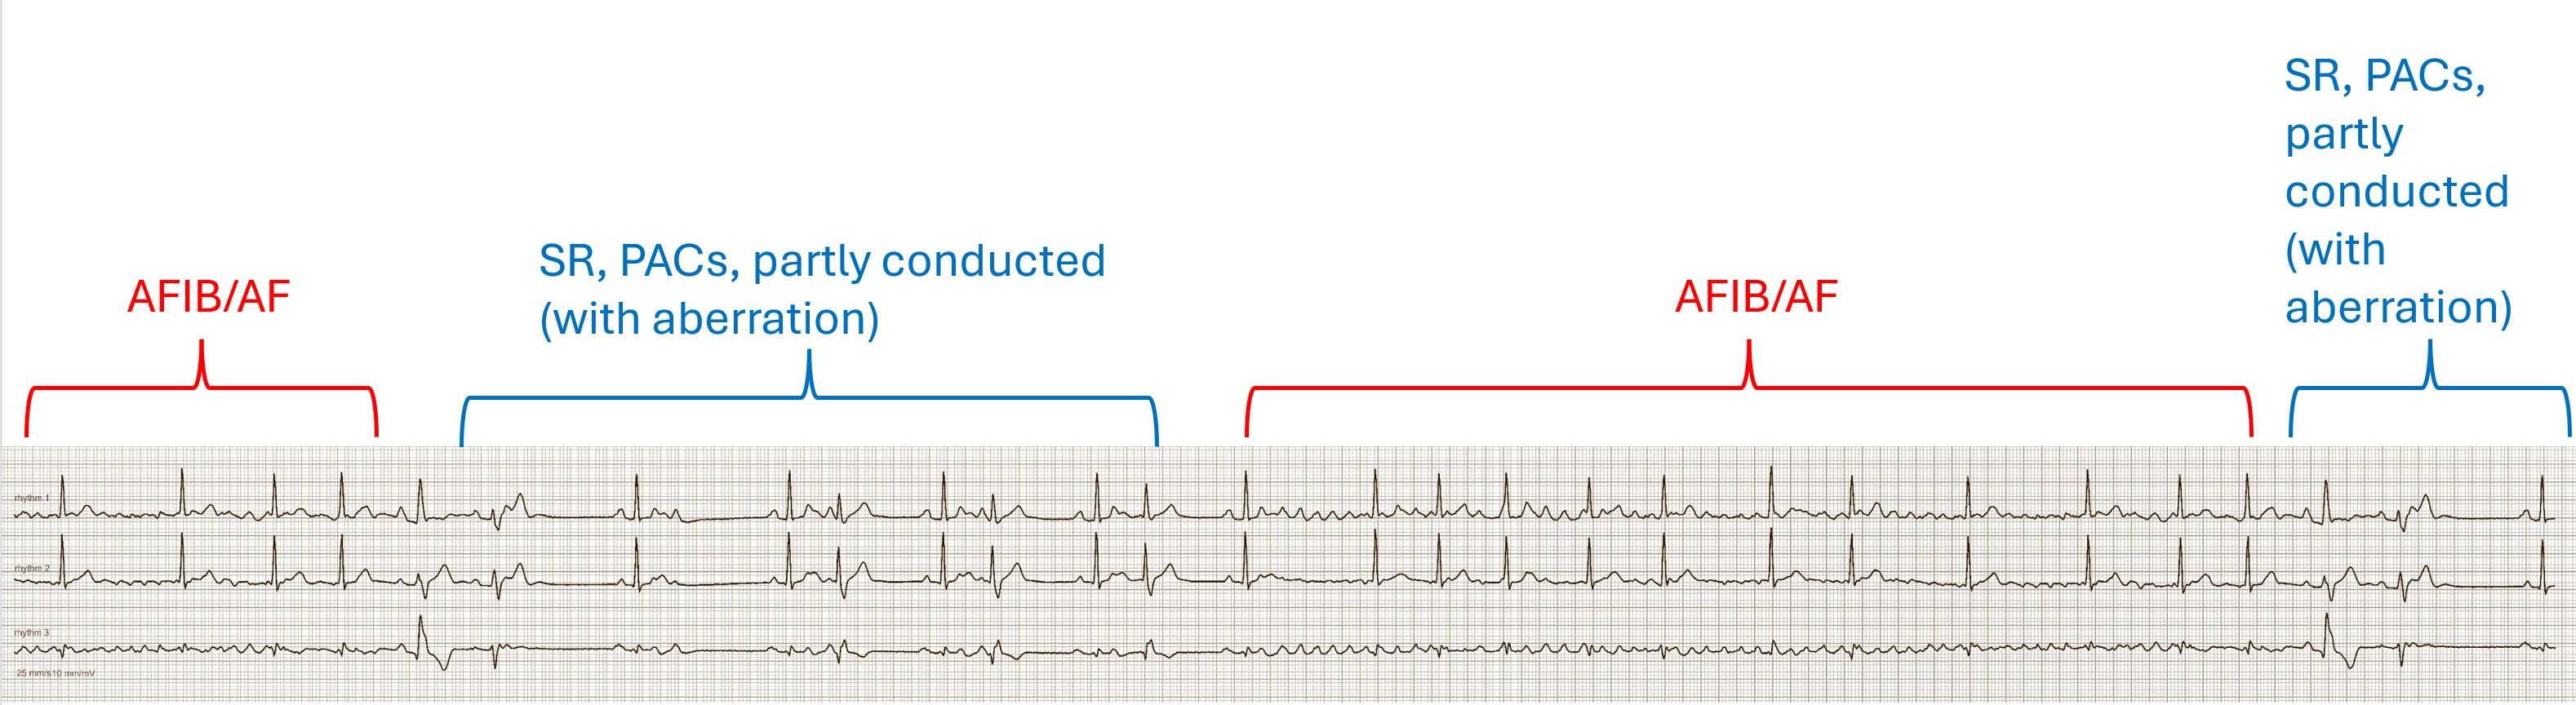
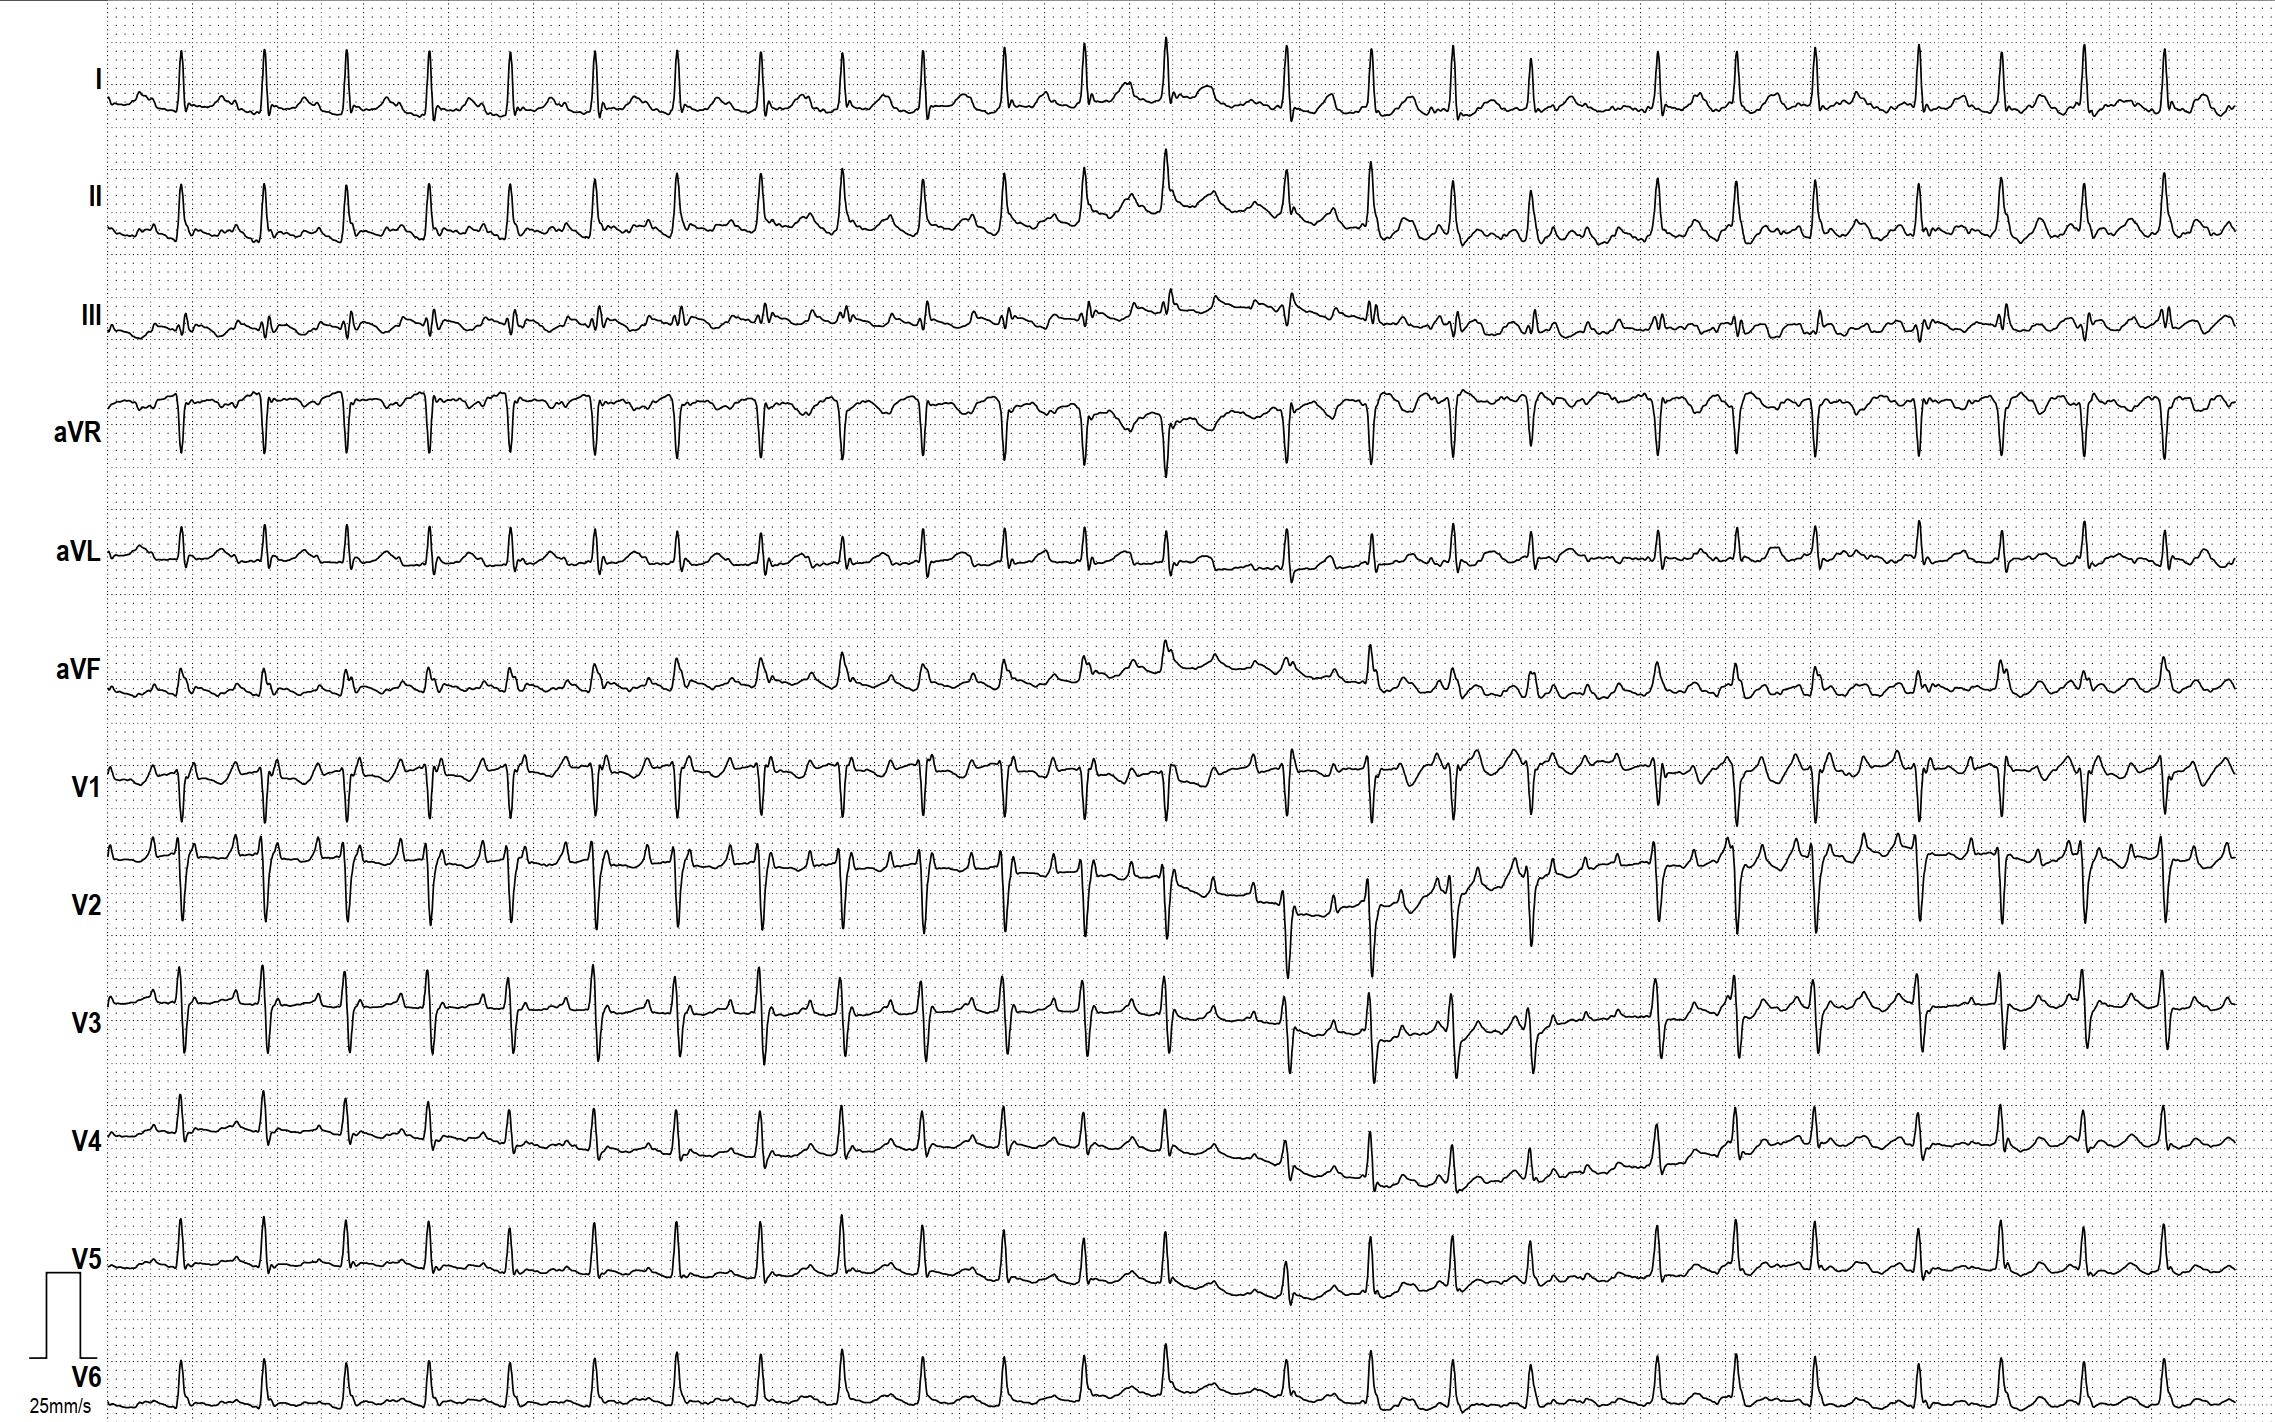
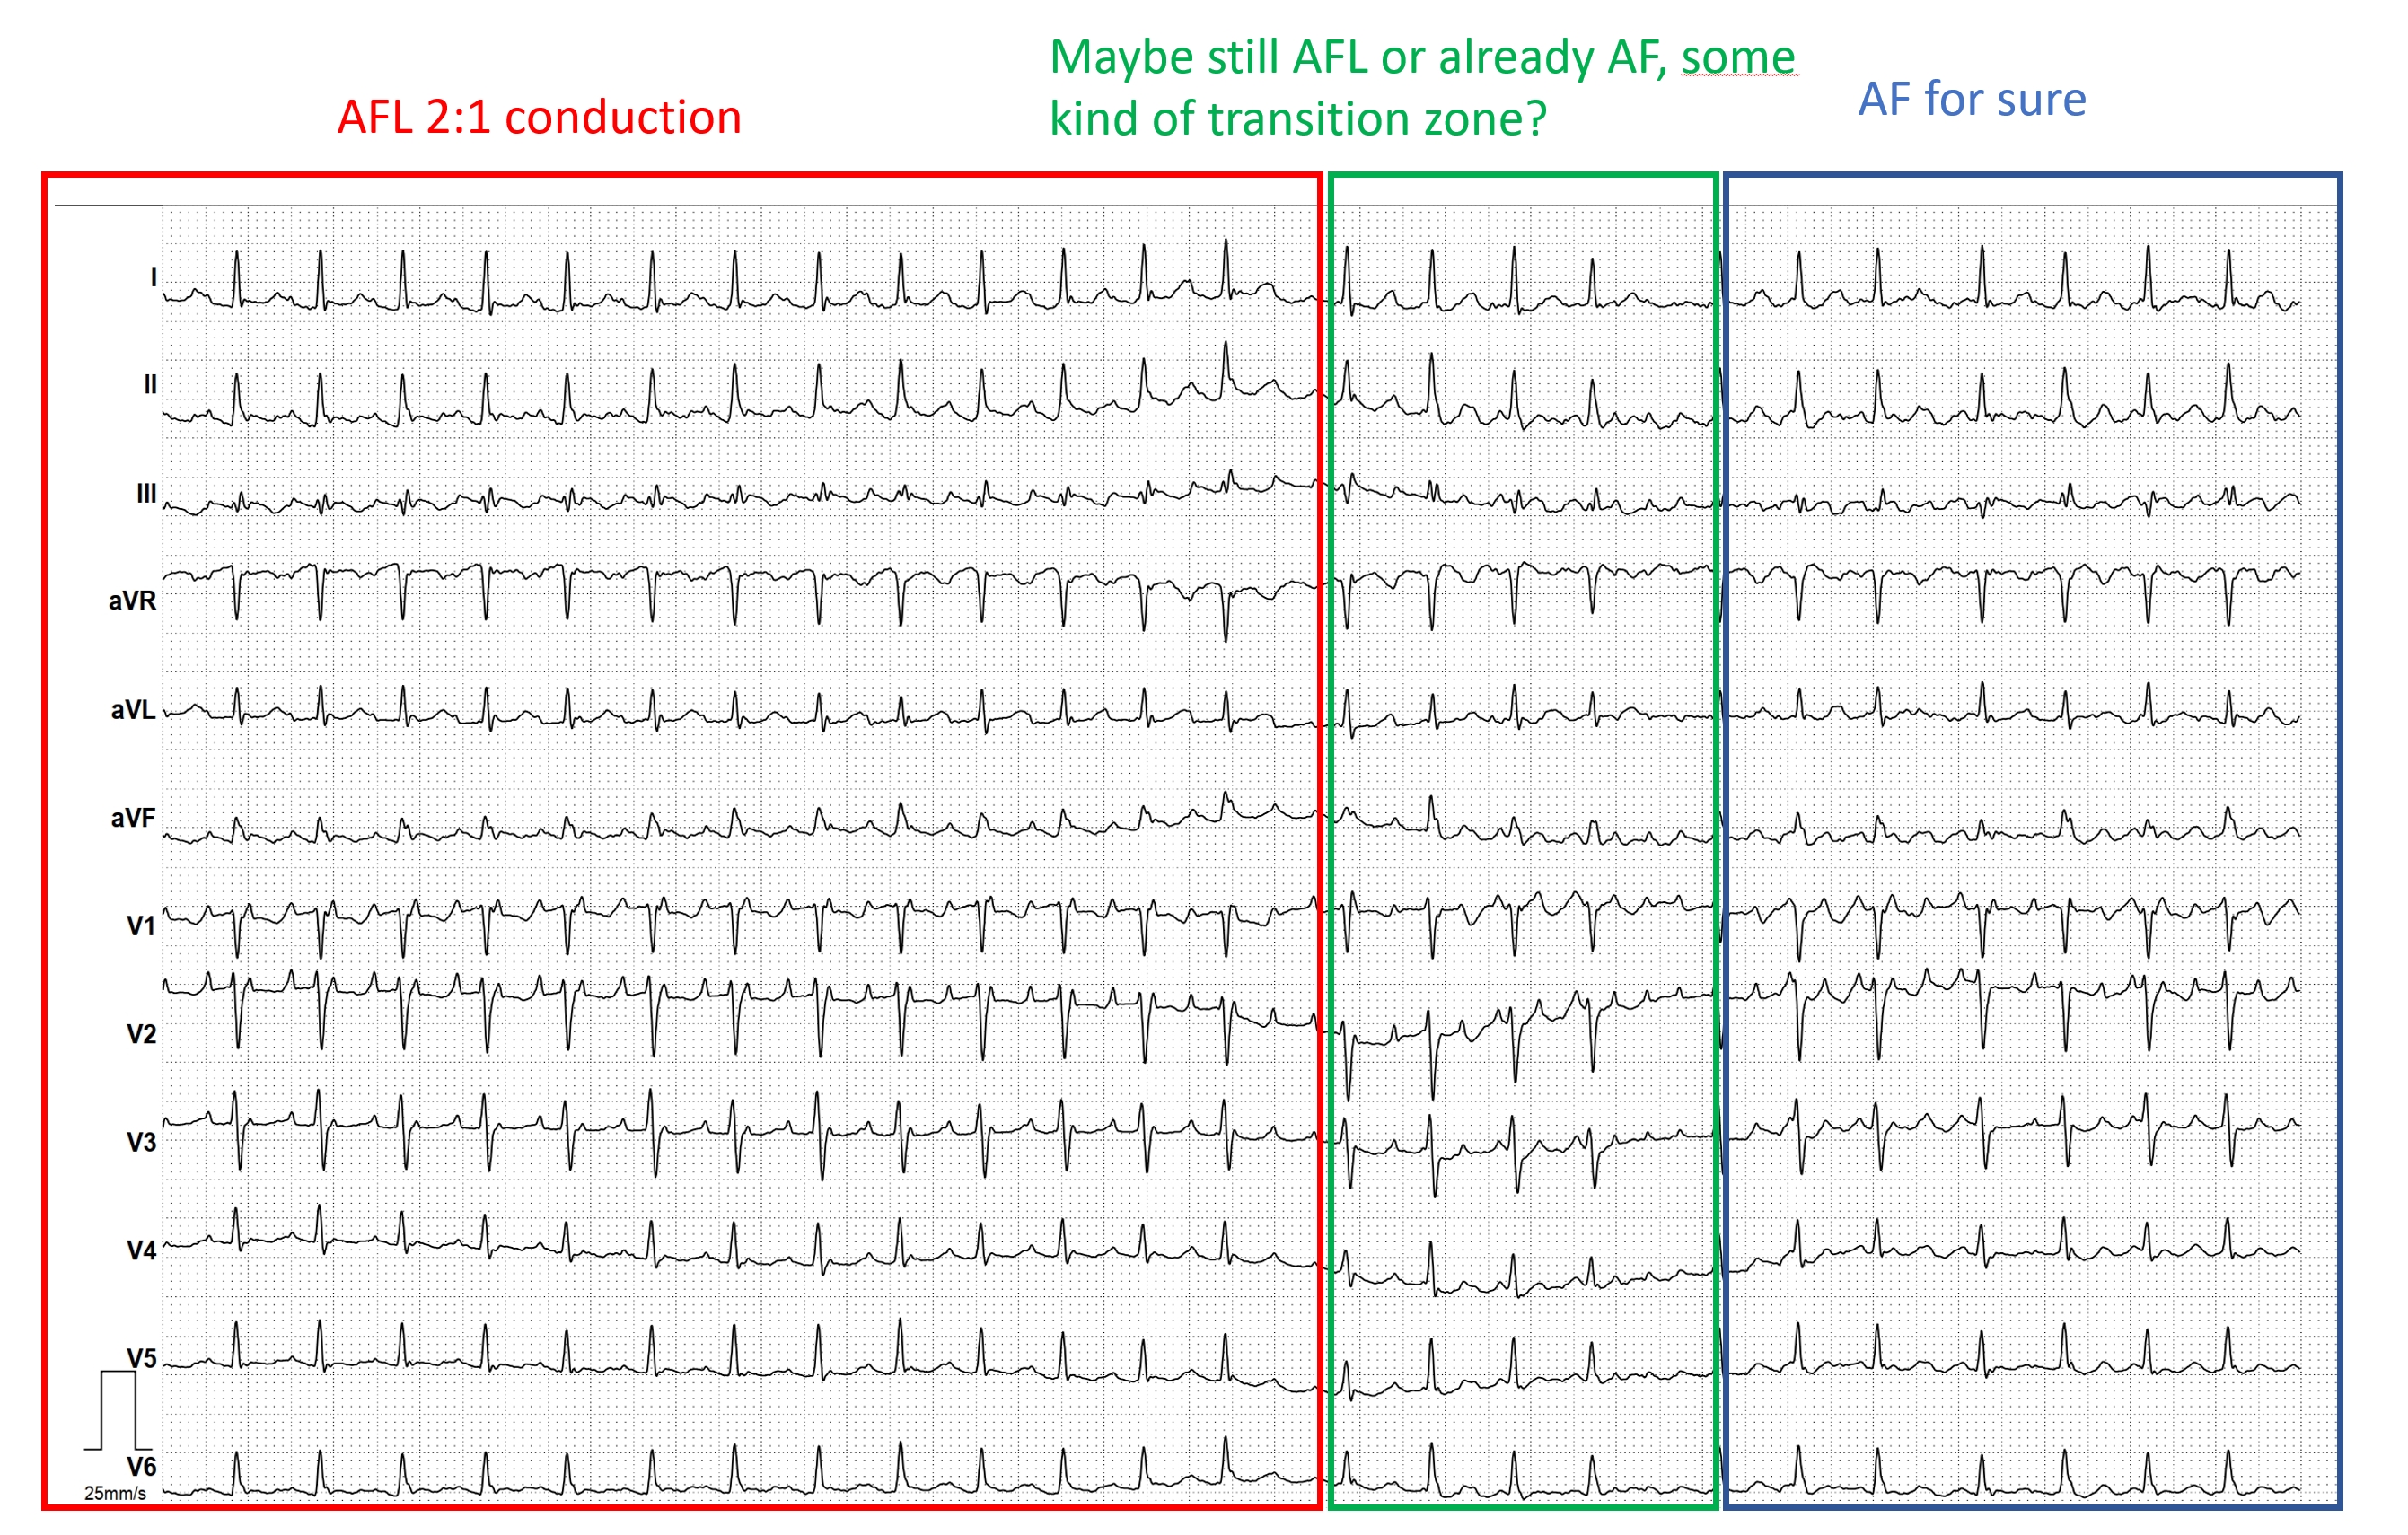
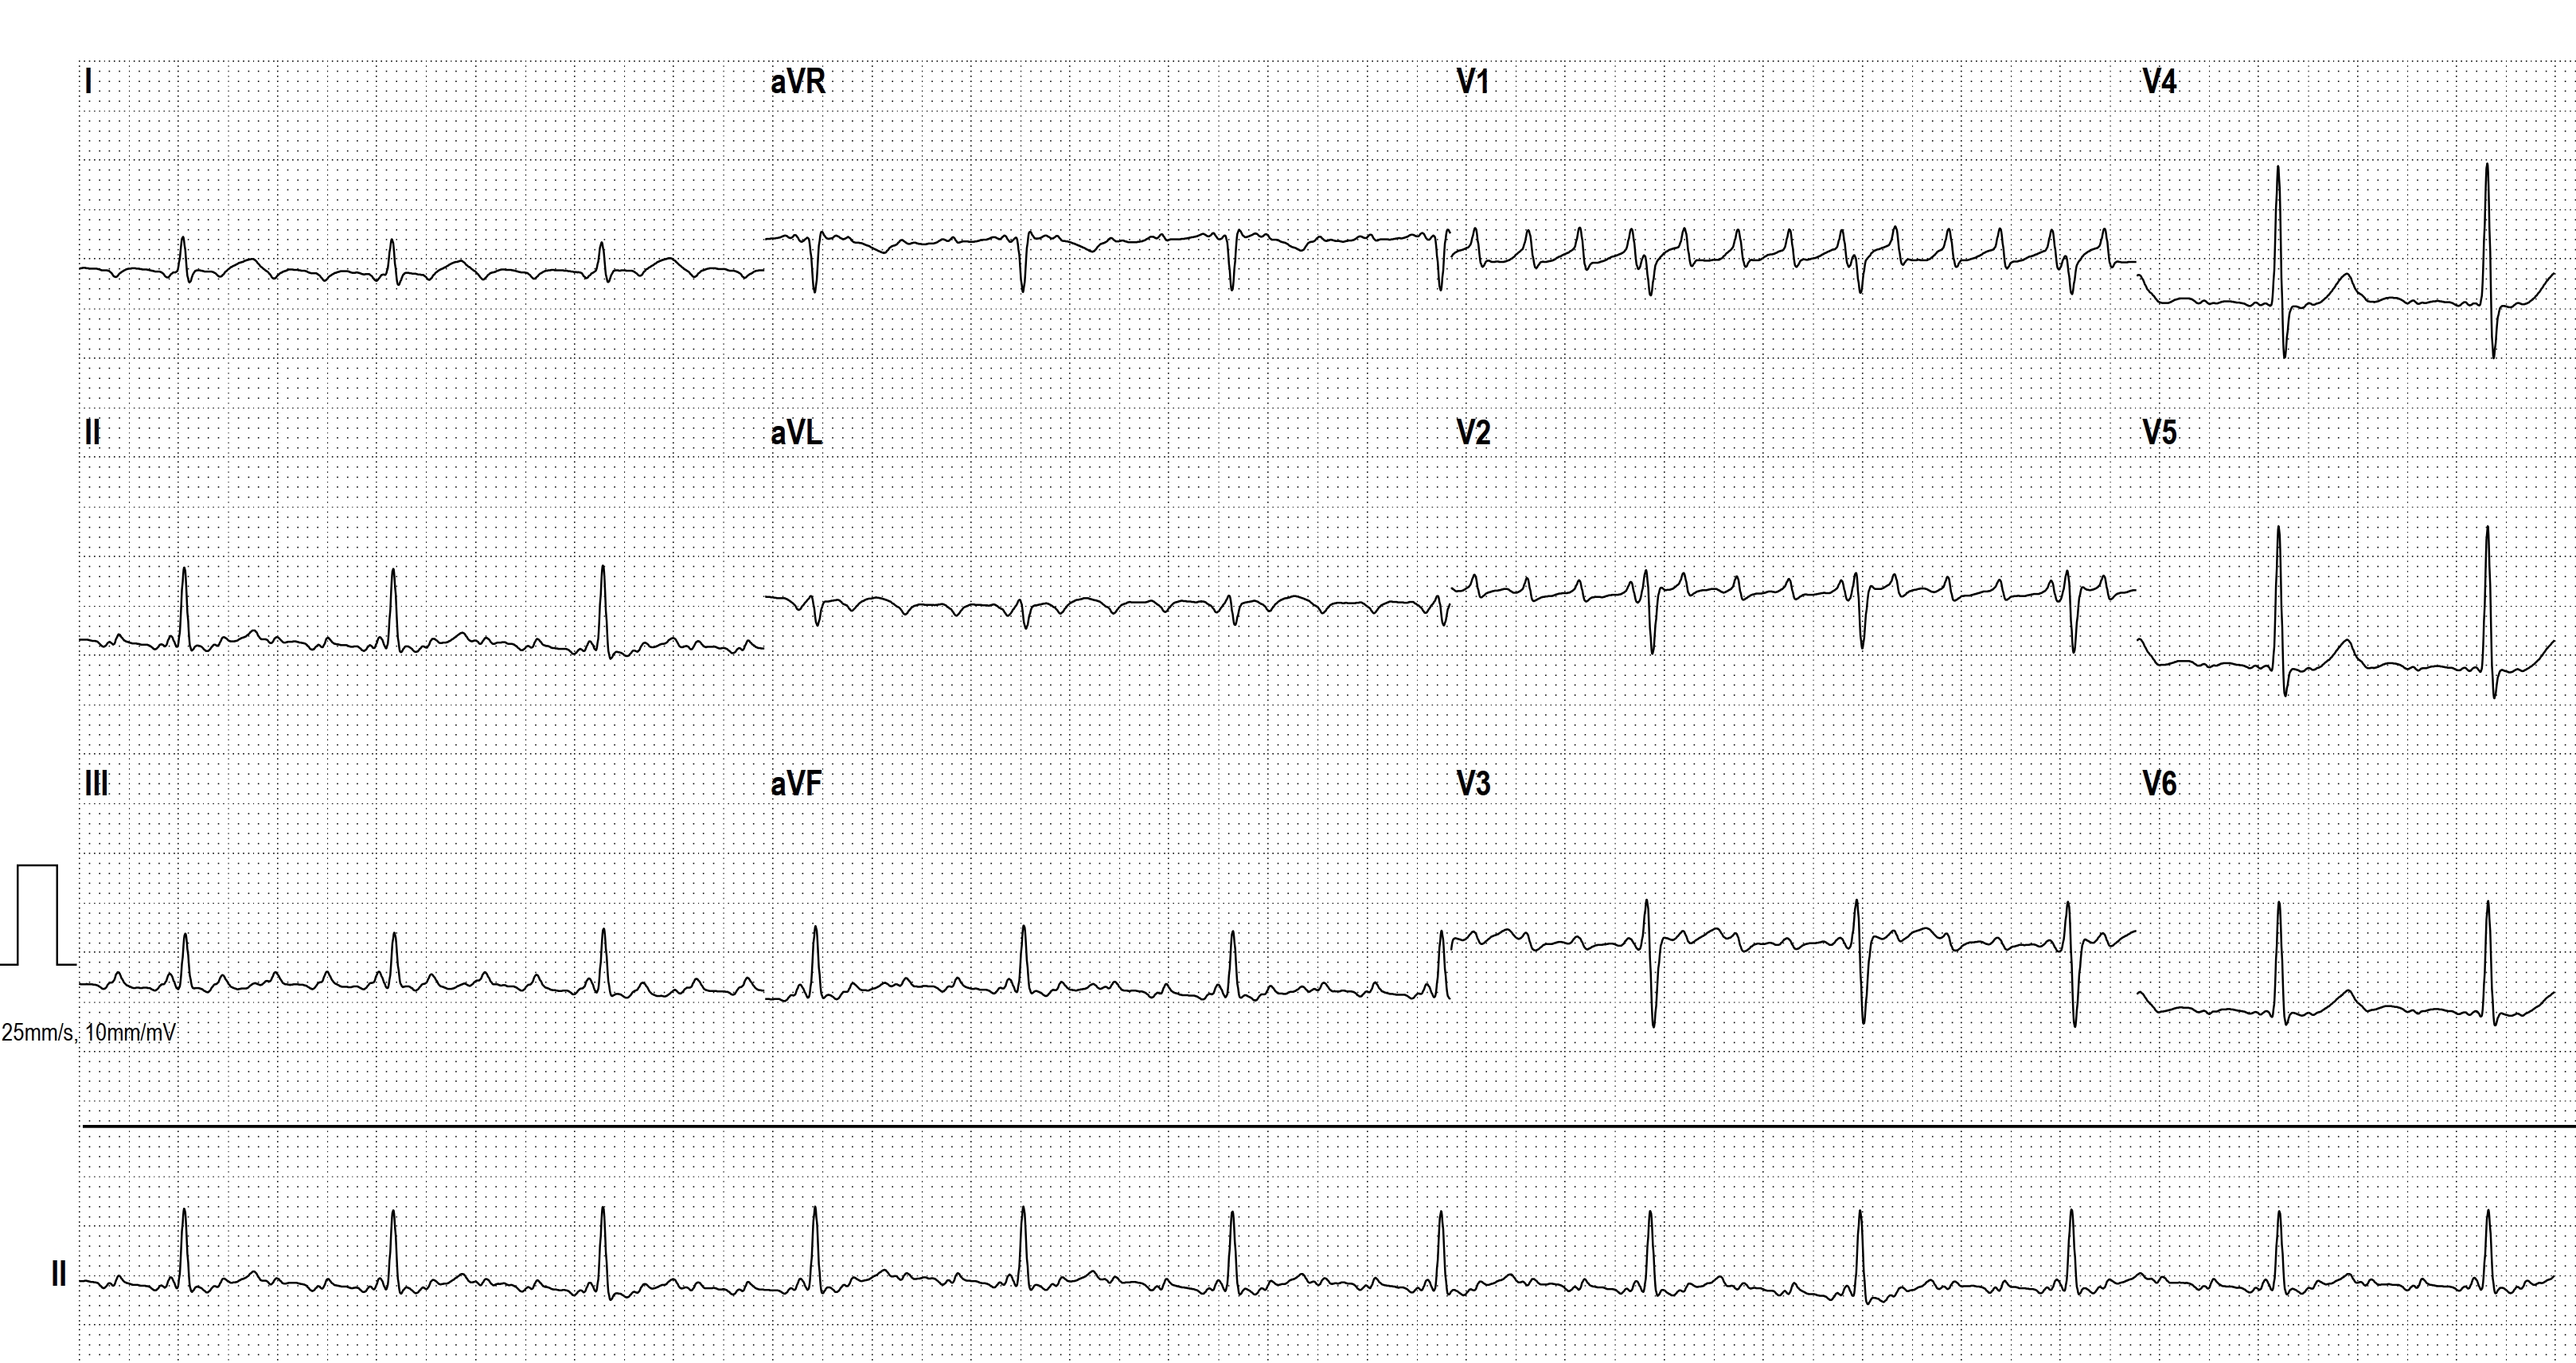
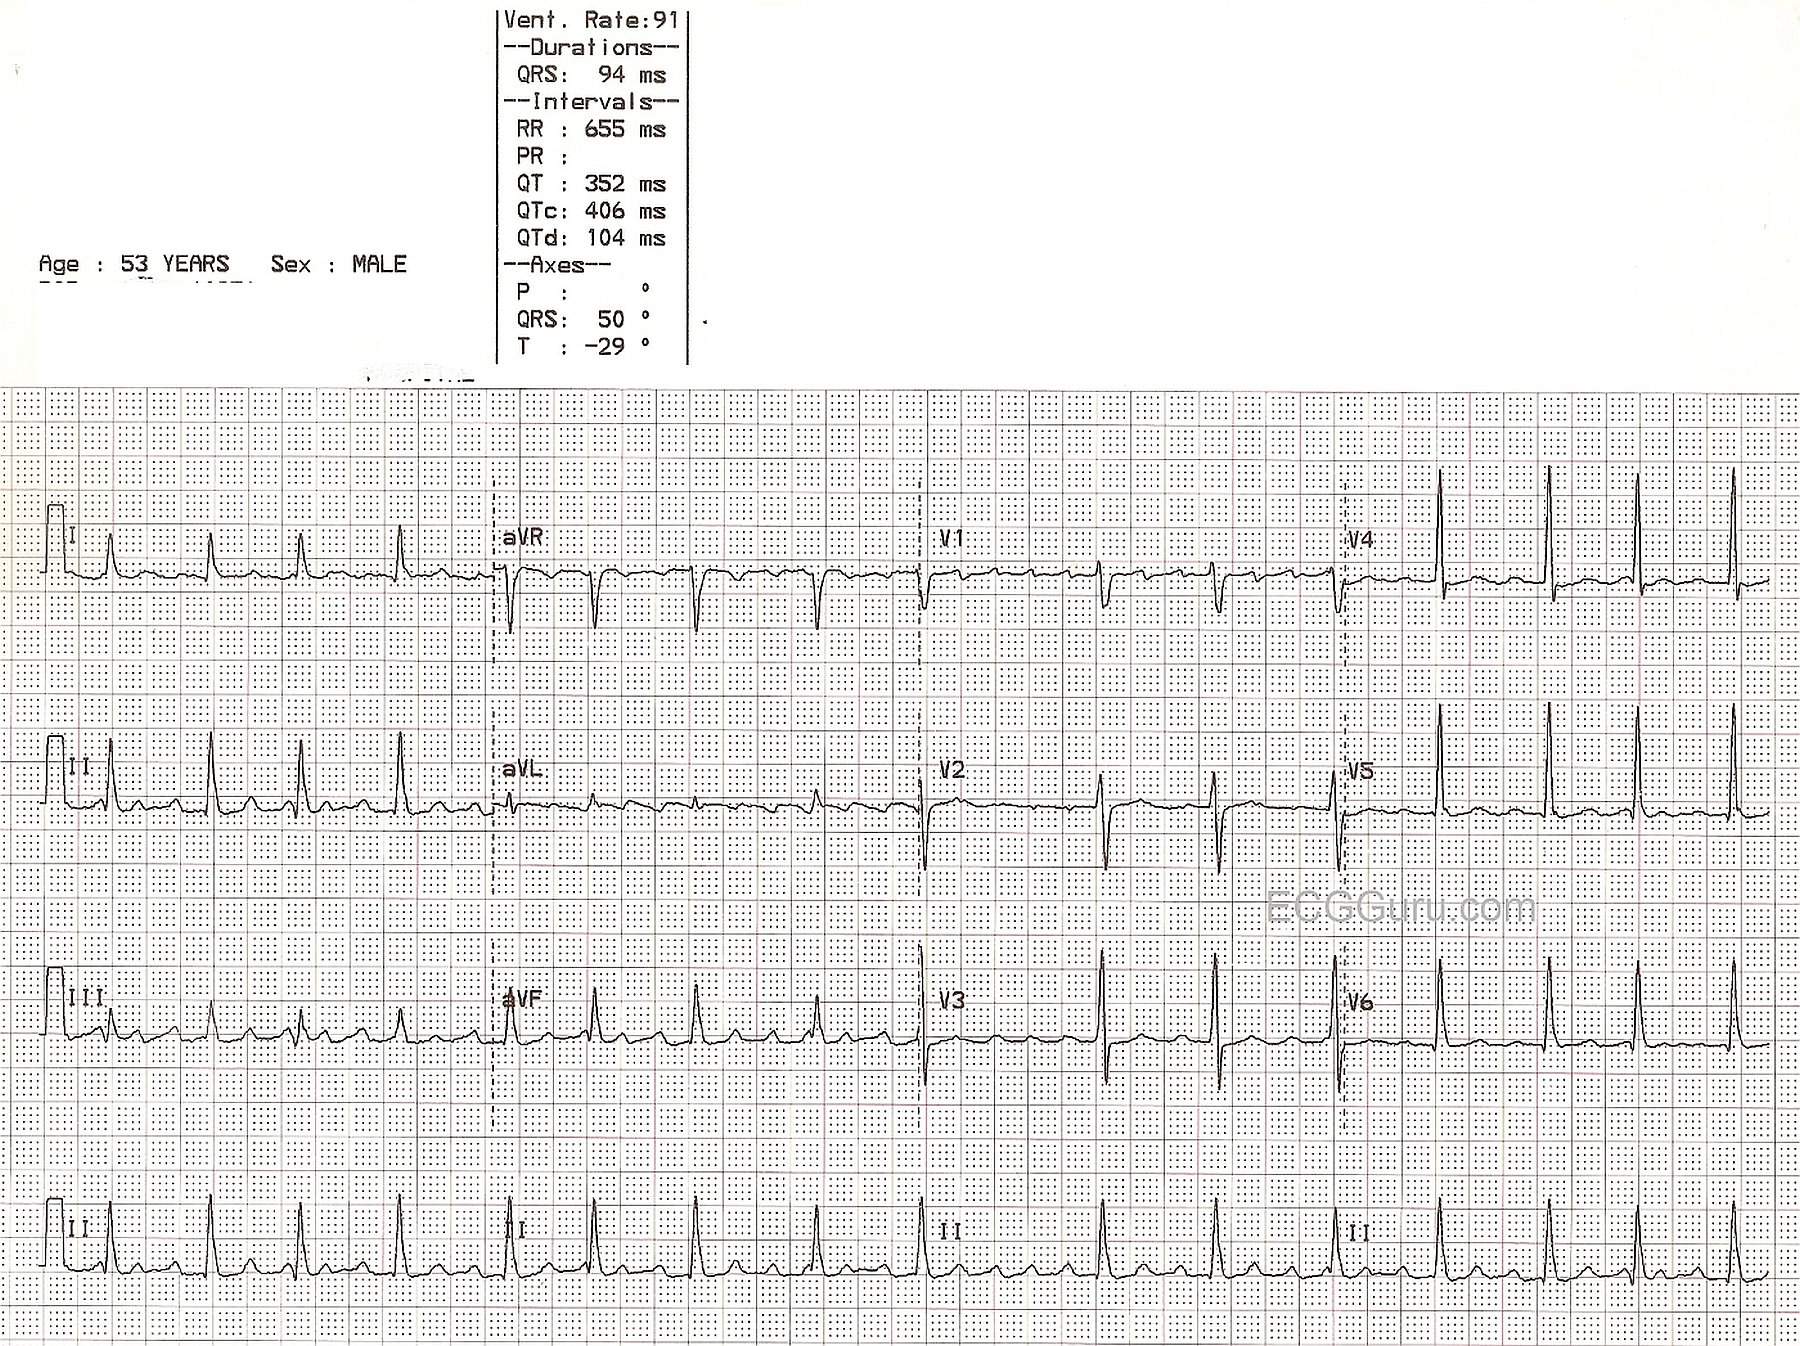
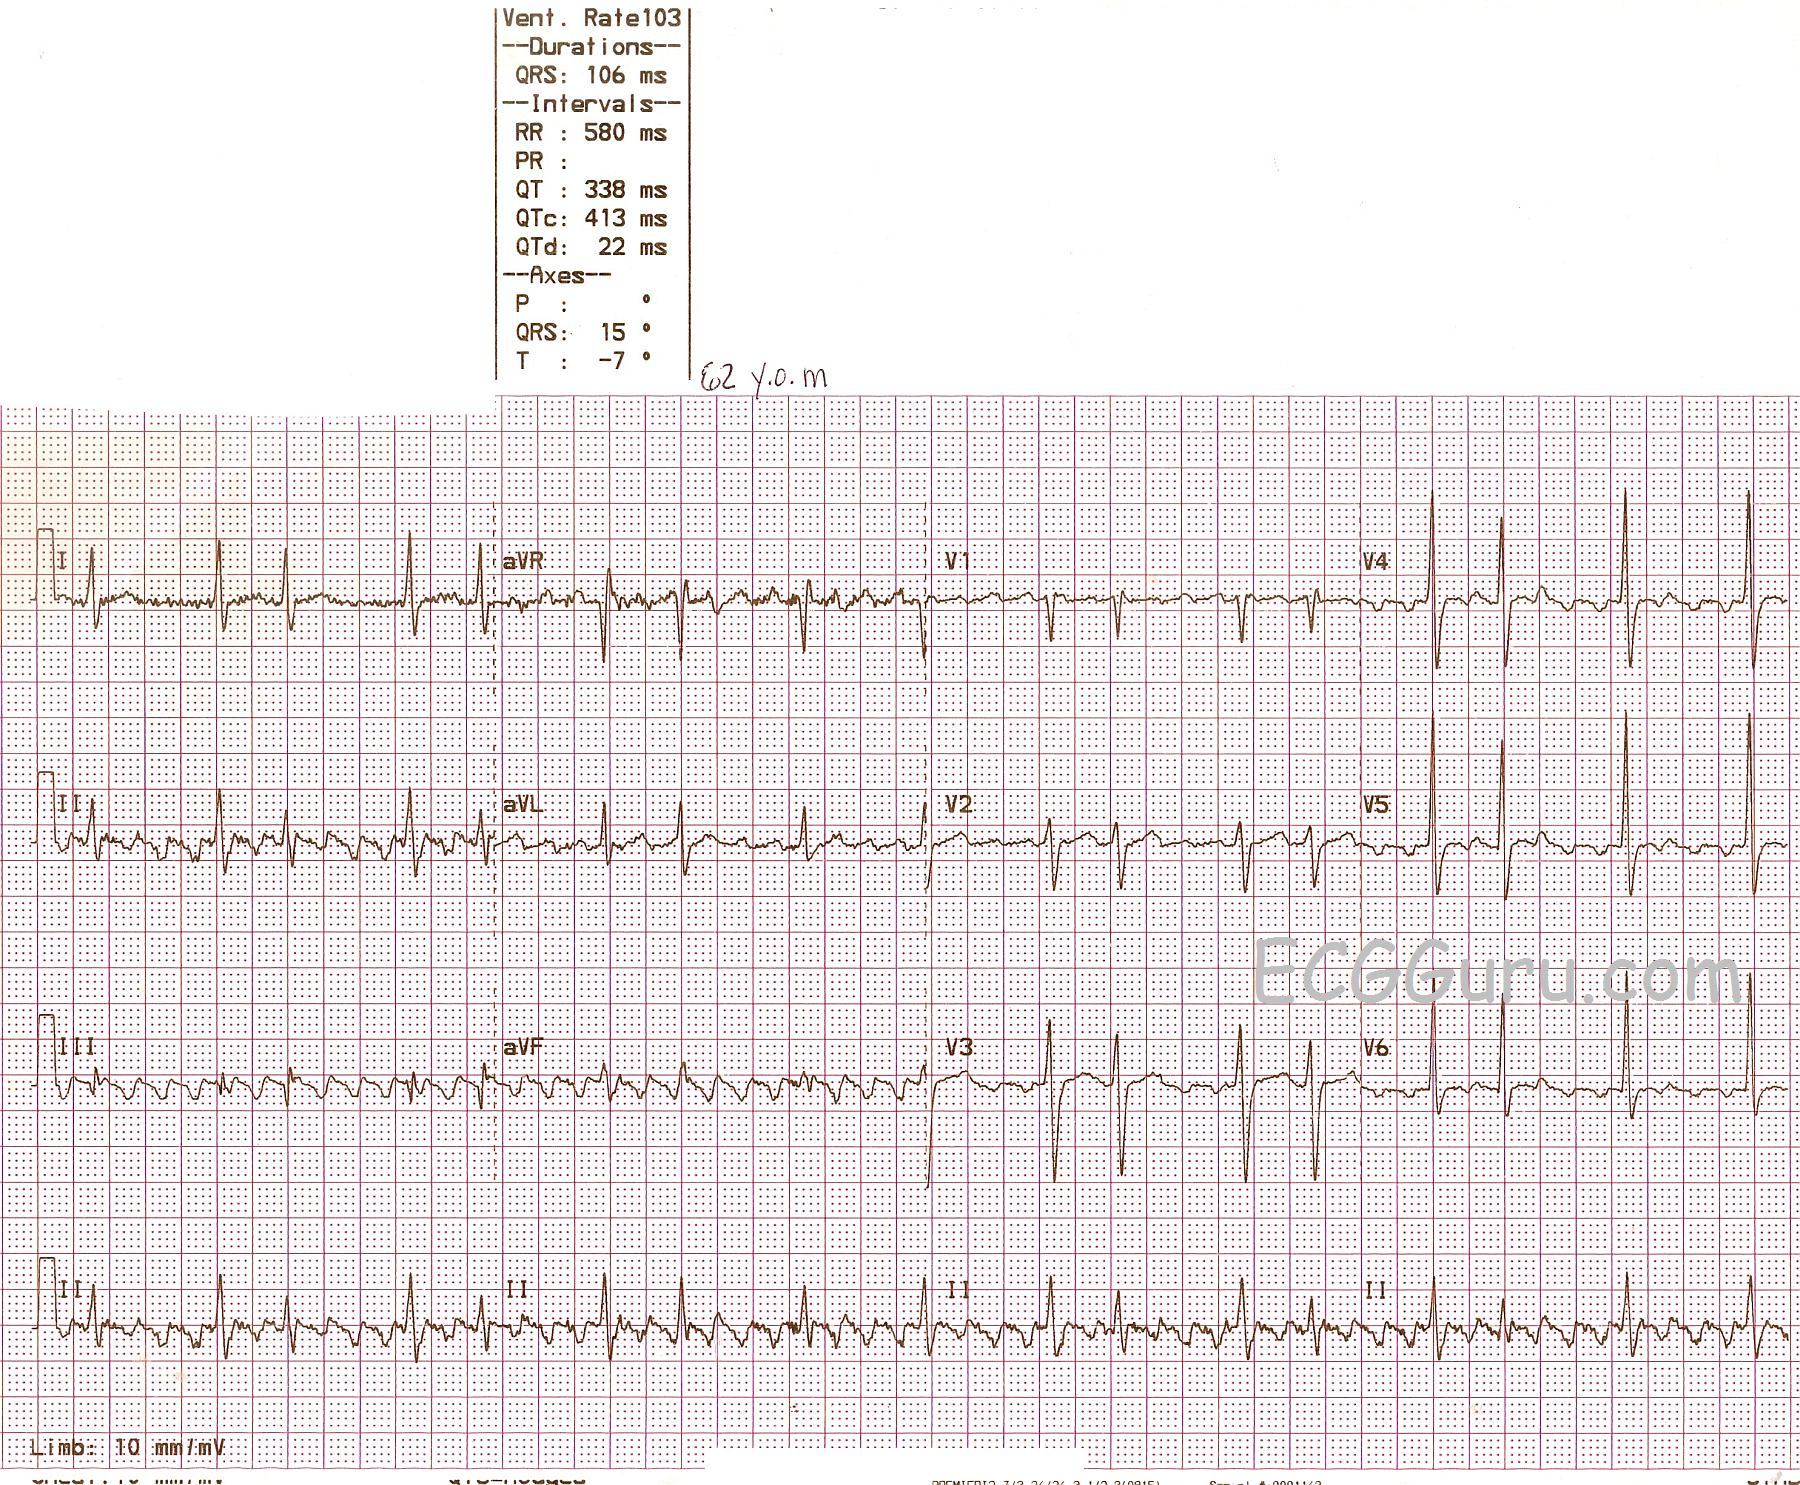
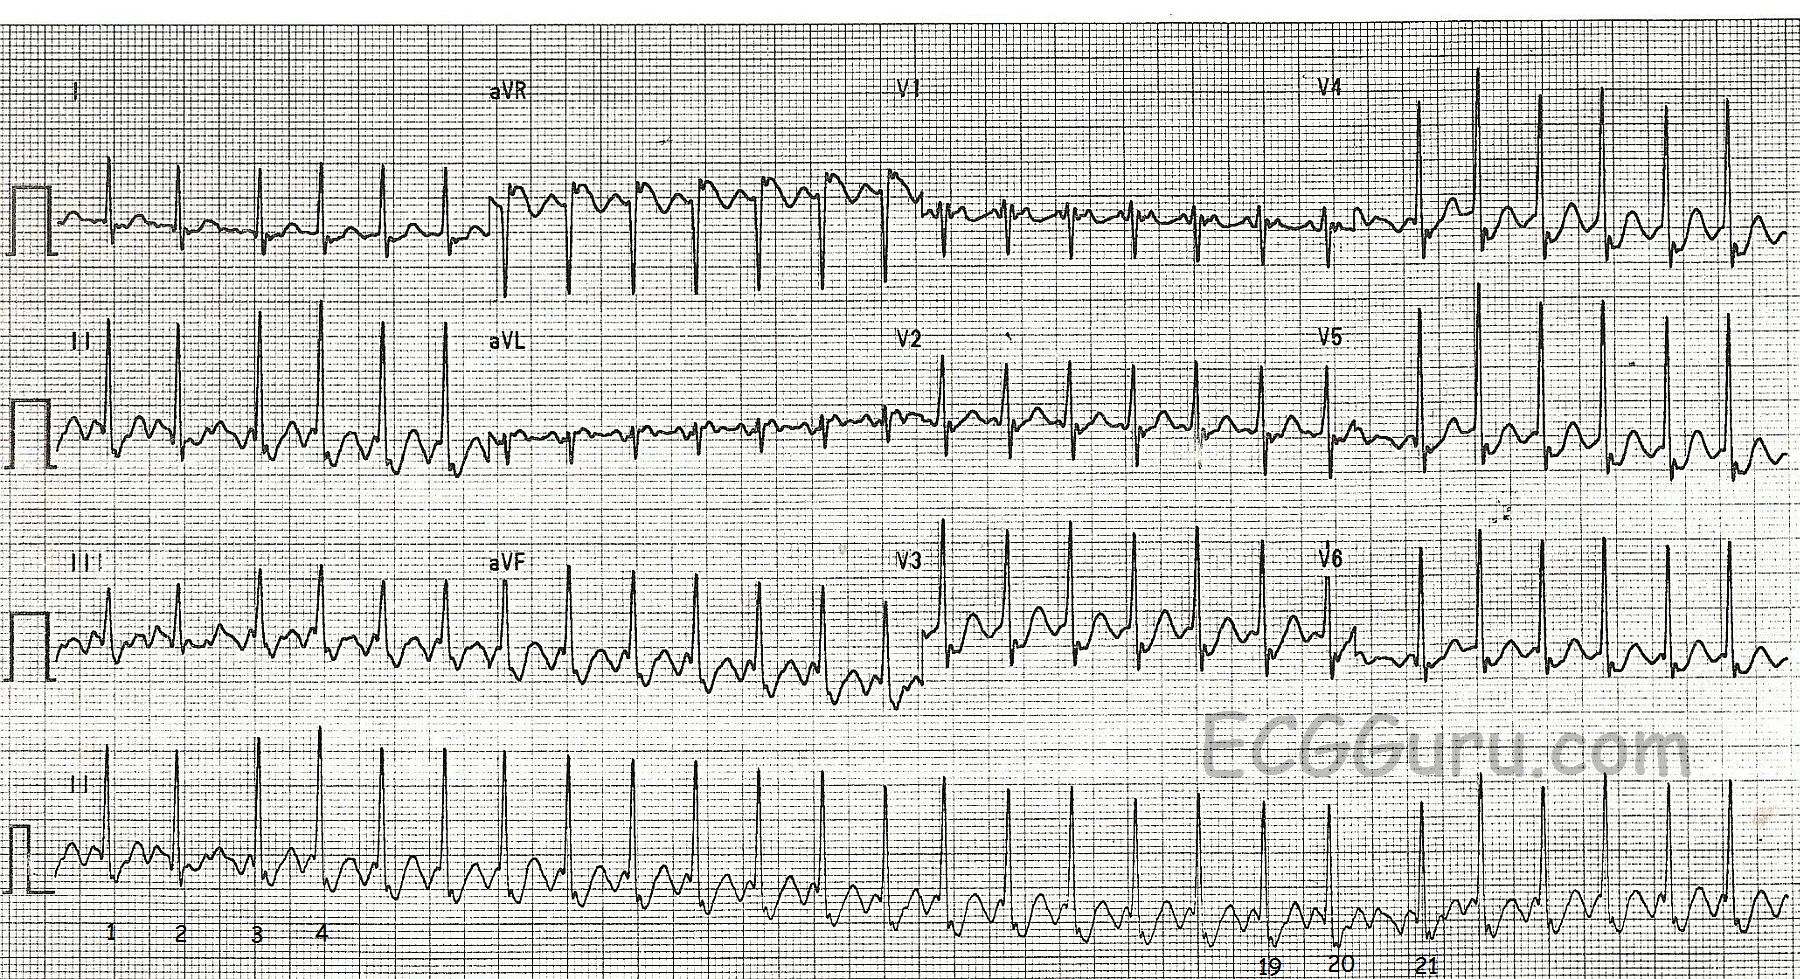
This is a single rhythm strip. It can be VERY helpful to look at multiple leads to look for flutter waves. See this week's Instructors' Collection ECG of the WEEK for the SAME patient's 12-Lead ECG. Also, your students should be reminded that sinus rhythms, including sinus tach, tend to change rates based on the needs of the patient. For example, as a patient is treated for his/her condition, the rate may improve by slowing. Conversely, if the condition becomes worse, or the patient is stressed, the rate may increase. Atrial flutter, like all re-entry tachycardias, tends to stay at a steady rate unless the conduction ratio changes.
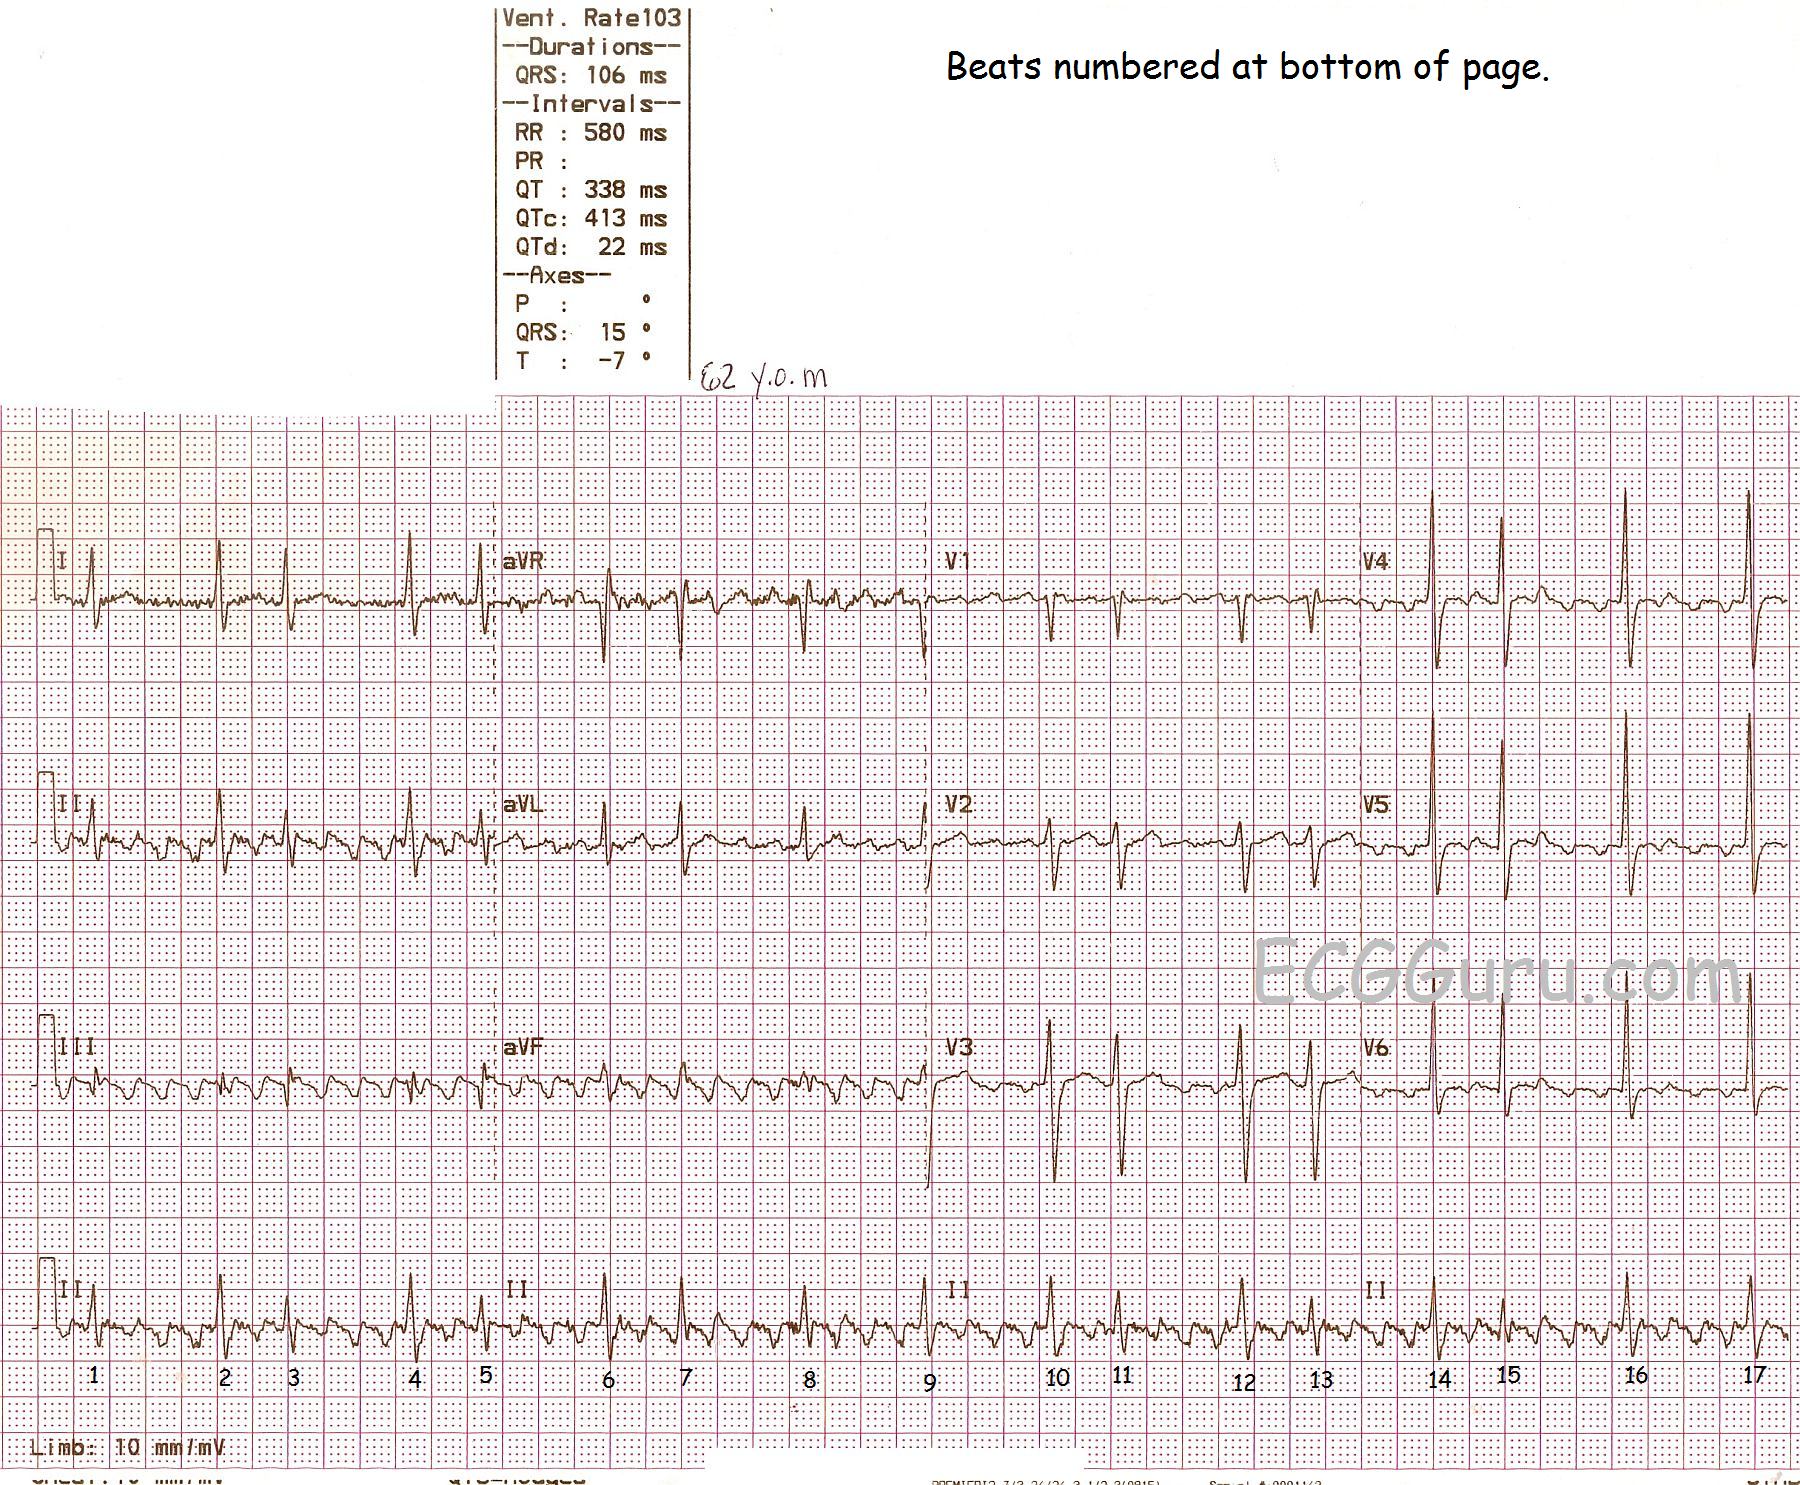
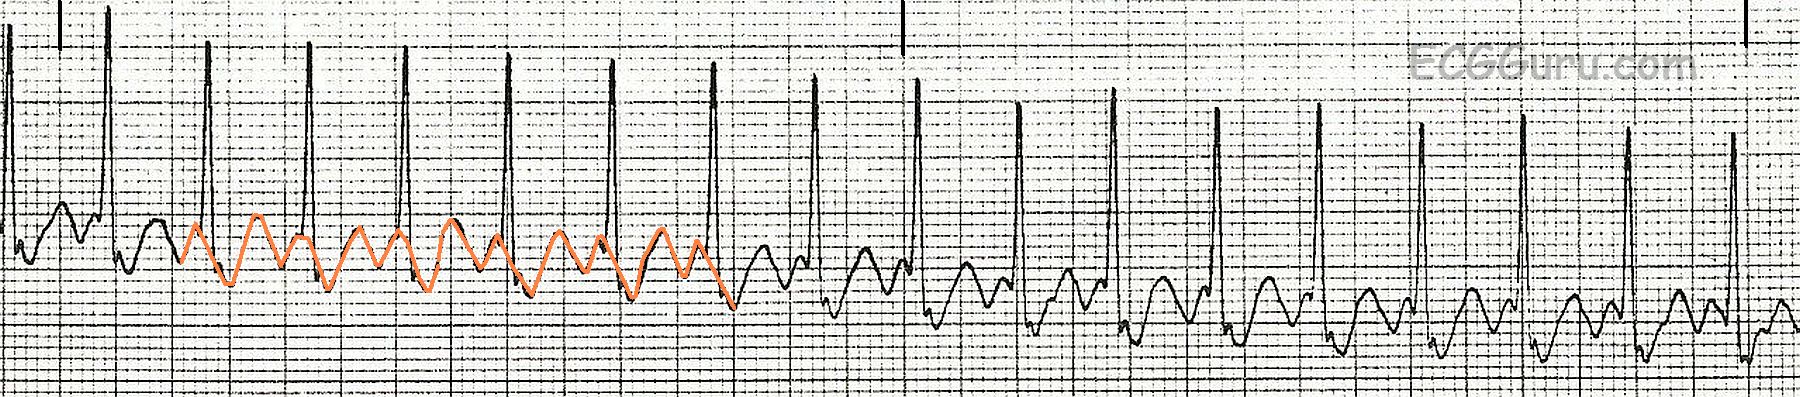
Show your students that the flutter waves are CONTINUOUS. That is, they don't pause for the QRS. The second illustration shows the flutter waves highlighted, to aid in seeing the continuous line of flutter waves.