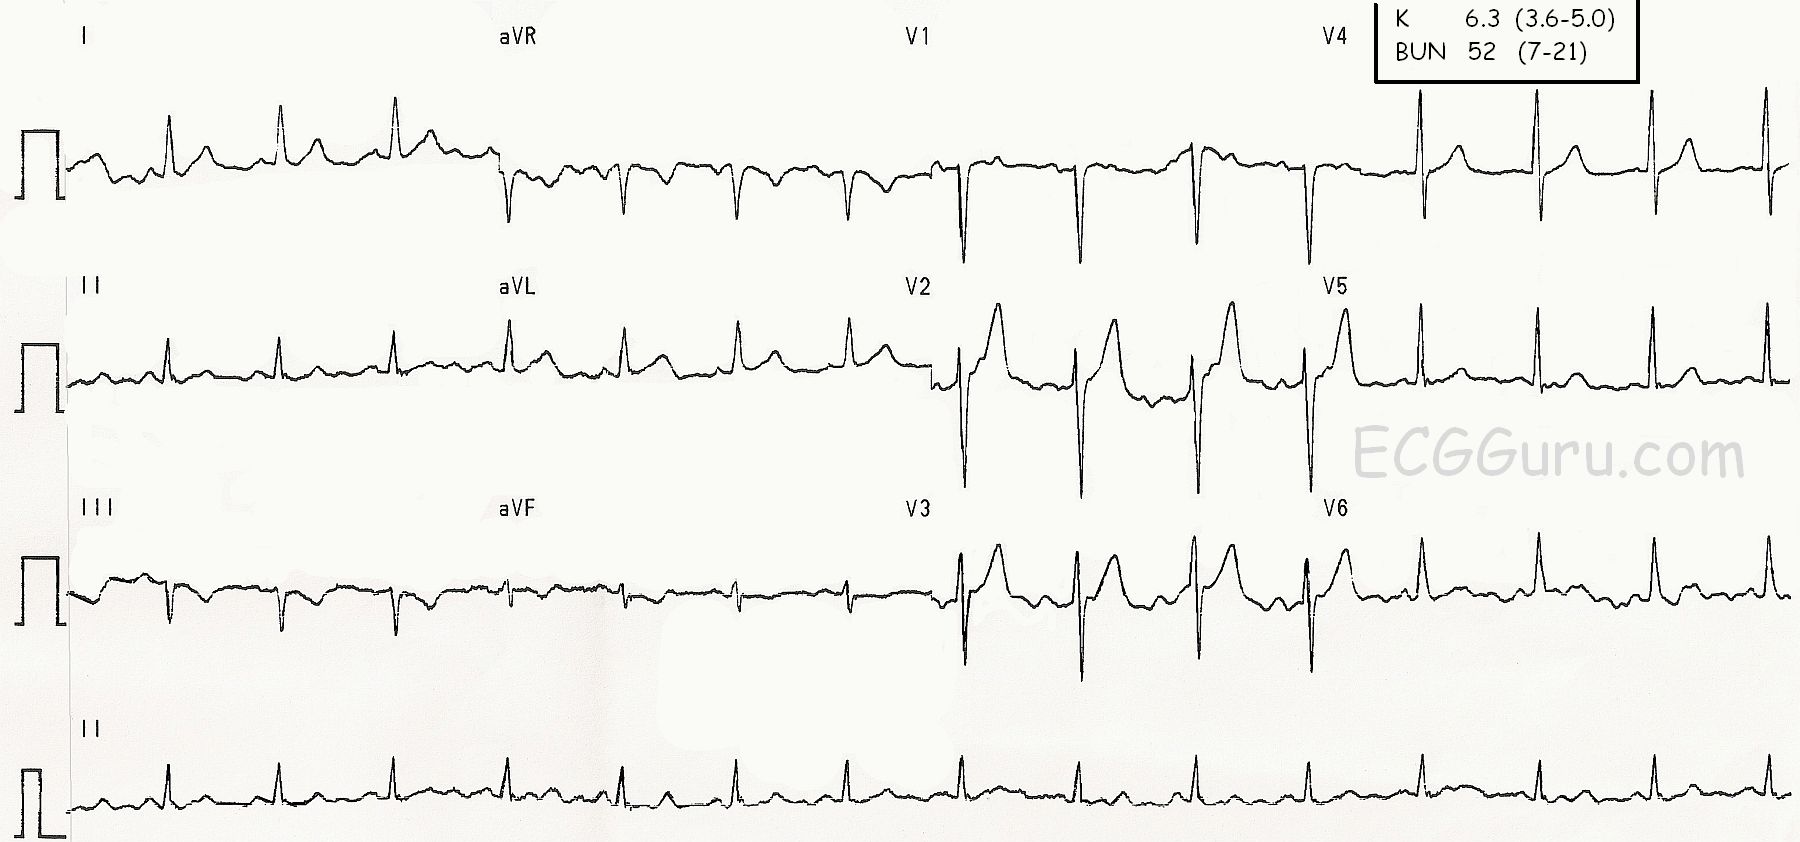
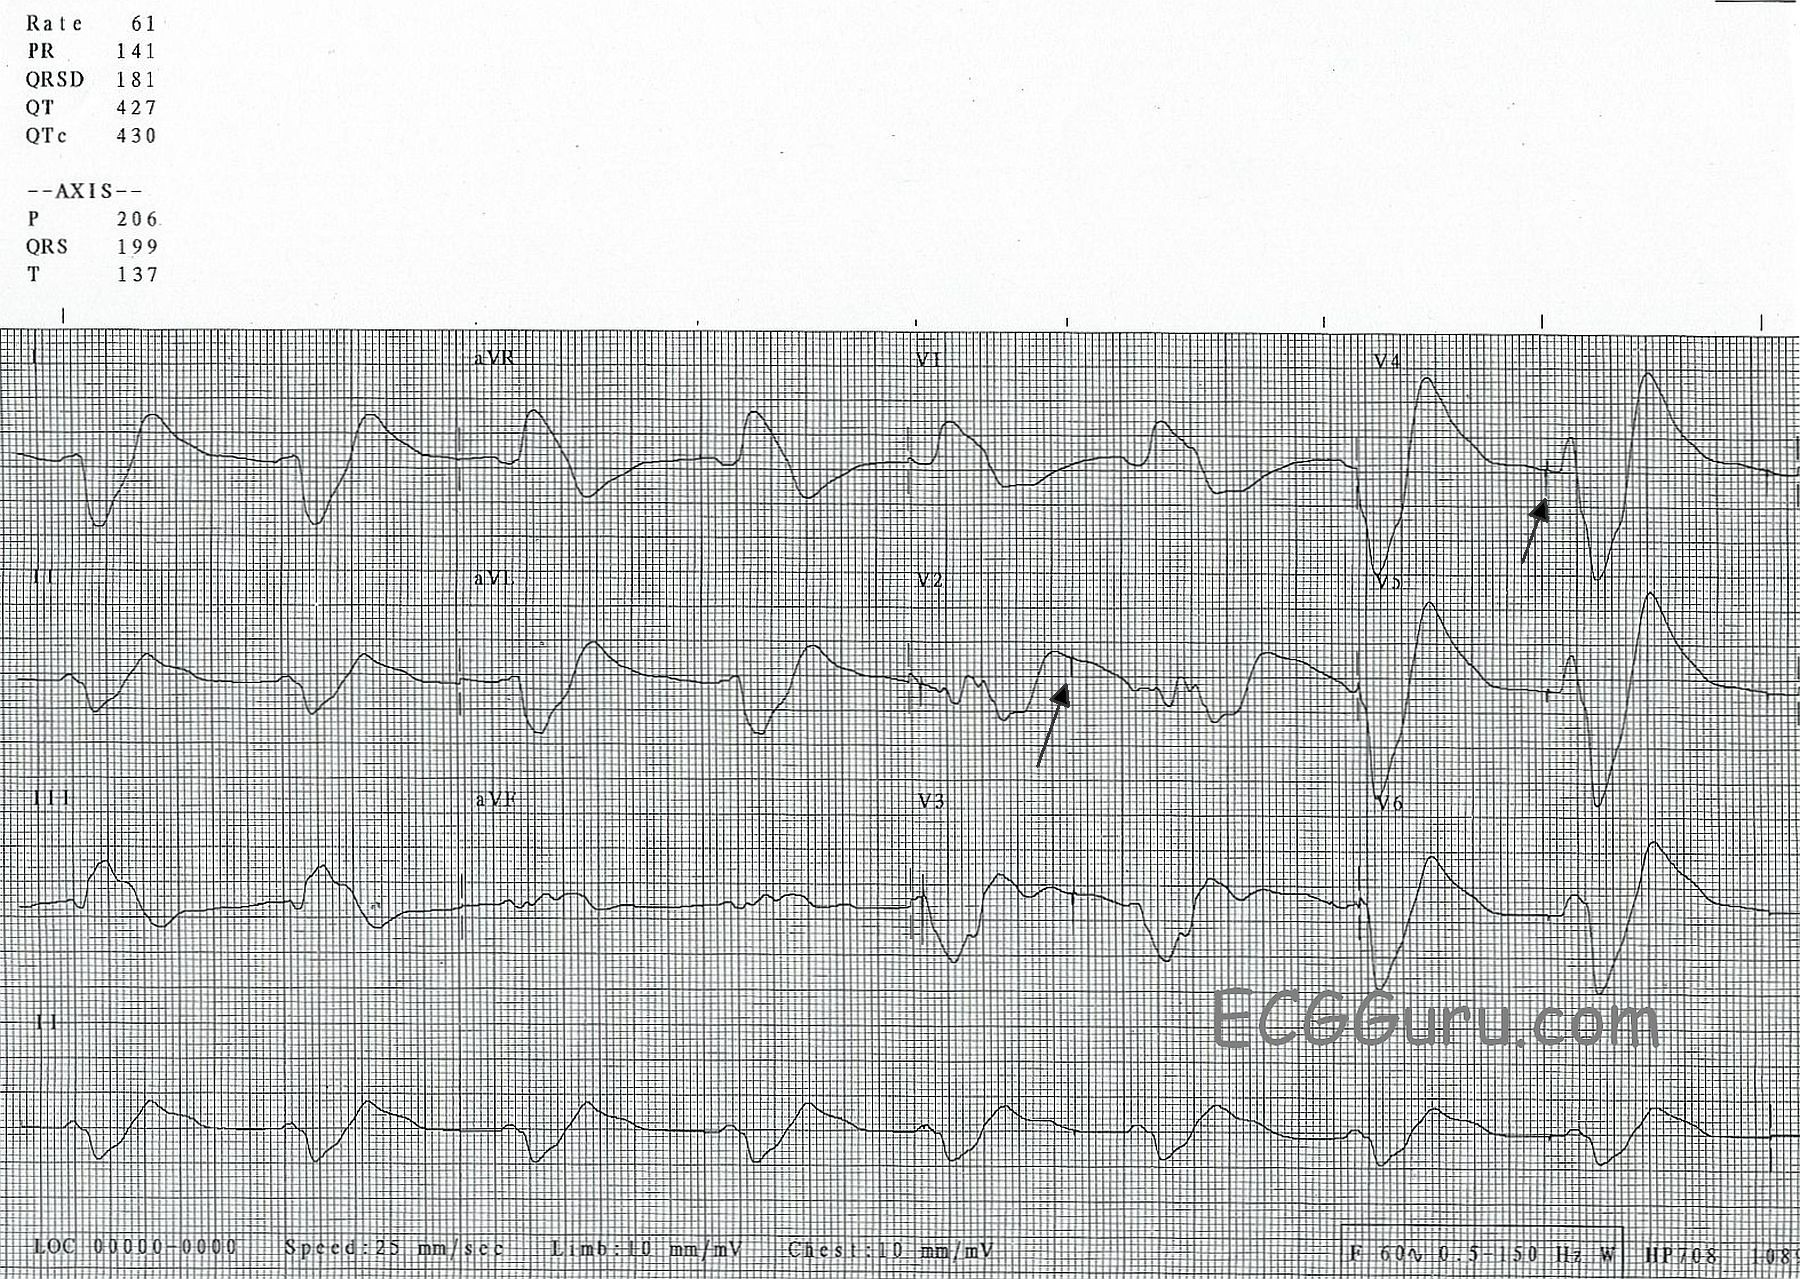
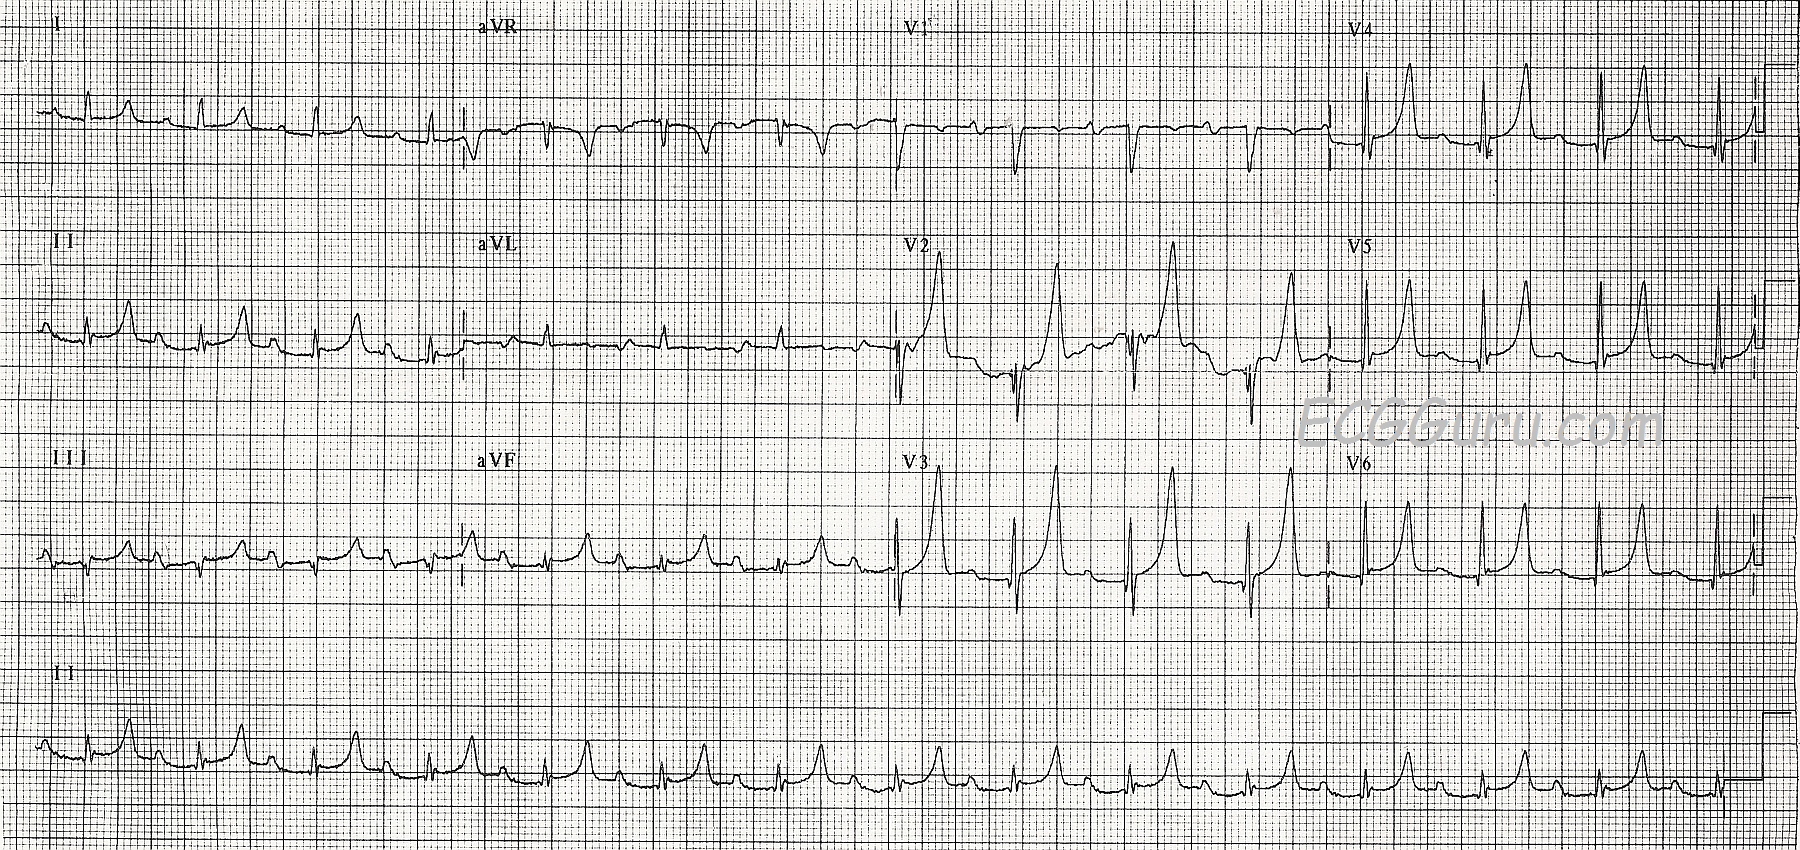
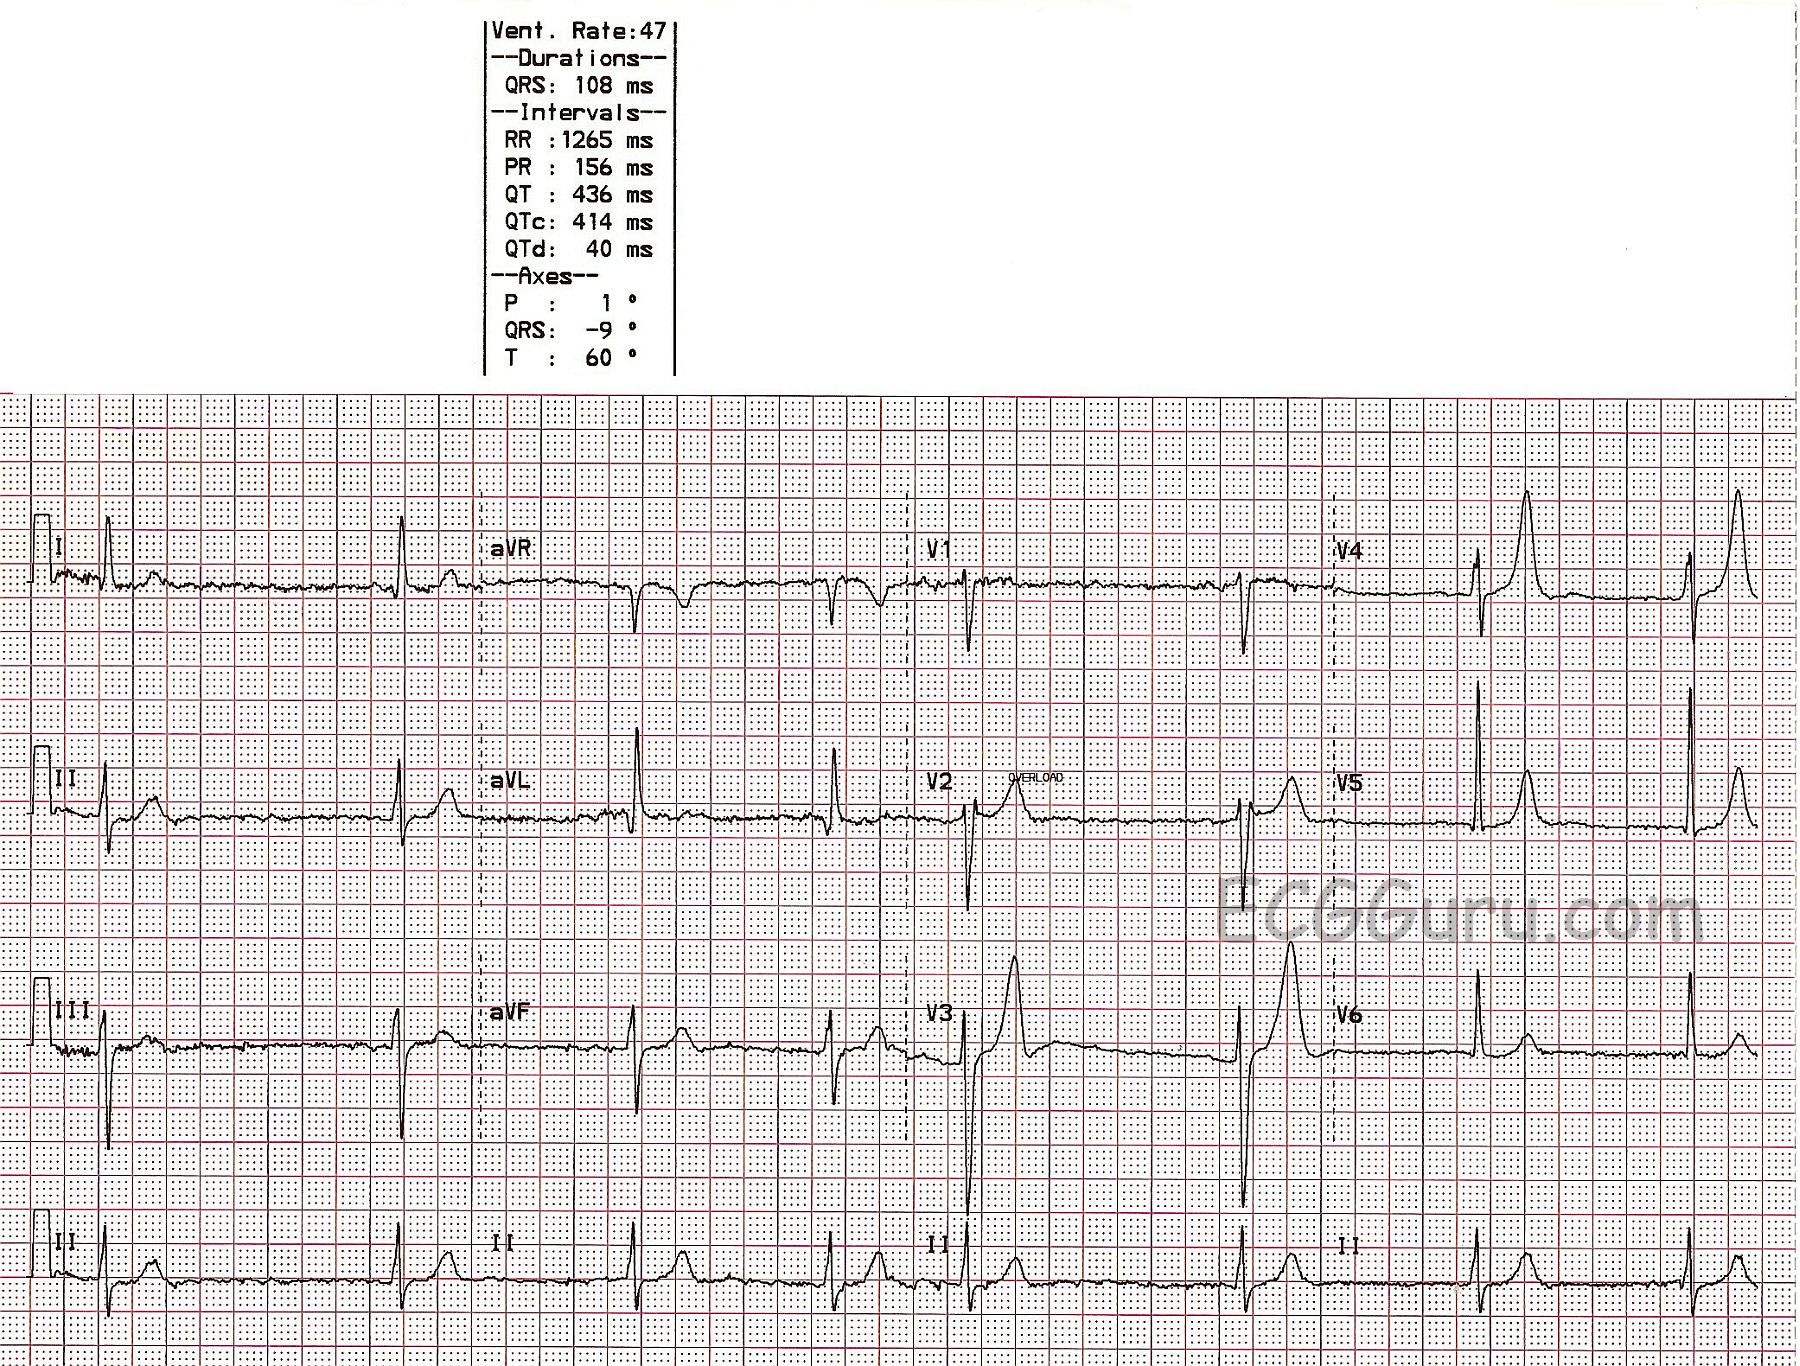
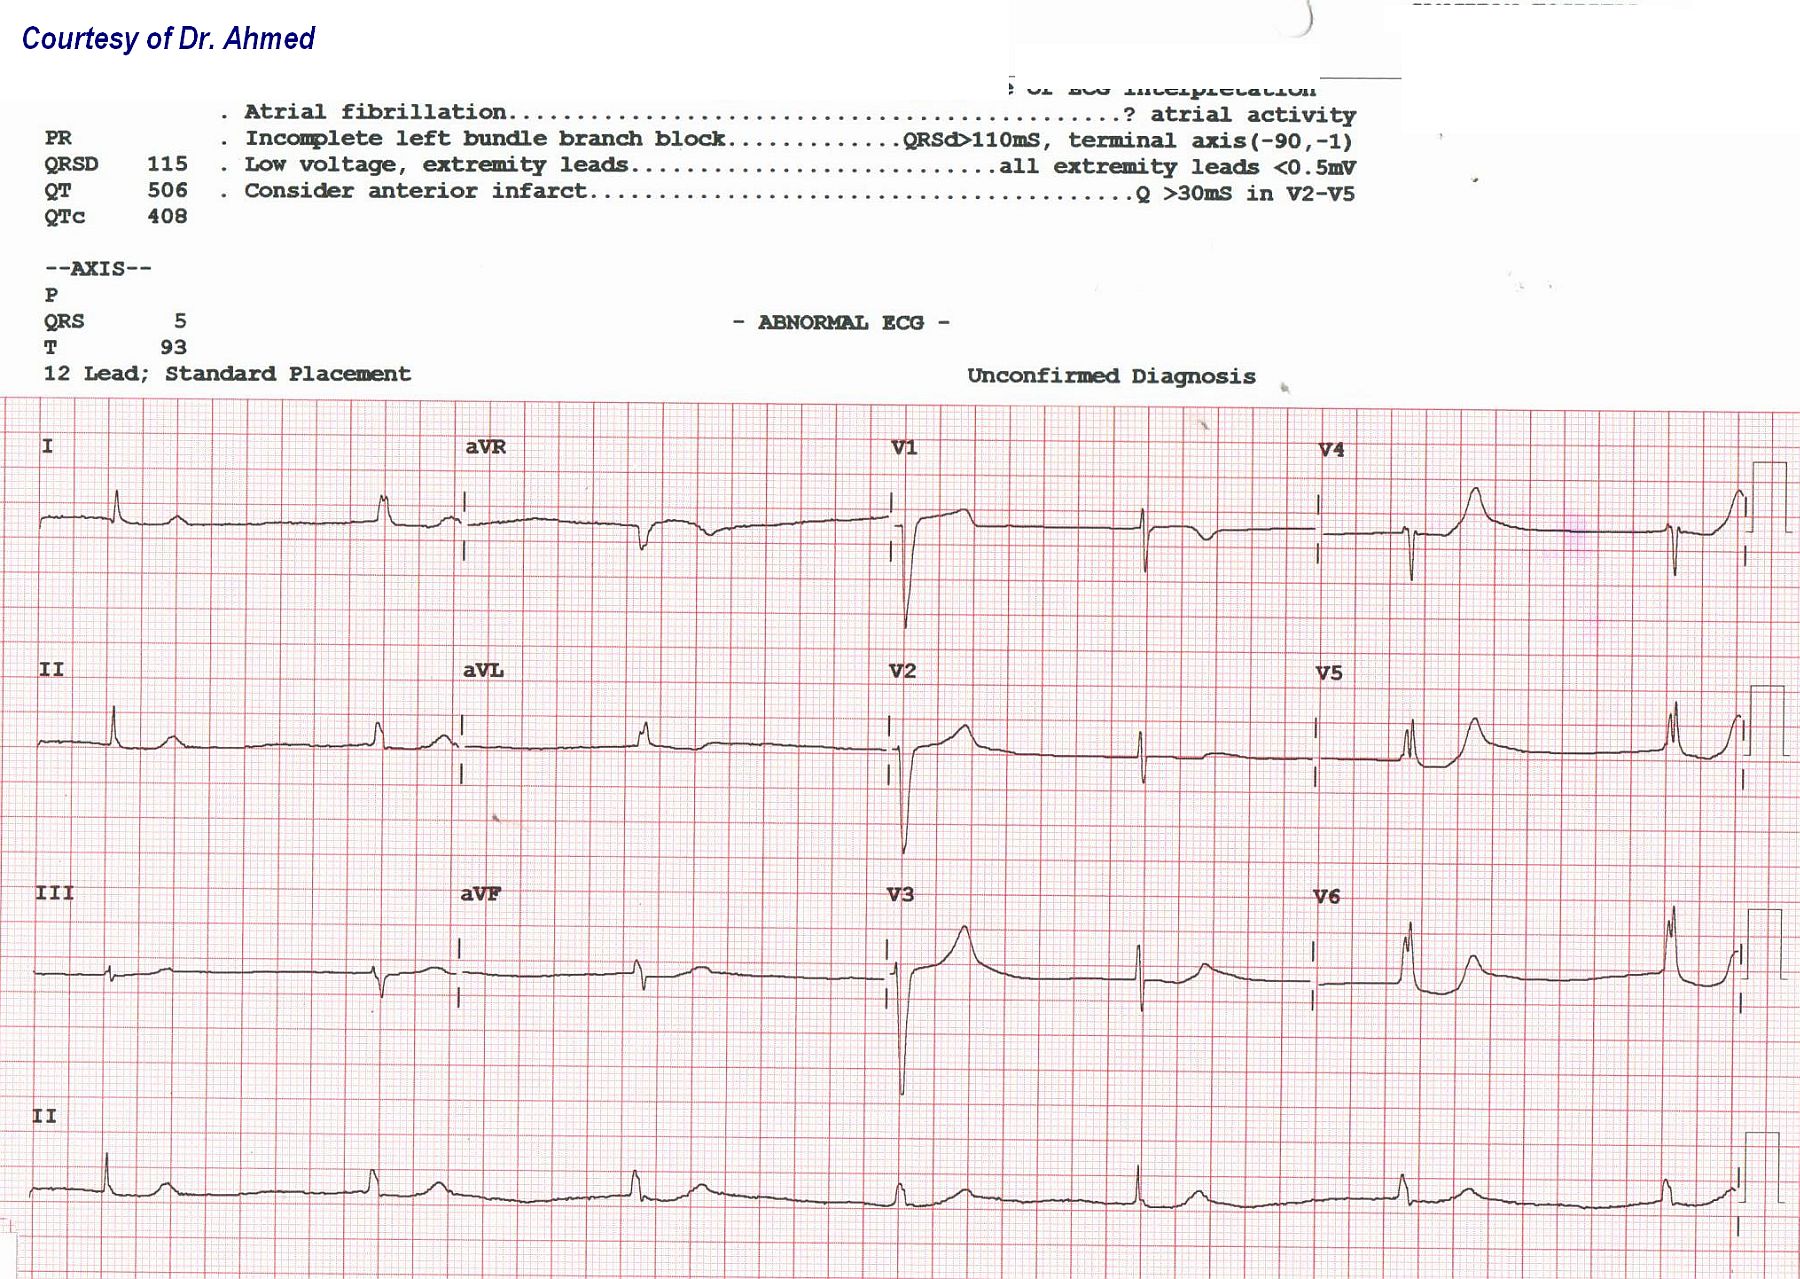
This ECG was obtained from a patient who was suffering from renal failure and had a serum potassium level of 6.8 mEq/L. It shows some of the earliest ECG signs of hyperkalemia. There are tall, sharply-peaked T waves in many leads. There is an irregular, bradycardic rhythm. We can just barely see P waves, but they will soon flatten out and disappear. At this level of hyperkalemia, we can expect to see conduction disturbances and bradycardia. Caution: hyperkalemia can progress and become life-threatening very quickly.
Potassium is primarily an intracellular electrolyte. It is necessary for proper electrical functioning of the heart. Extracellular serum potassium can rise due to renal failure, or taking potassium supplements, potassium-sparing diuretics, or ACE inhibitors.
ECG signs may vary among people with hyperkalemia, but in general:
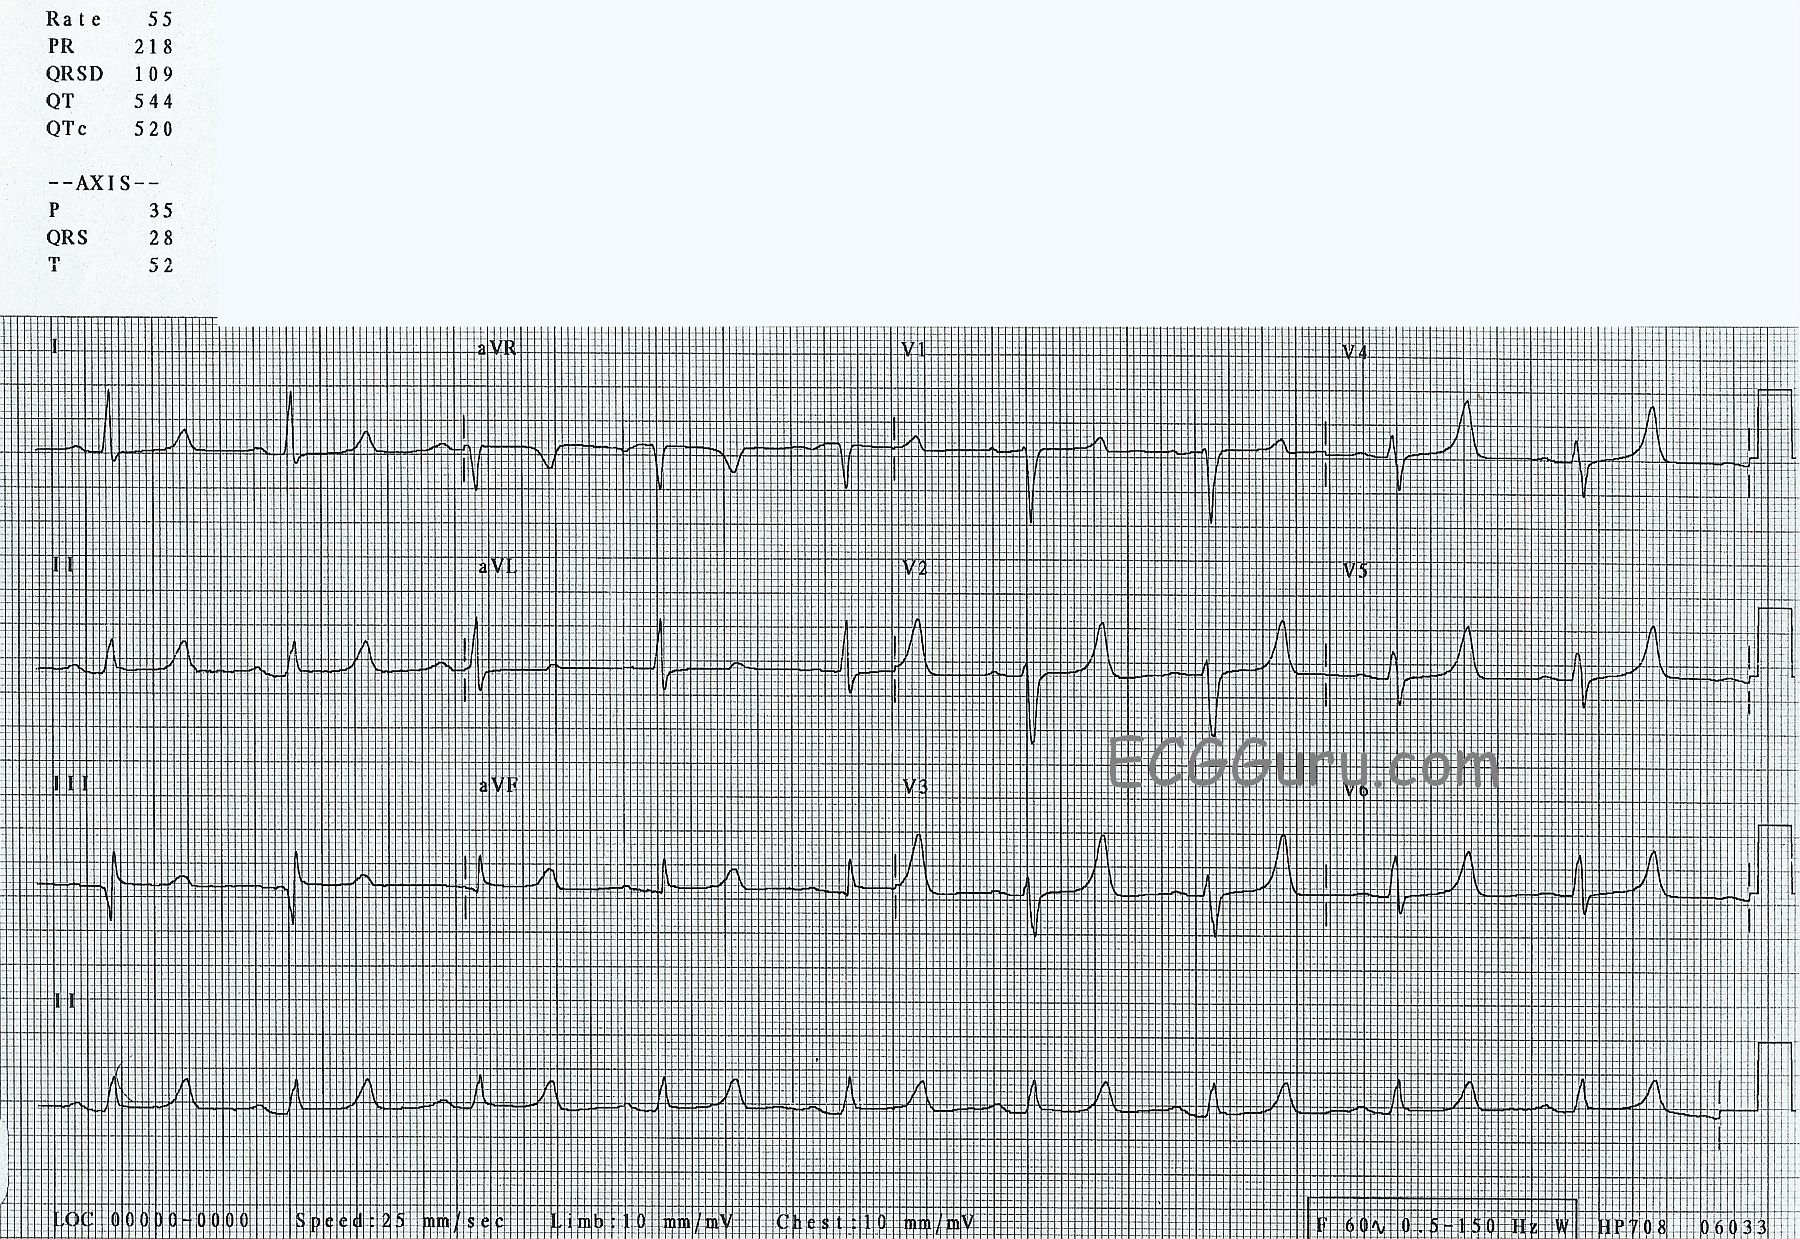
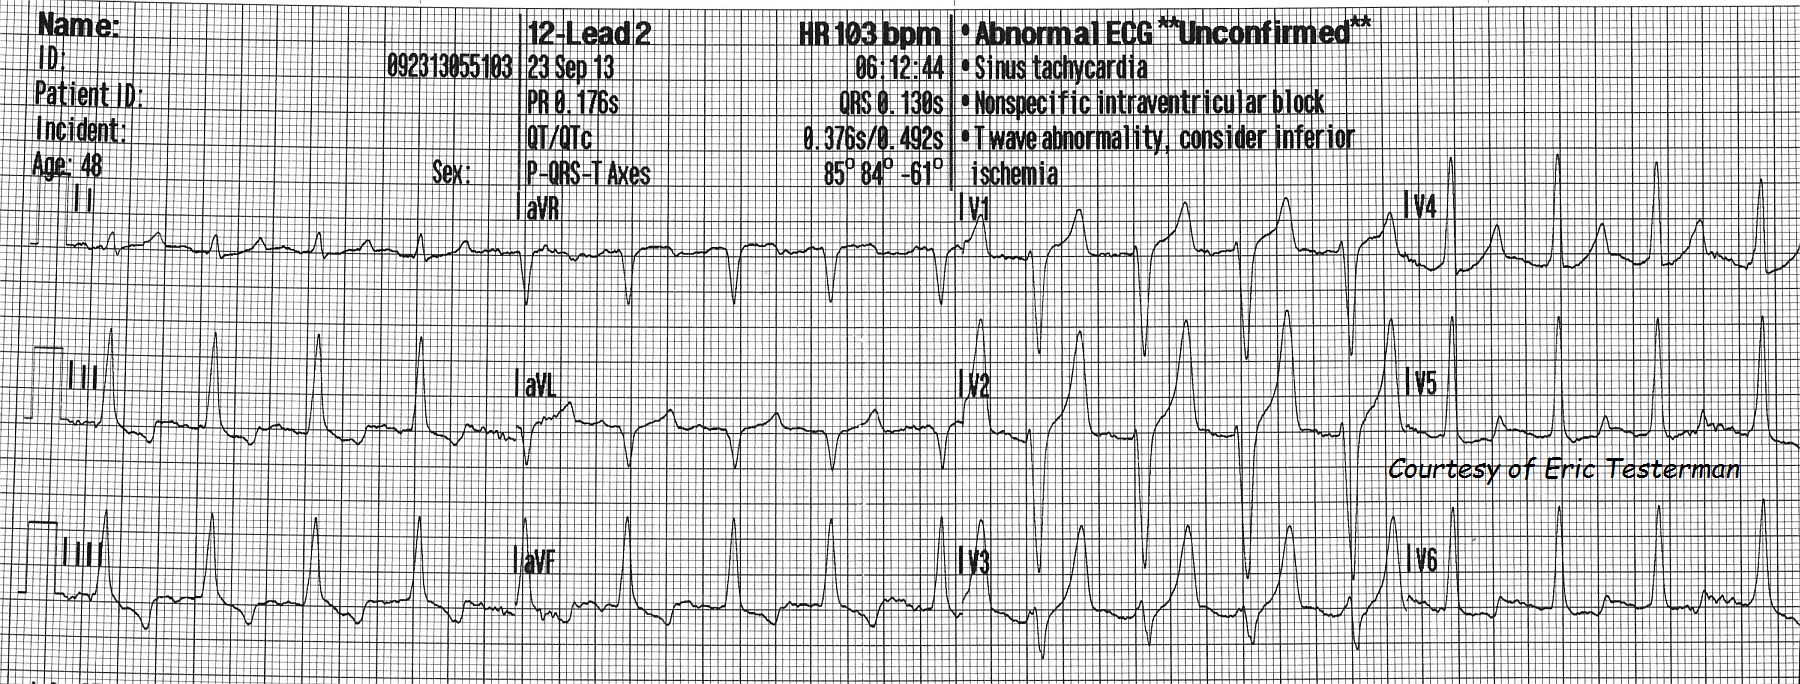
Serum K levels of 5.5 mEq/L or greater can cause repolarization abnormalities like tall, peaked T waves.
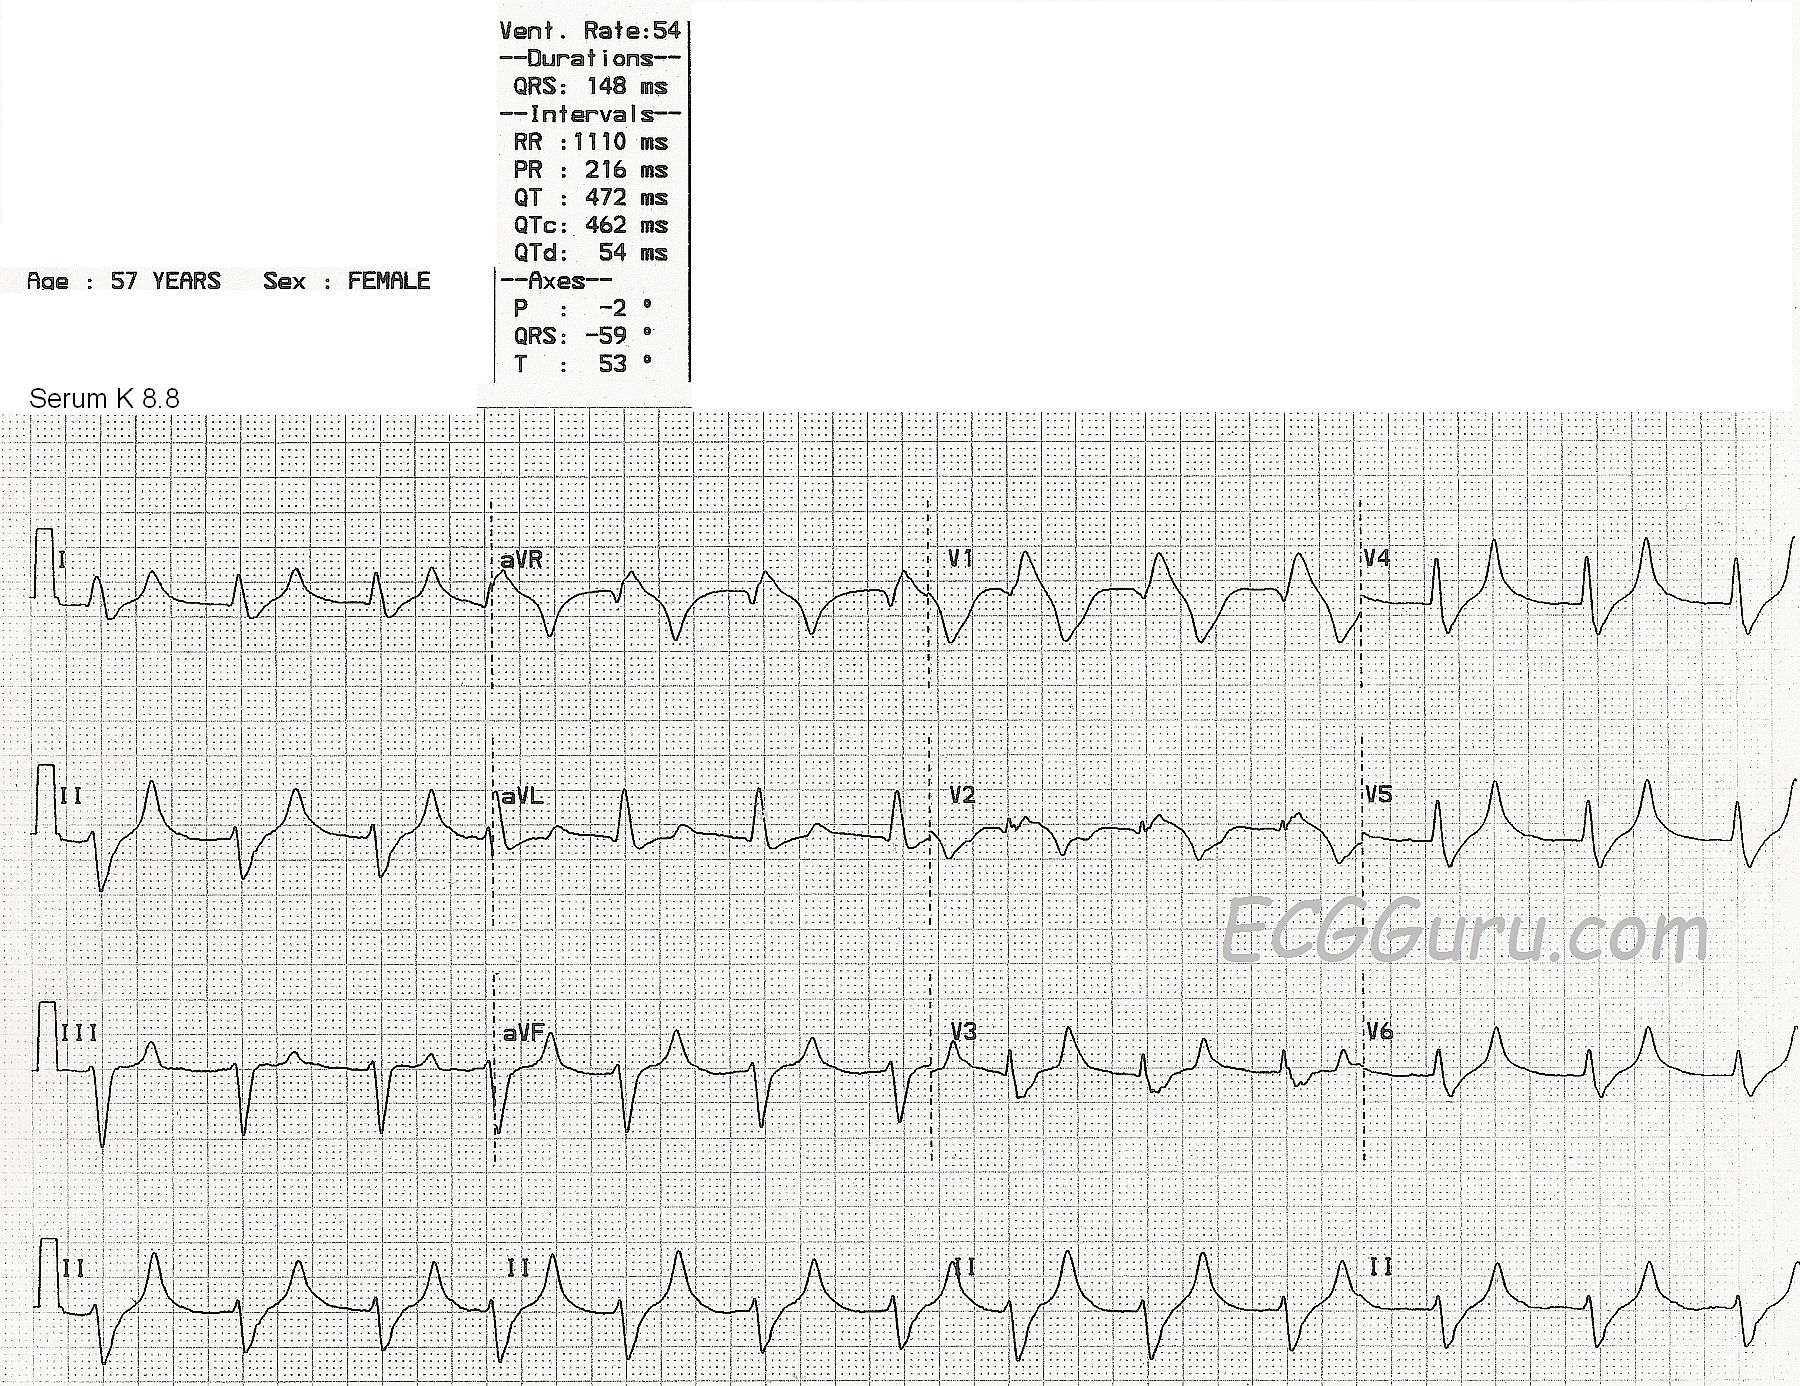
Serum K levels of 6.5 mEq/L or greater cause progressive paralysis of the atria. The P waves will lose amplitude, widen and flatten. The PR segment will lengthen. Eventually, the P waves will disappear.
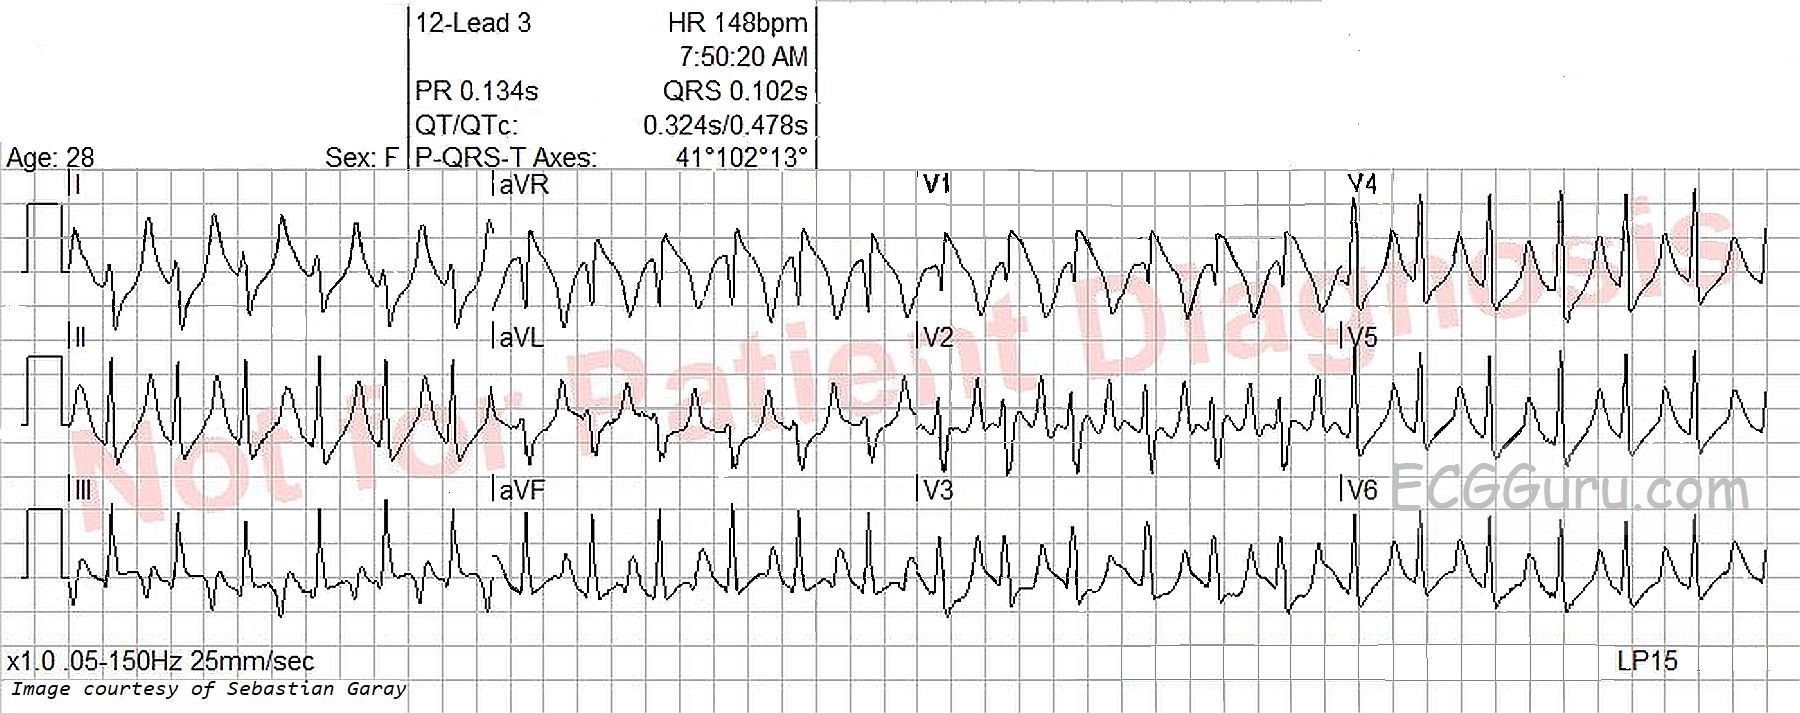
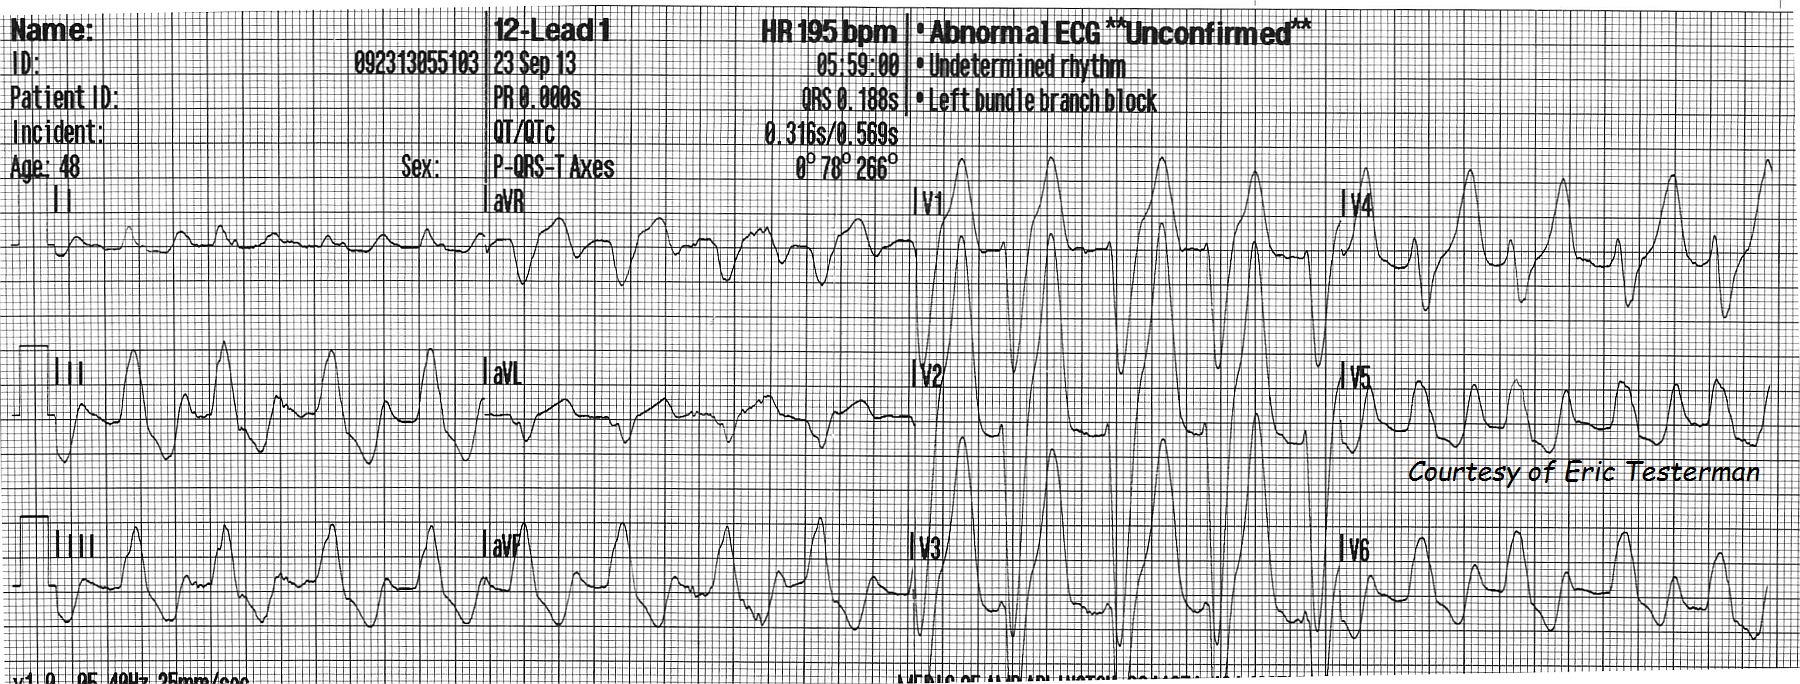
Serum K levels of 7.0 mEq/L or greater cause conduction abnormalities. The QRS will widen and the rate will slow. There may be bundle branch blocks or fascicular blocks. The QRS morphology will be bizarre - not necessarily showing a typical bundle branch block pattern. AV blocks may occur, with either ventricular or junctional escape rhythms.
As the patient's condition worsens and the serum potassium rises, the QRS and T waves lose amplitude, widen, and may seem to blend together.
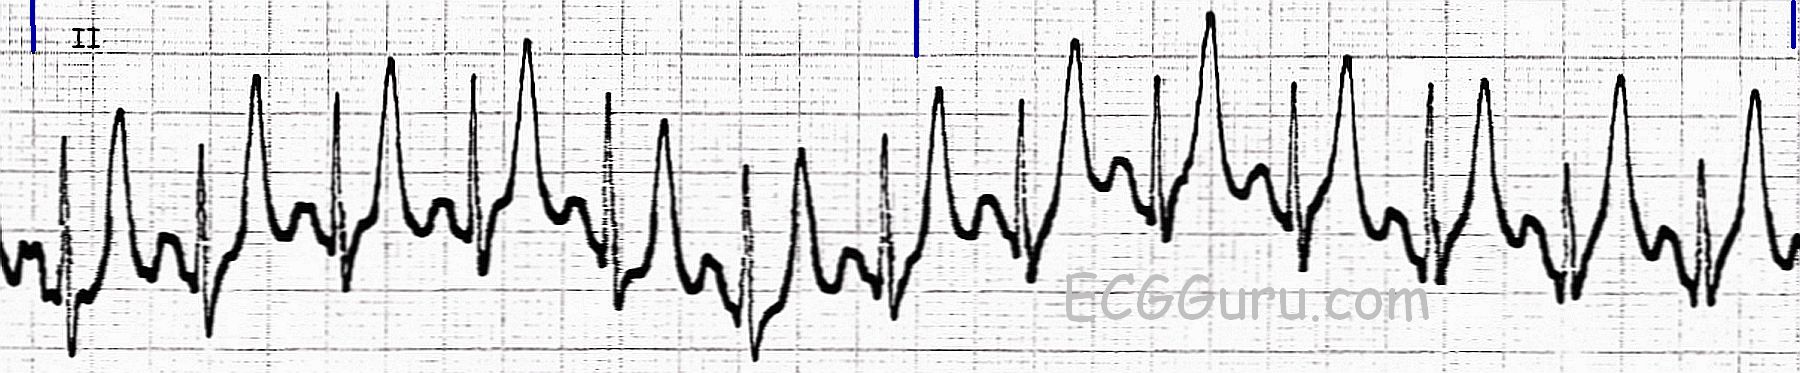
At levels above 8.0 mEq/L, we may see what looks like a bizarre idioventricular rhythm, or a sine wave pattern. This sine wave pattern signals cardiac arrest is imminent.
For a comprehensive discussion of hyperkalemia on the ECG with many examples of the different phases, go to Life In The Fast Lane. Ed Burns has compiled a very instructive collection of ECGs that illustrate the progression of this deadly condition.
Dr. Steve Smith's blog has several very good discussions on the subject. For a comparison of tall T waves caused by several factors, including hyperkalemia, go to Dr. Smith's Blog.
It is important the patient with hyperkalemia is treated rapidly, as it can be rapidly fatal.