A series of ECGs can be a valuable addition to any teacher's collection. This series follows a 75-year-old woman through three days, during which she experienced an acute anterior wall M.I., a catheterization with angioplasty and stents placement.
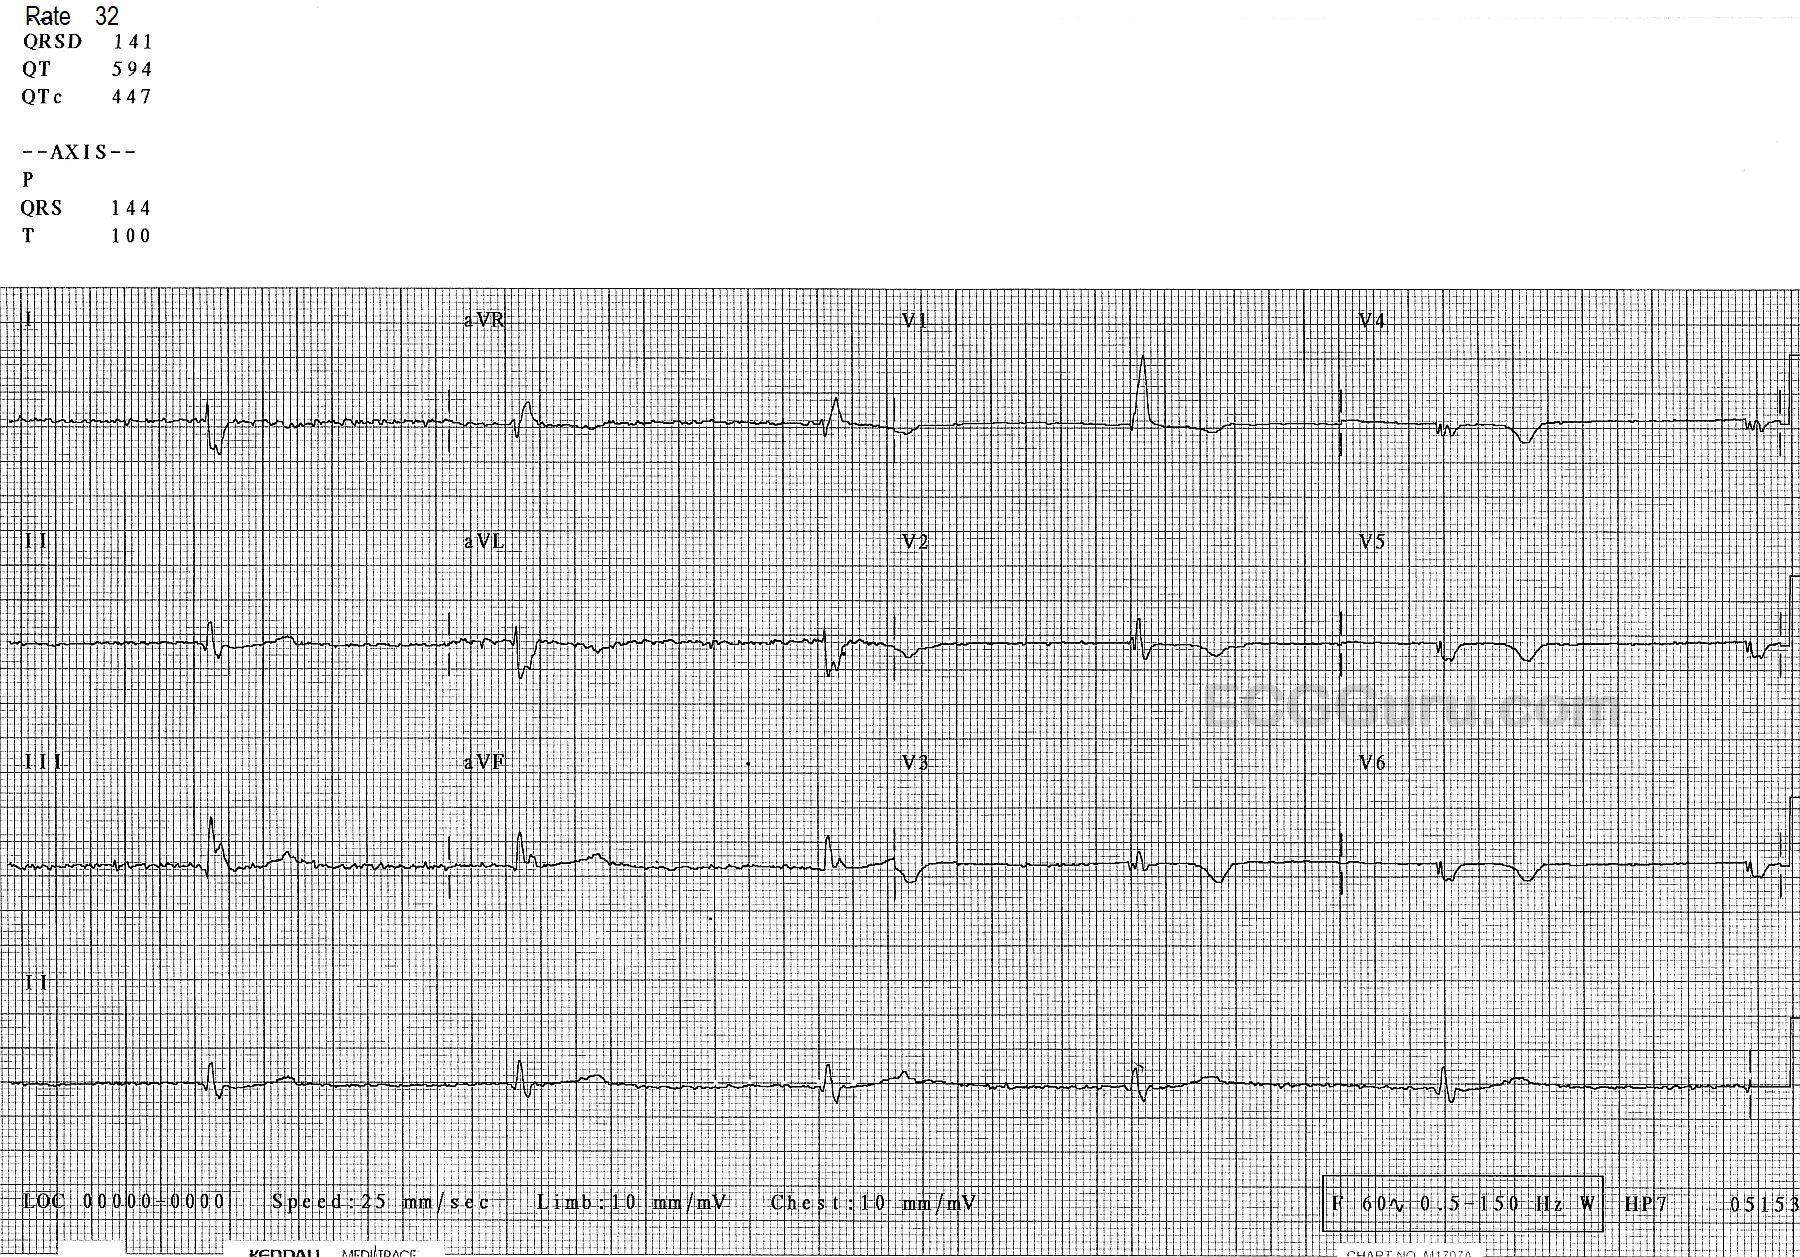
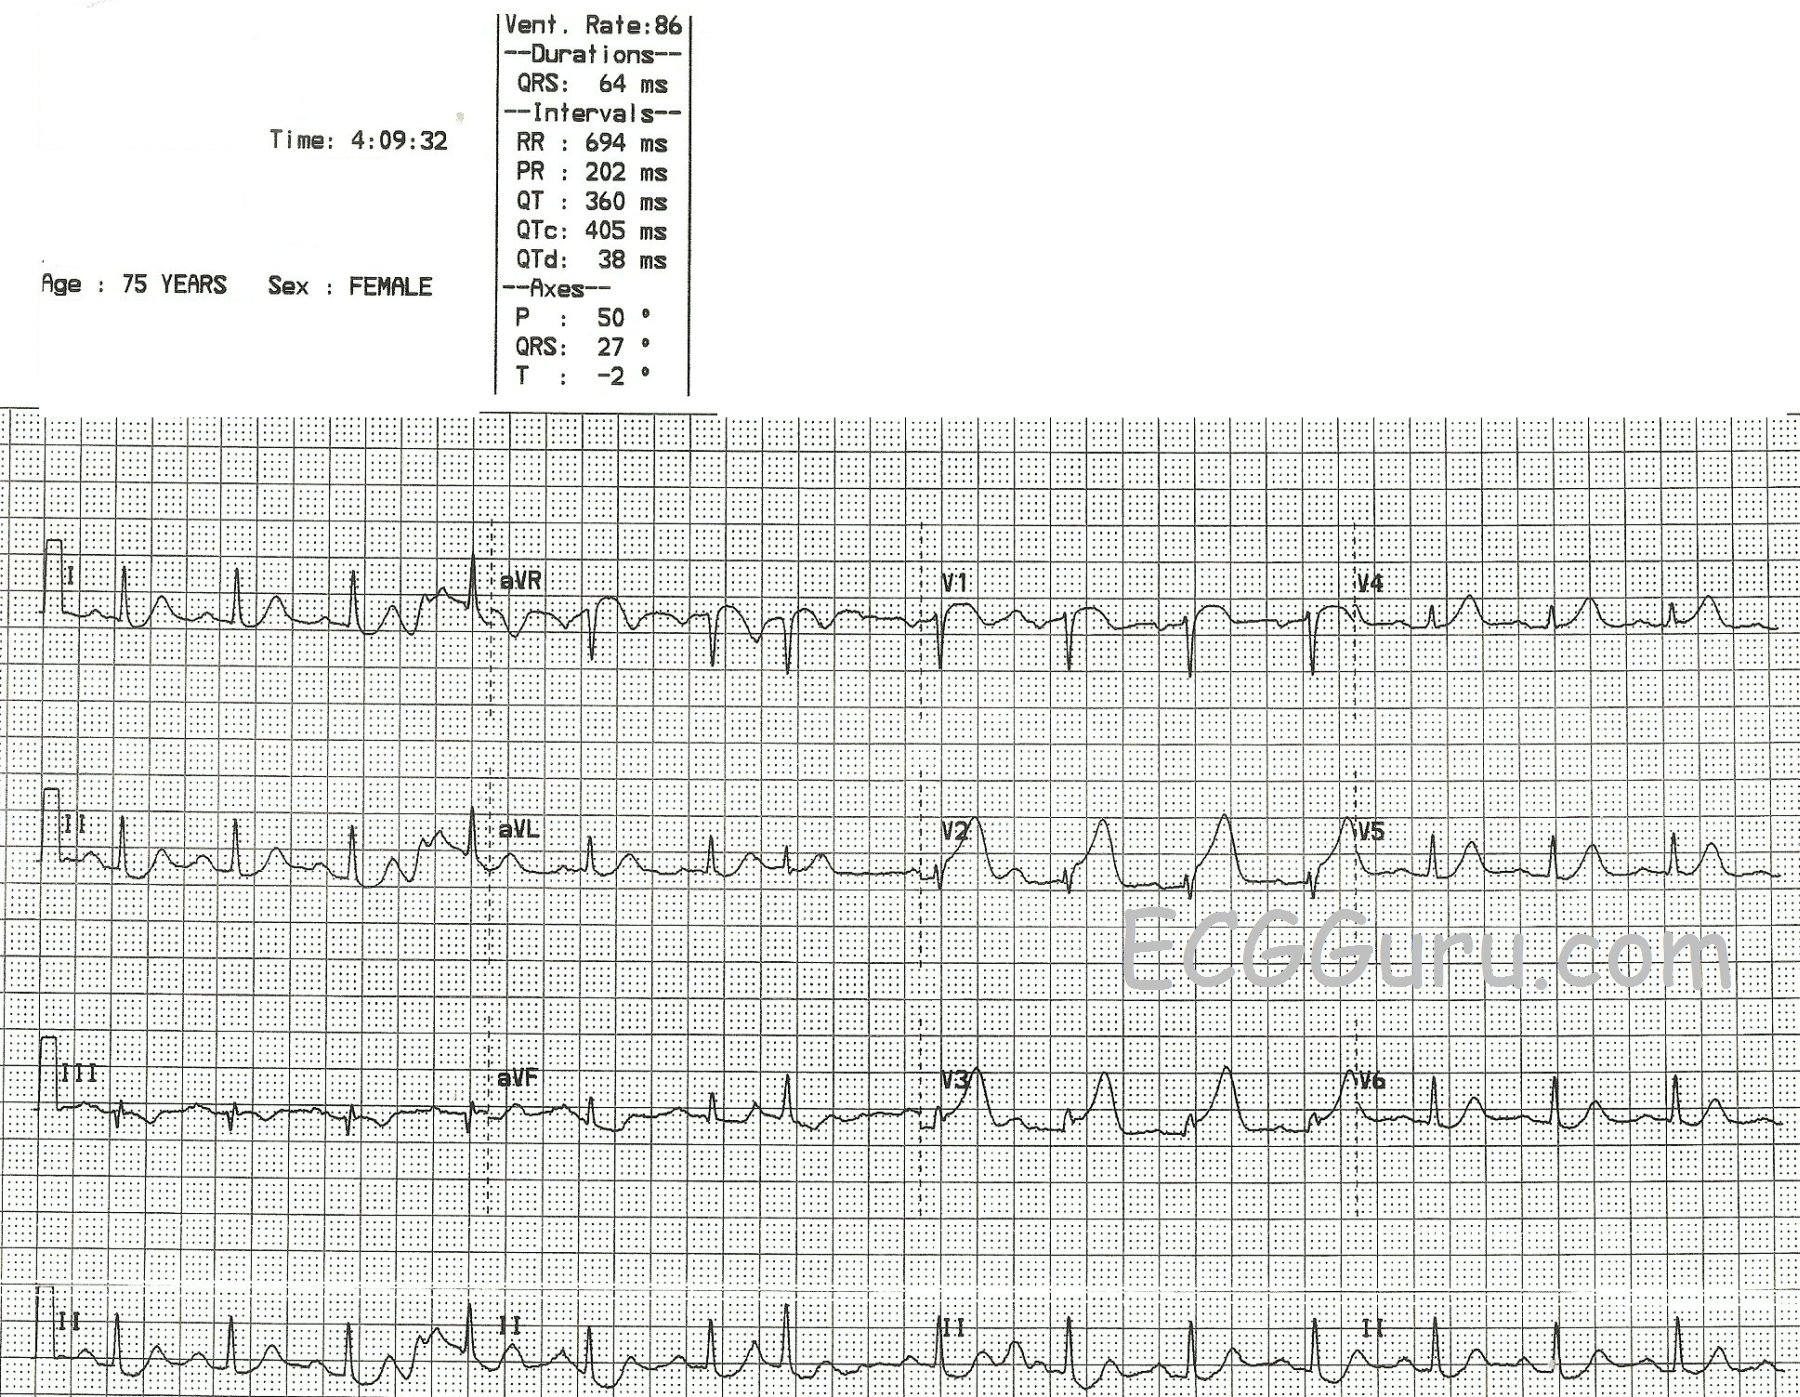
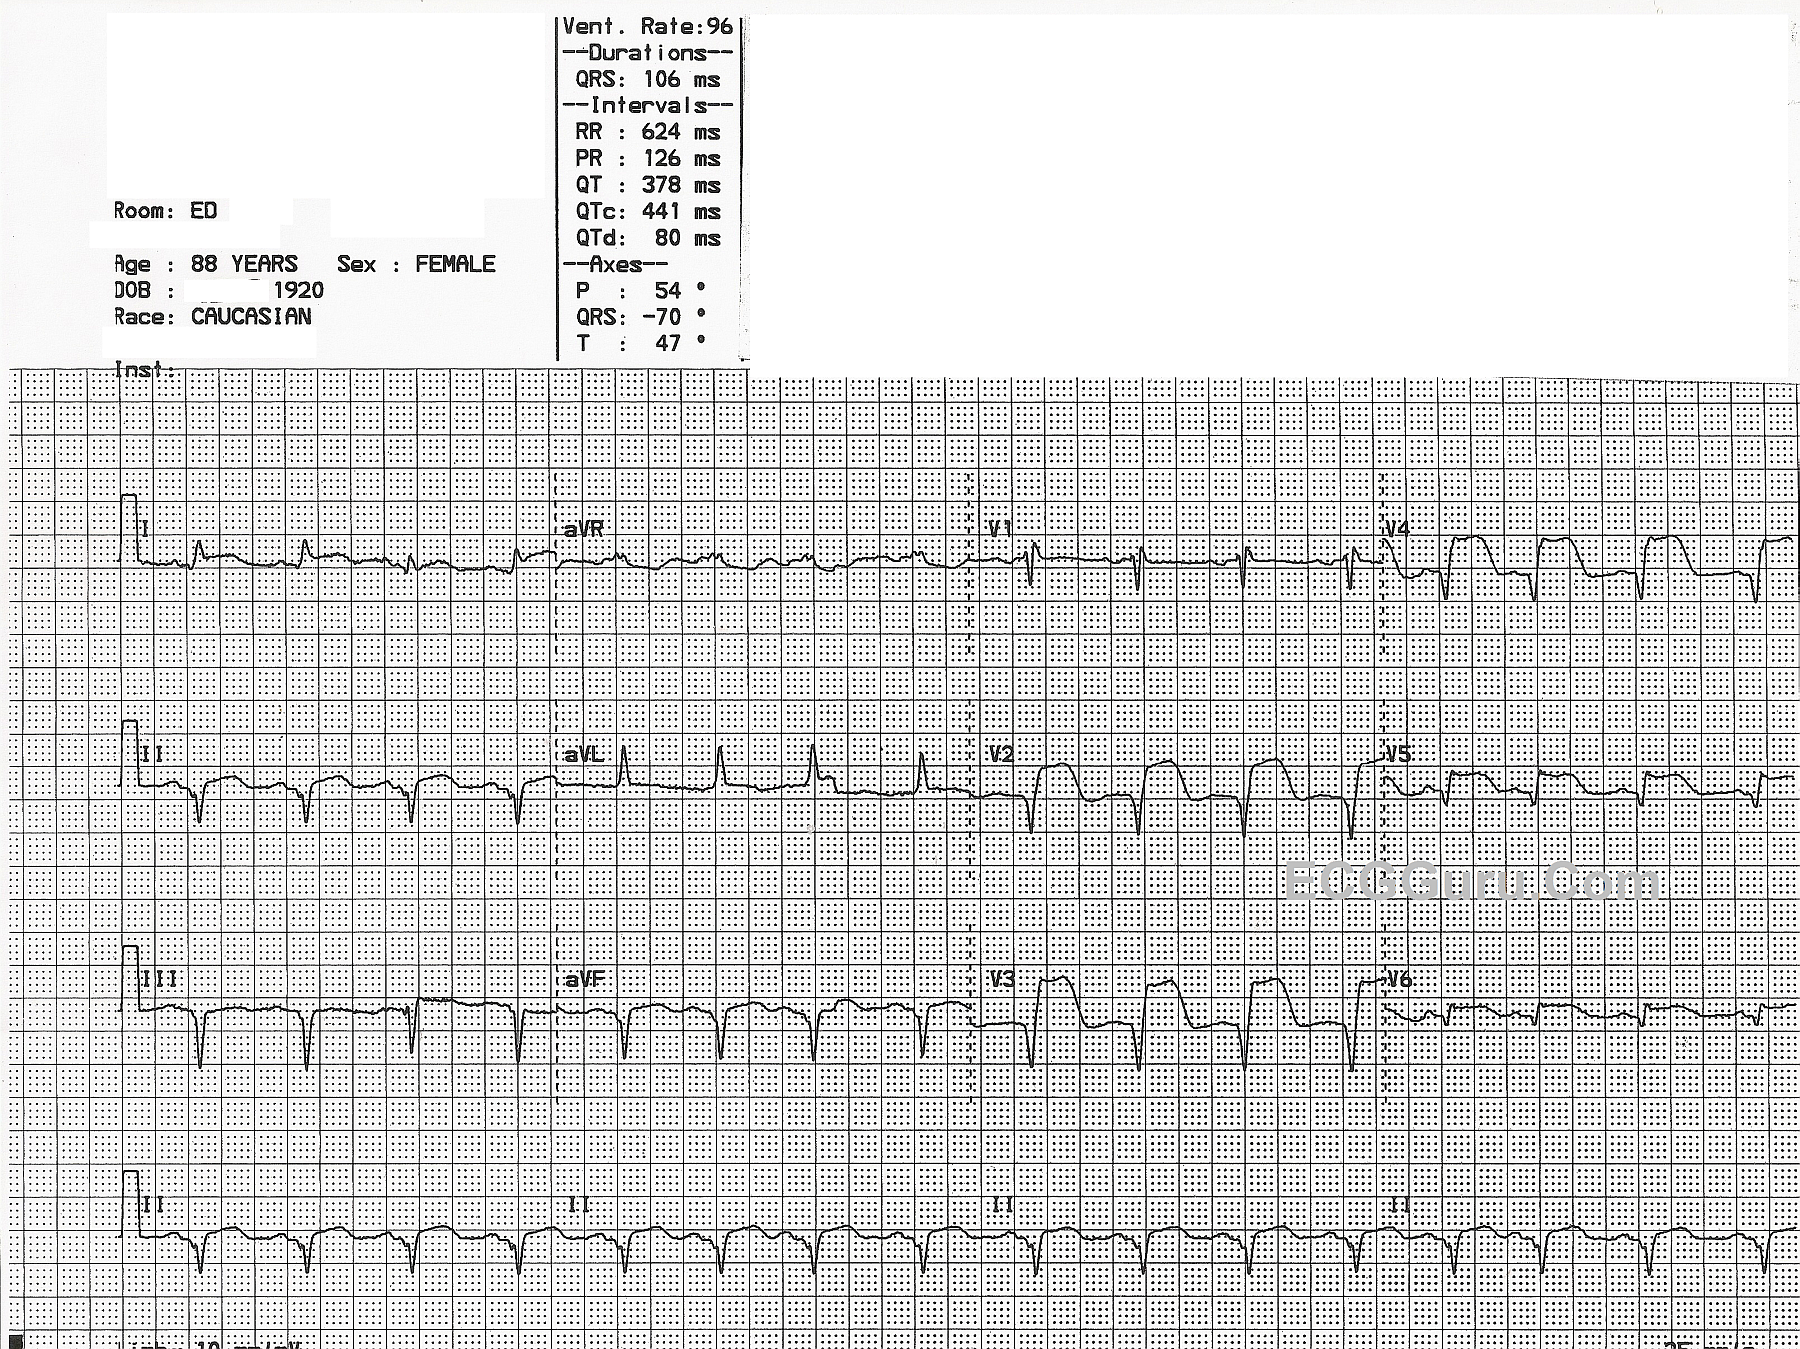
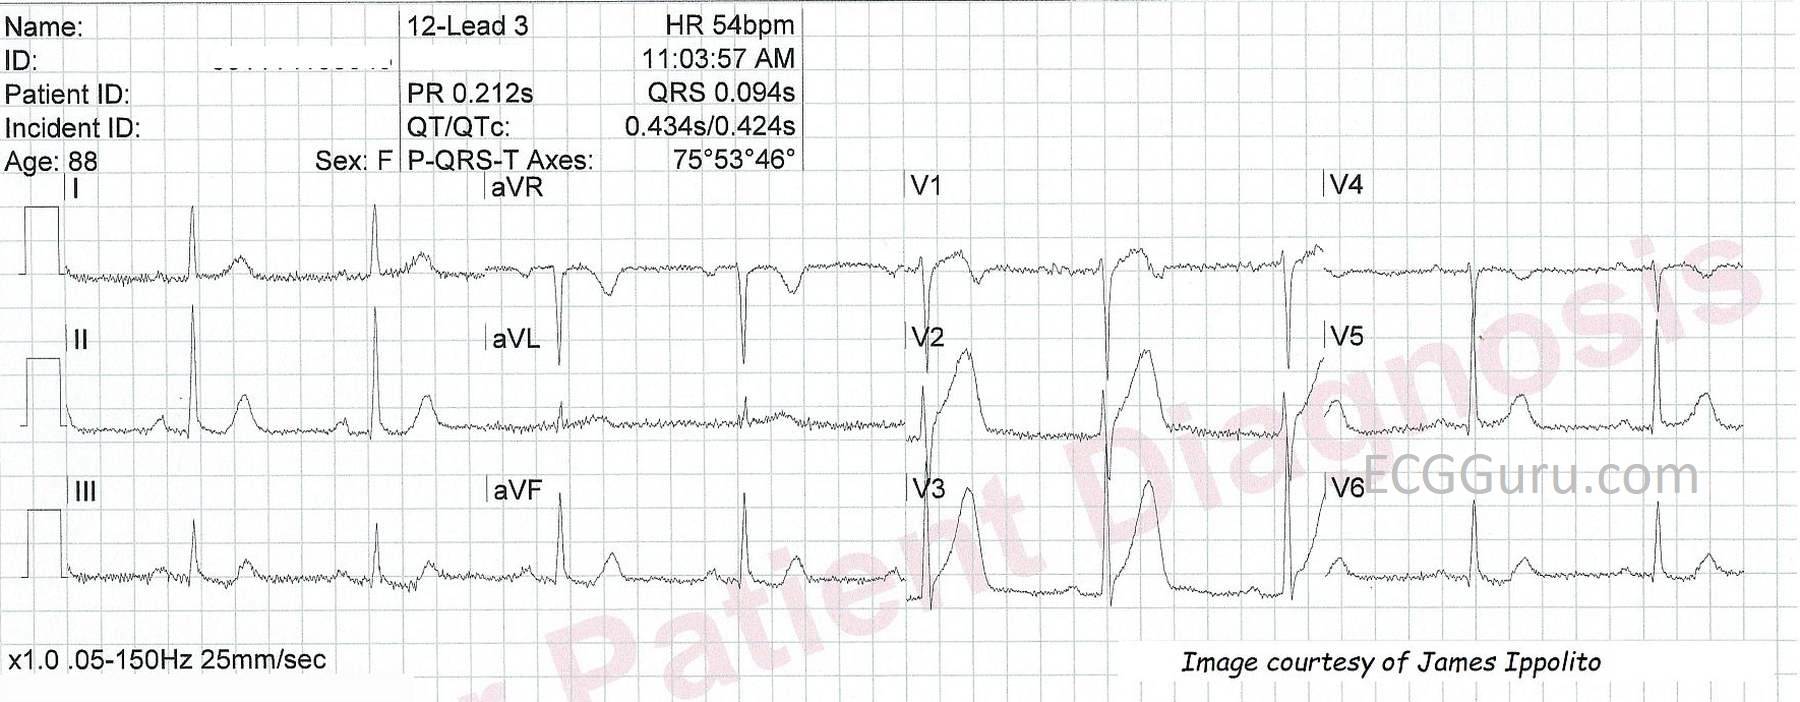
In the first ECG, taken at 4:09 am, the patient has presented to the Emergency Dept. with a complaint of chest pain. (Other details are no longer available). Although there is some baseline artifact, it appears that the rhythm is sinus rhythm with one PAC (7th beat). There is subtle but measurable ST elevation in V1, V2, and V3 (anterior-septal leads). The shape of the STE in V1 is noticeably coved upward. Even aVR has some STE, with coving. There is equally subtle ST depression in Leads II, III, and aVF (inferior leads). Fortunately, there are no pathological Q waves at this point, which would be an indication of necrotic tissue in the area of the M.I. (anterior-septal wall).
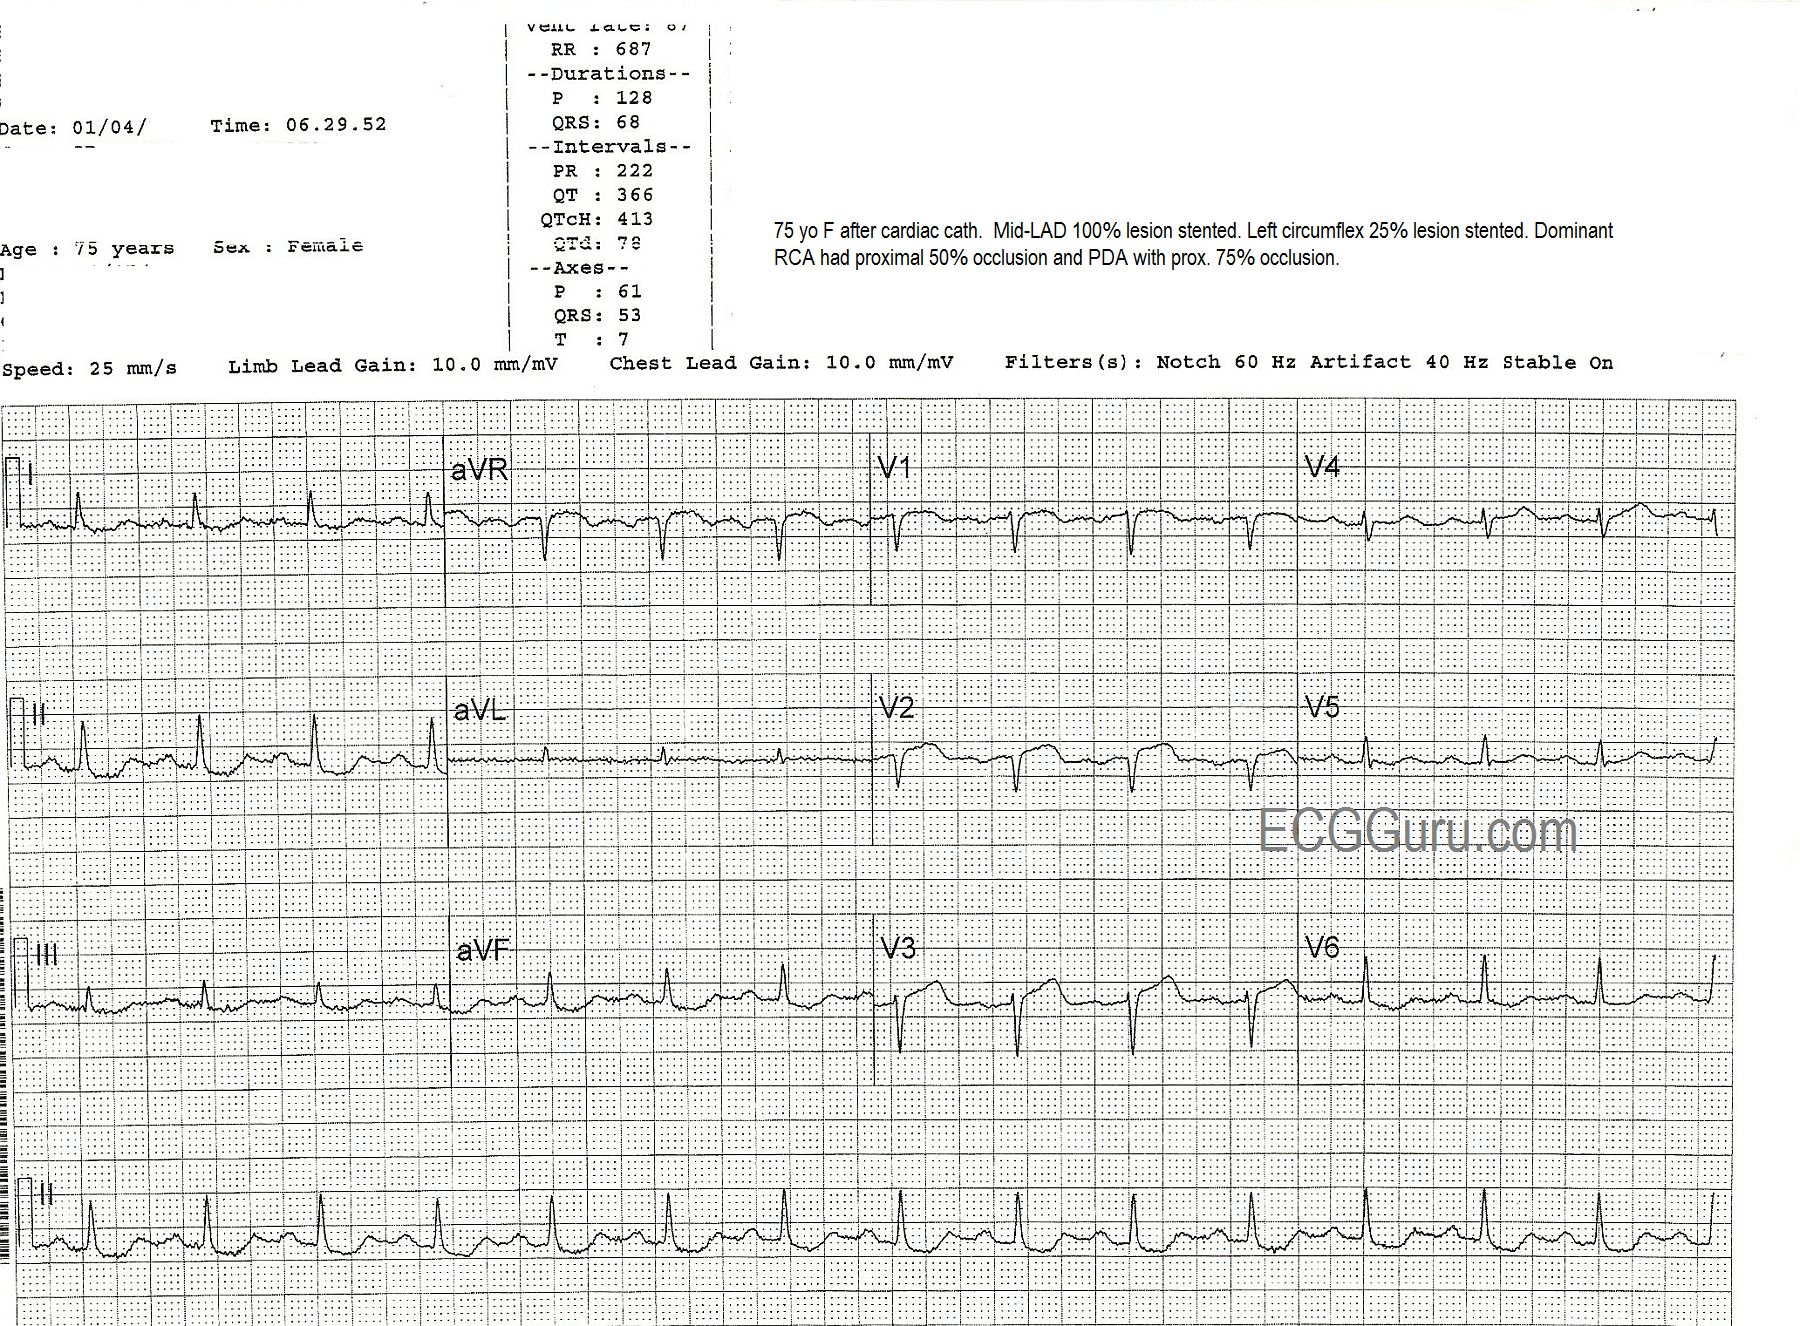
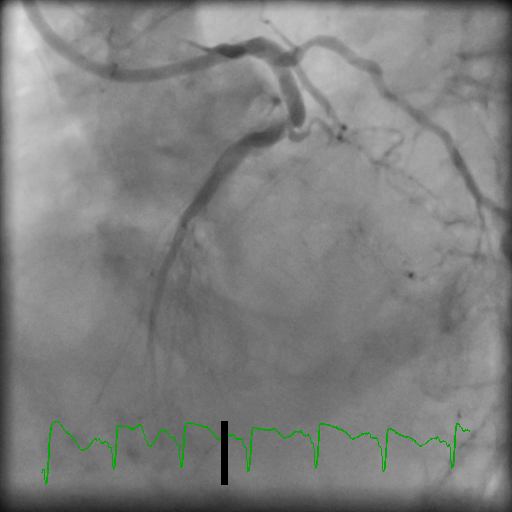
The patient was taken to the cath lab, where it was found that she had a 100% mid-left anterior descending artery occlusion, which was opened and stented. She also was found to have widespread coronary artery disease, with the left circumflex artery 25% occluded (stented), the right coronary artery (which was dominant) proximately occluded 50% and stented, and the posterior descending artery 75% occluded (stented).
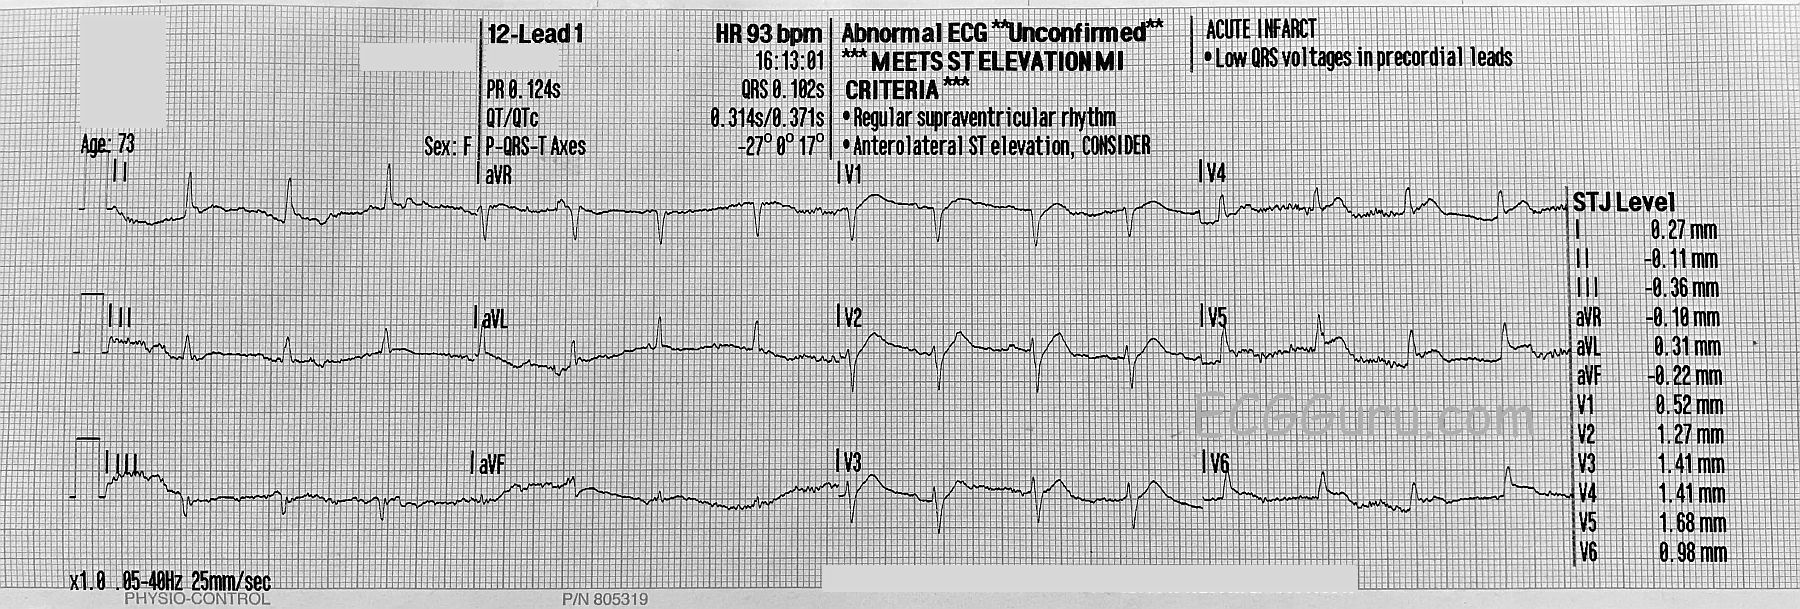
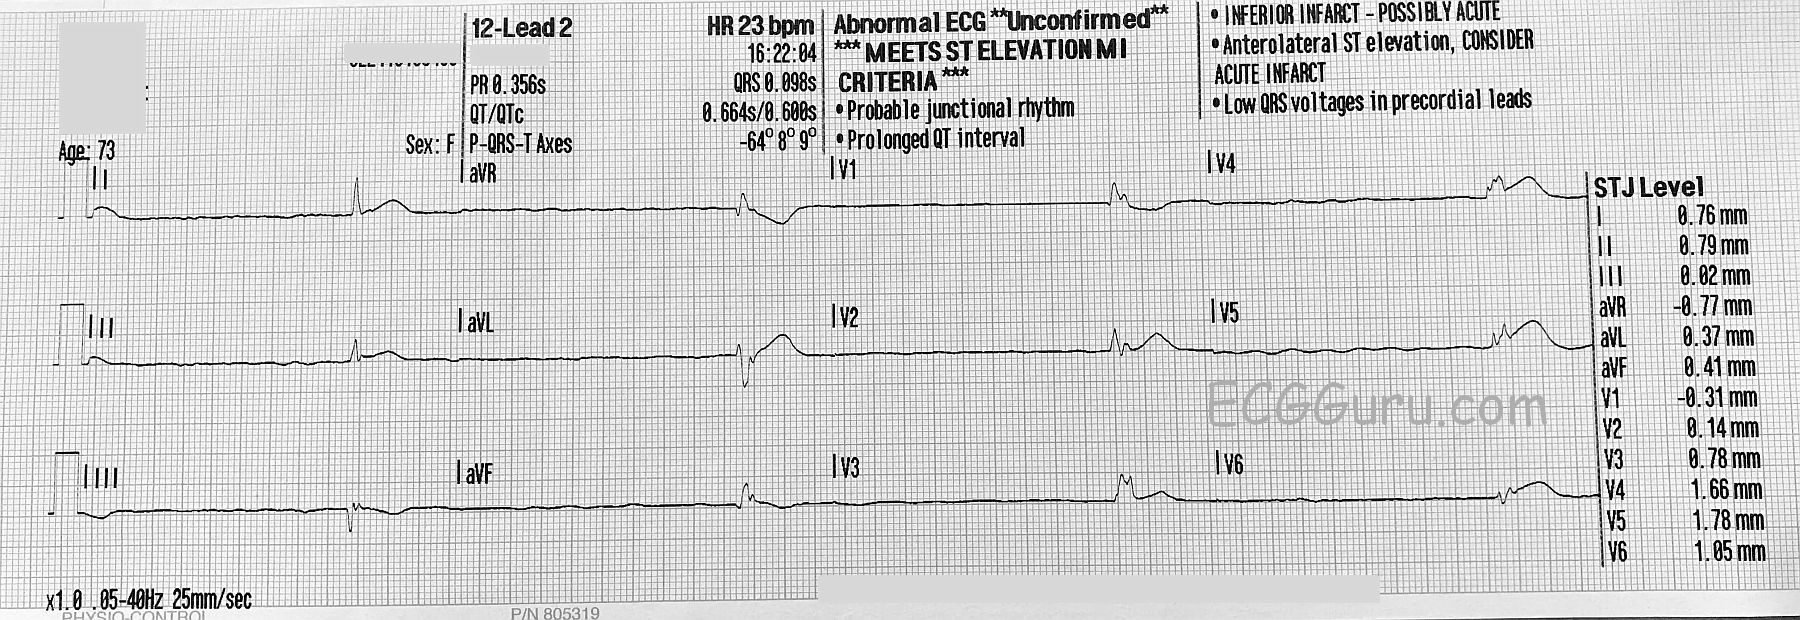
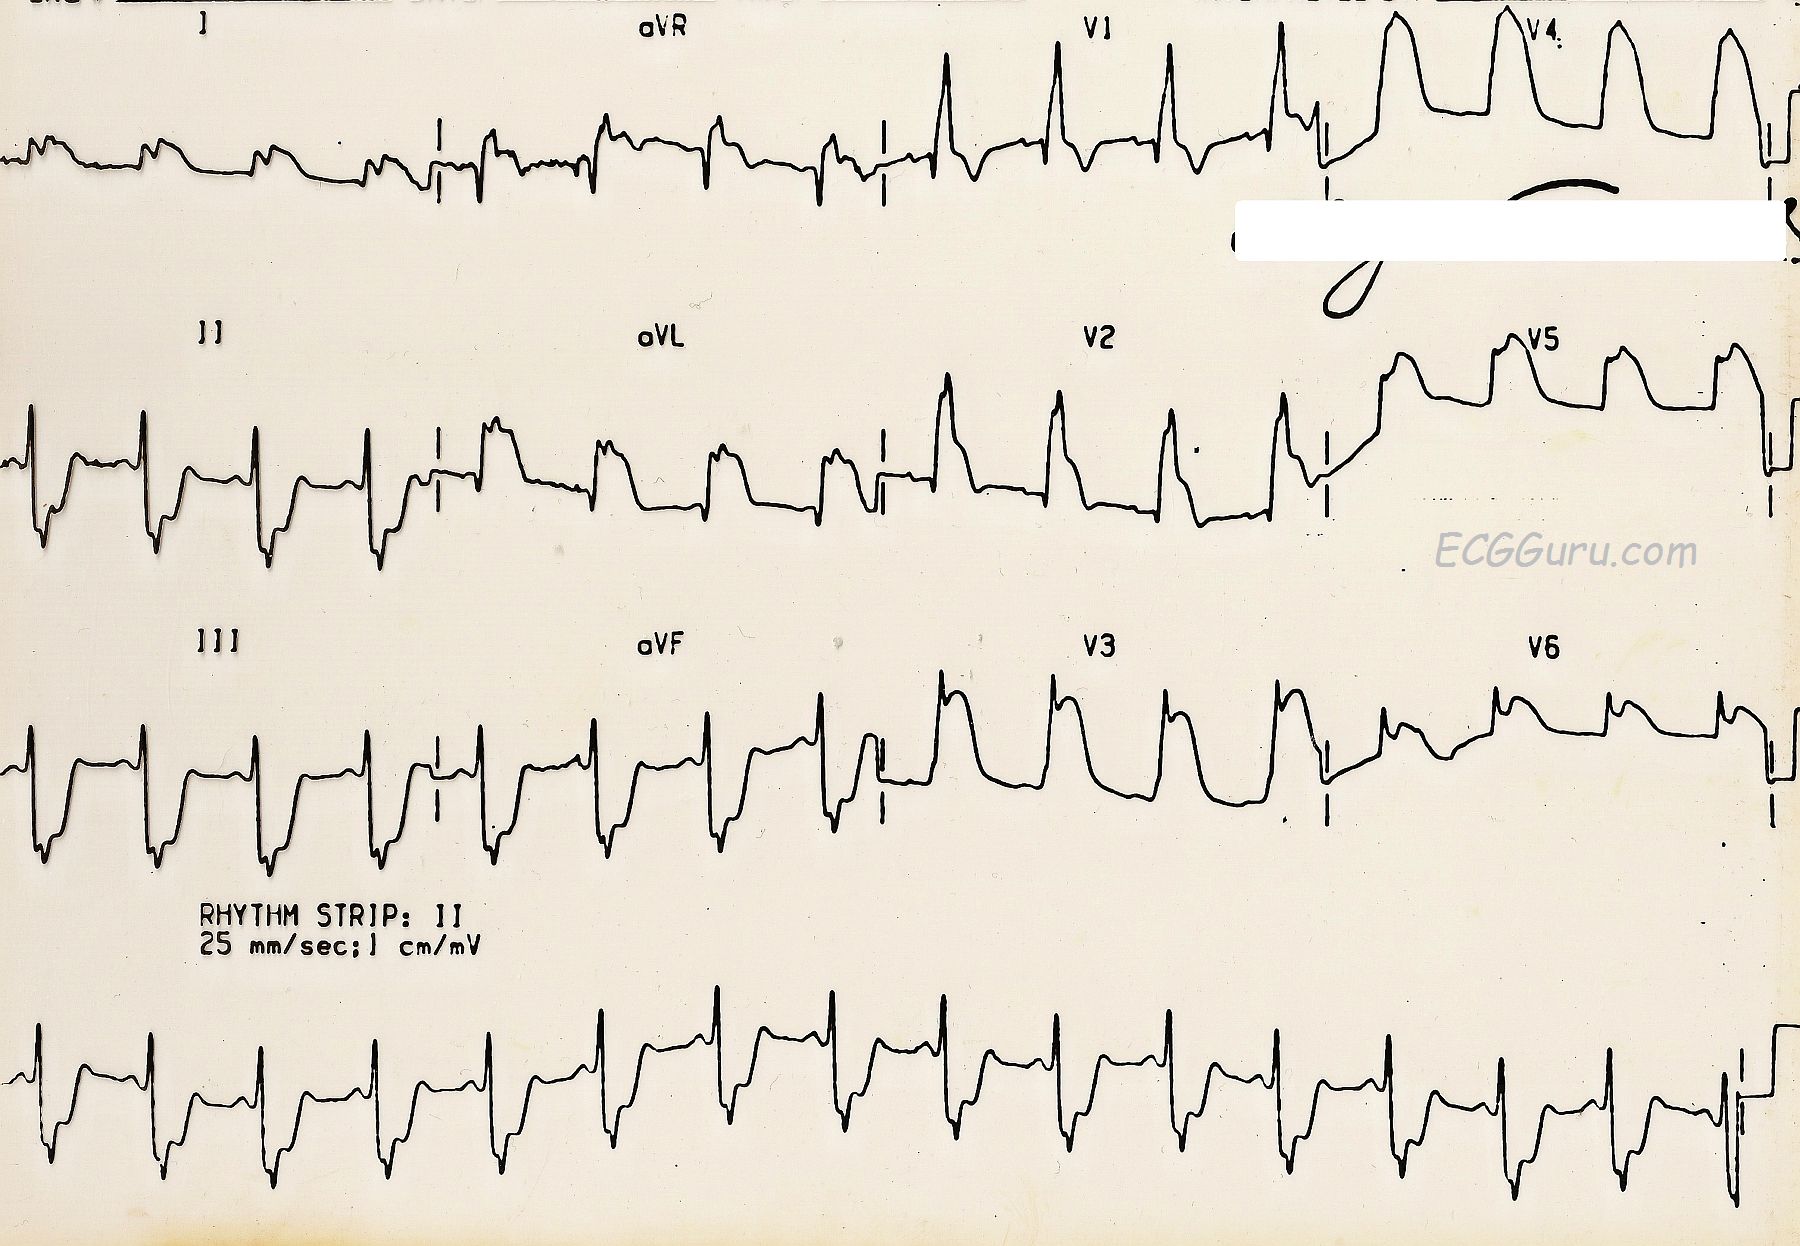
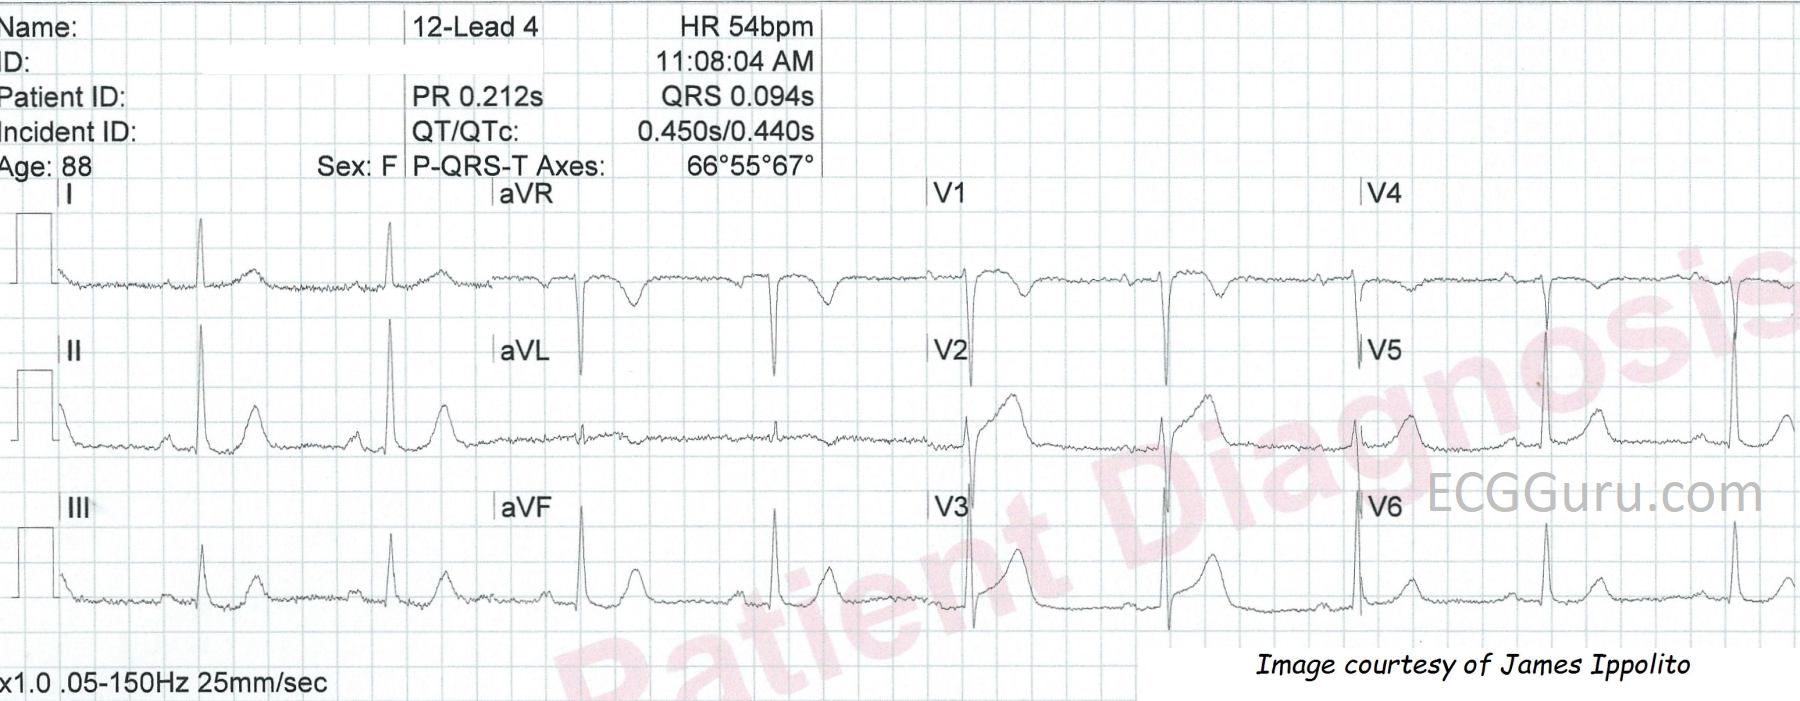
The second ECG, taken at 6:29 the same morning, after the cath procedure, shows some ST elevation with coving remaining in V1 through V3, and also aVR, but now with the loss of R waves in V1 and V2 and loss of R wave voltage in V3. This represents the formation of pathological Q waves, and can be a permanent change in many cases.
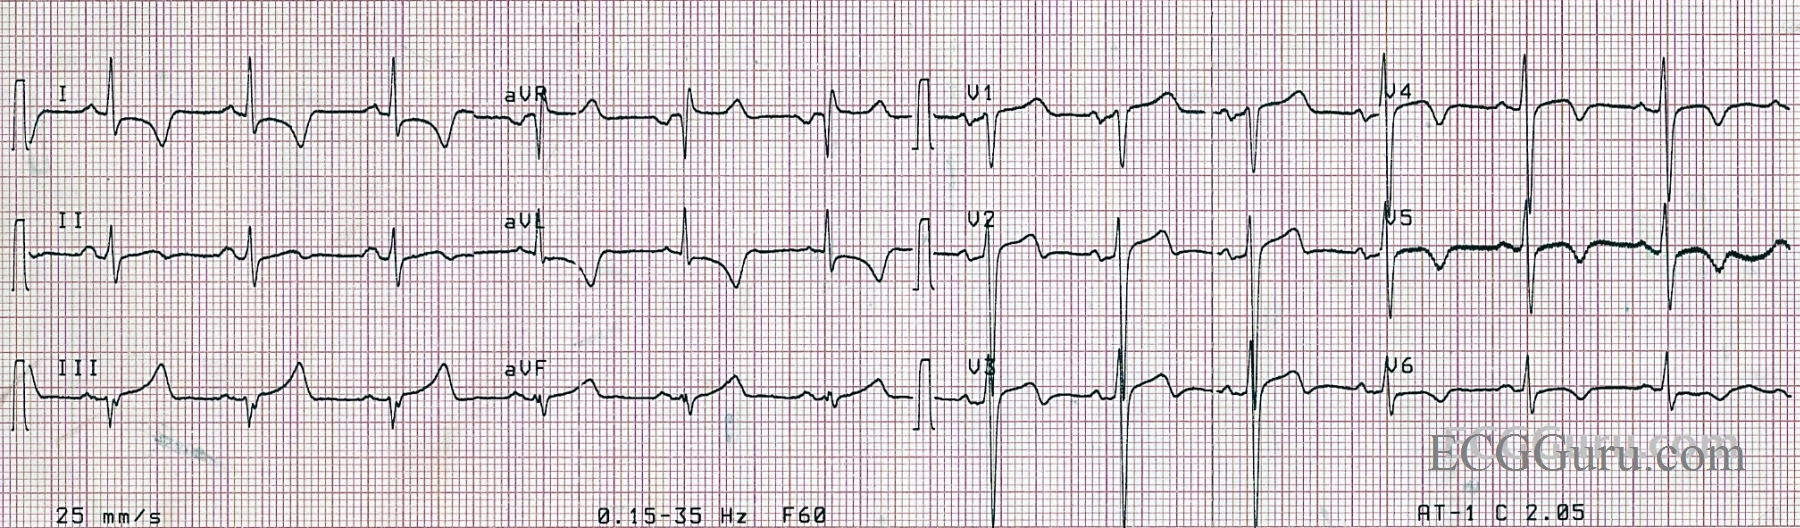
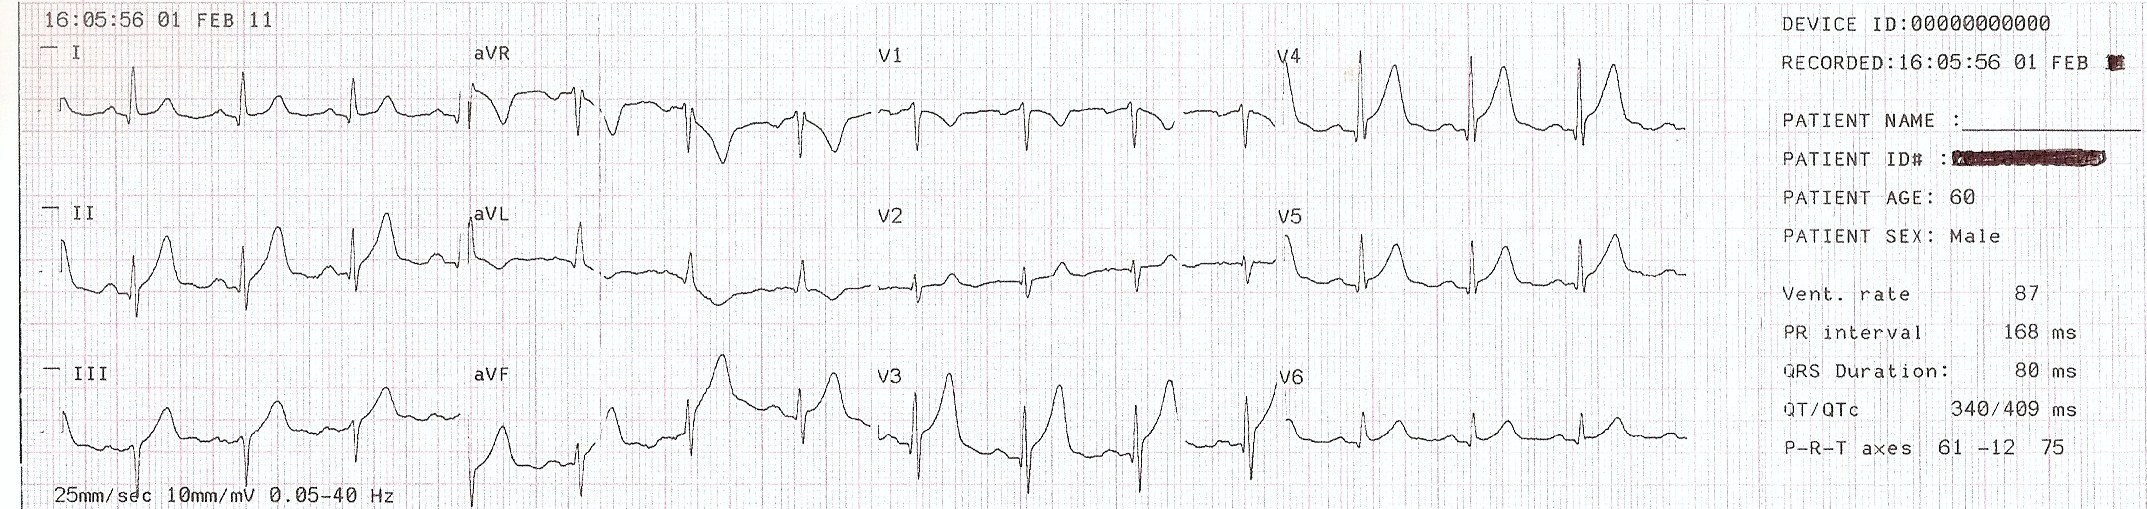
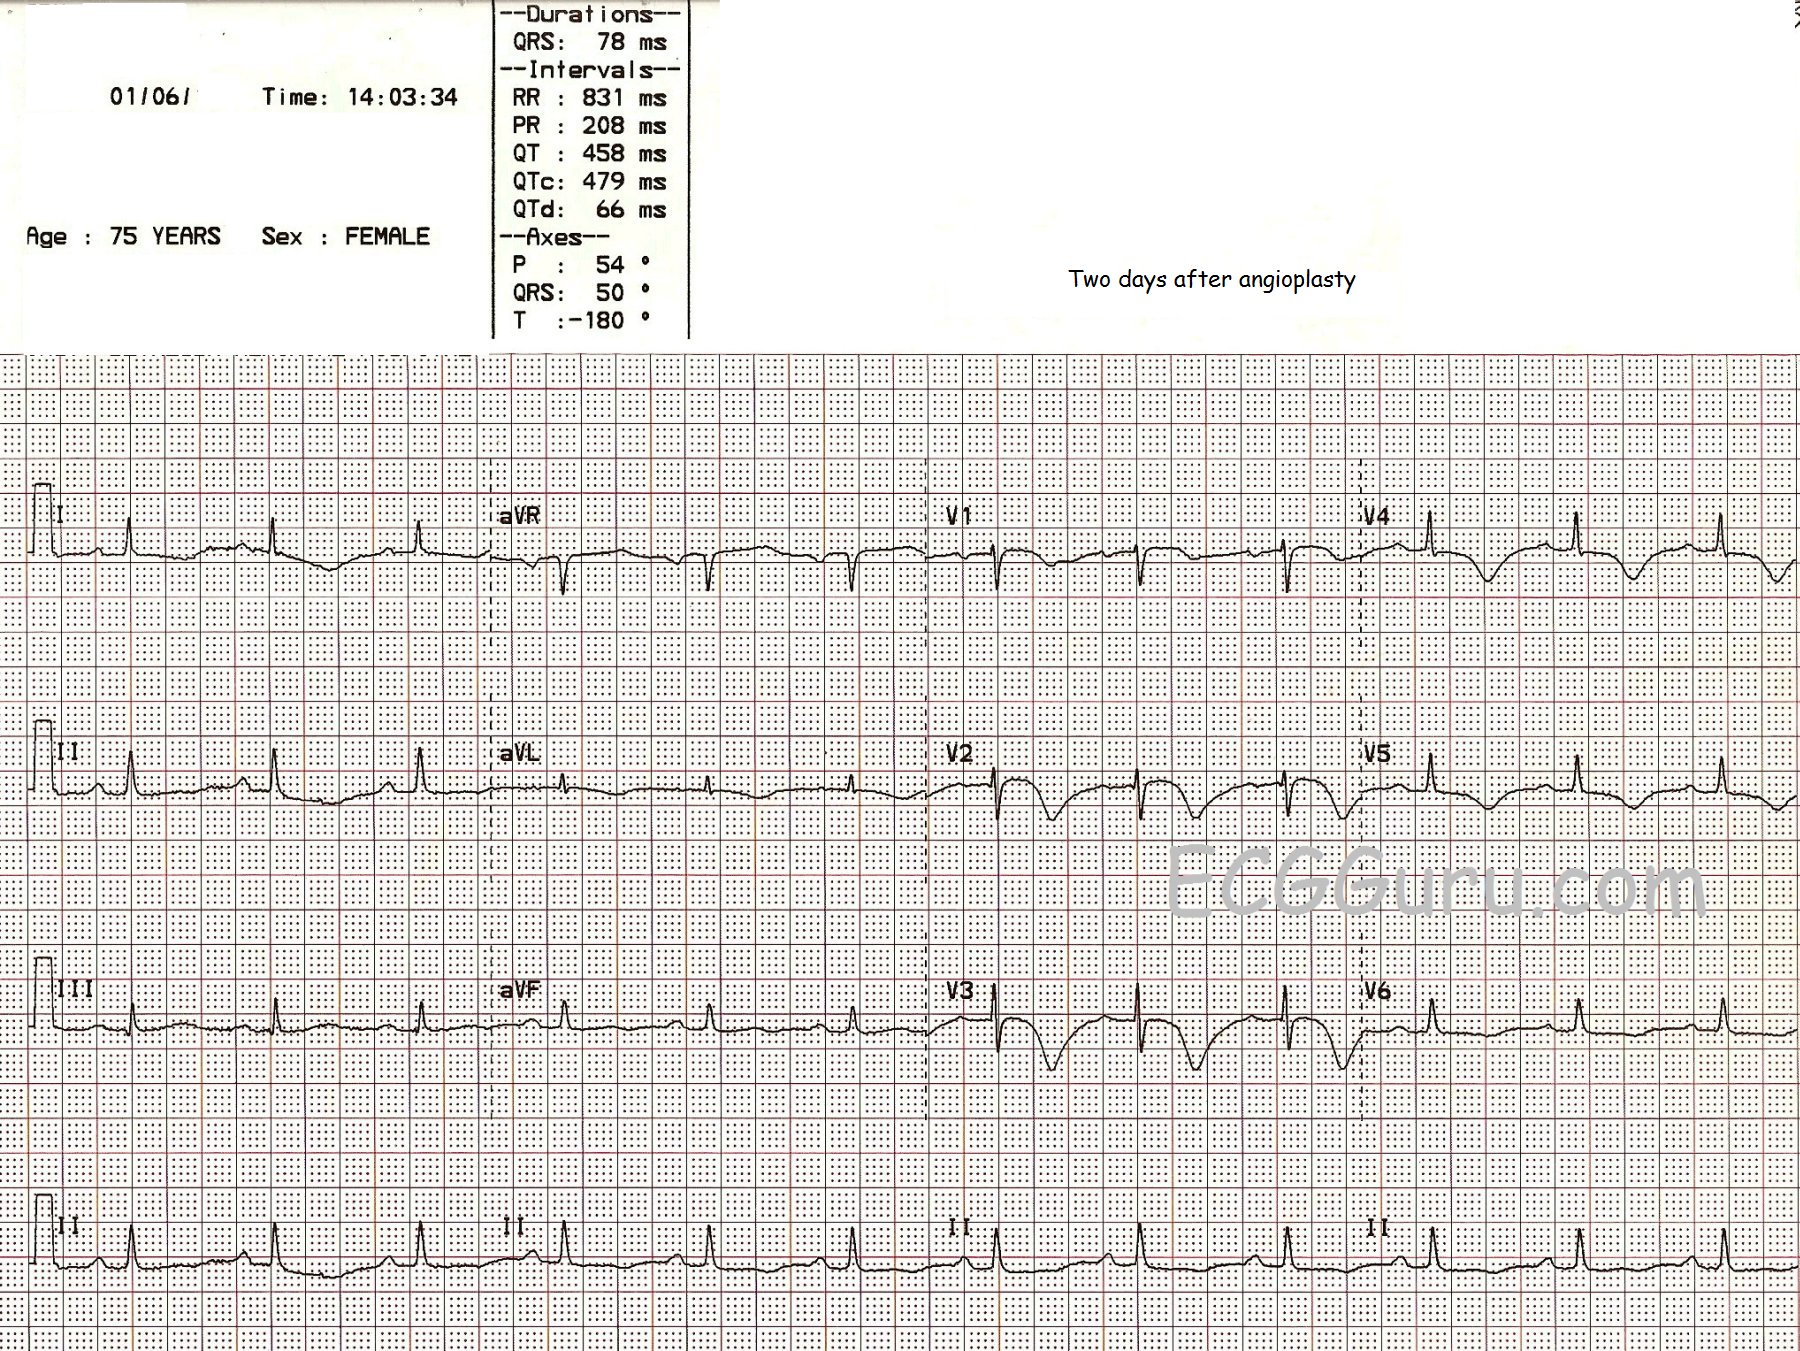
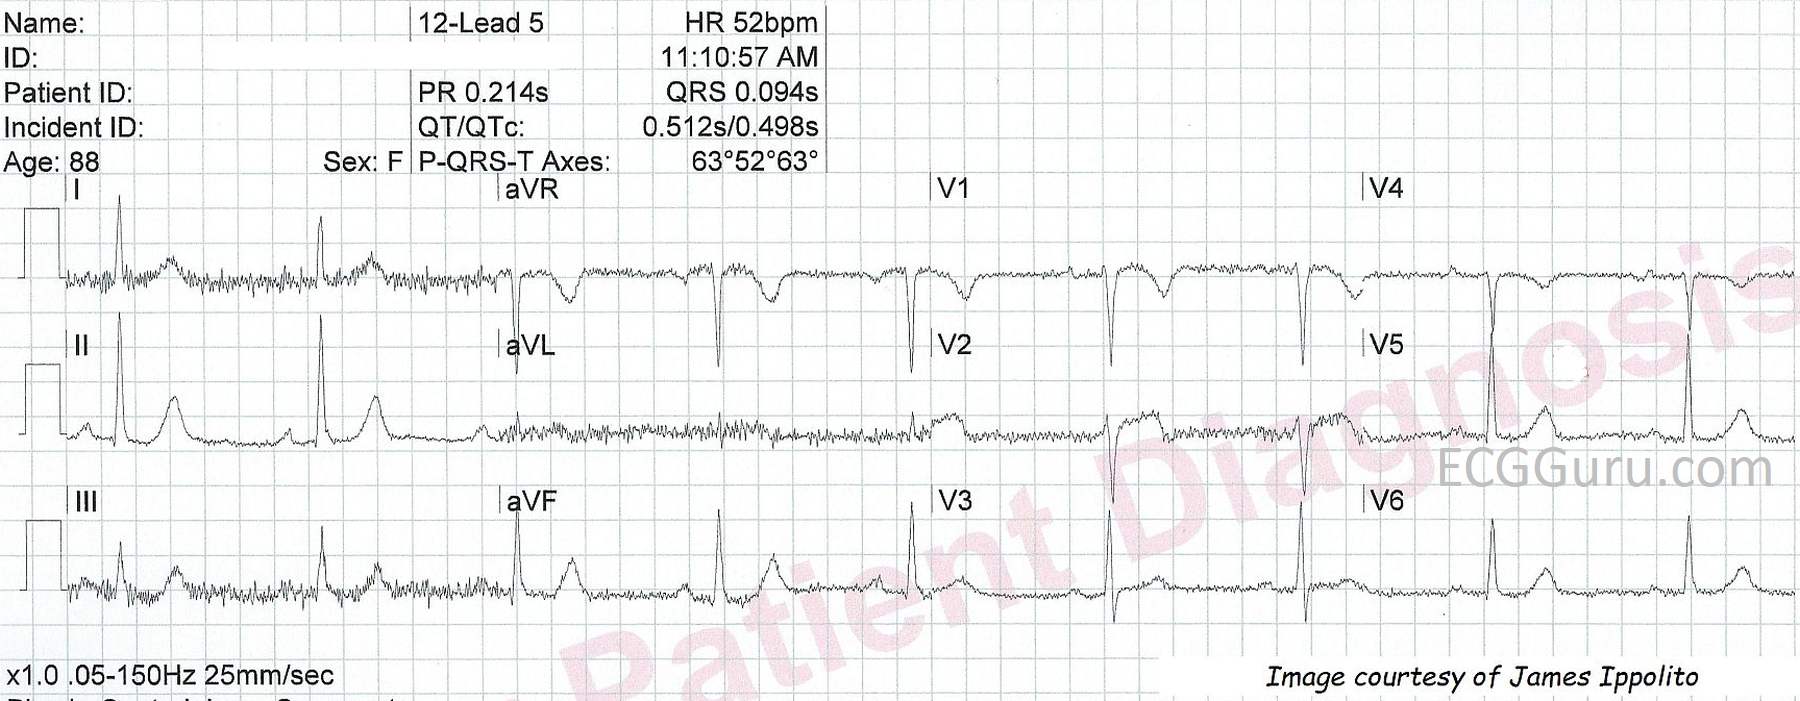
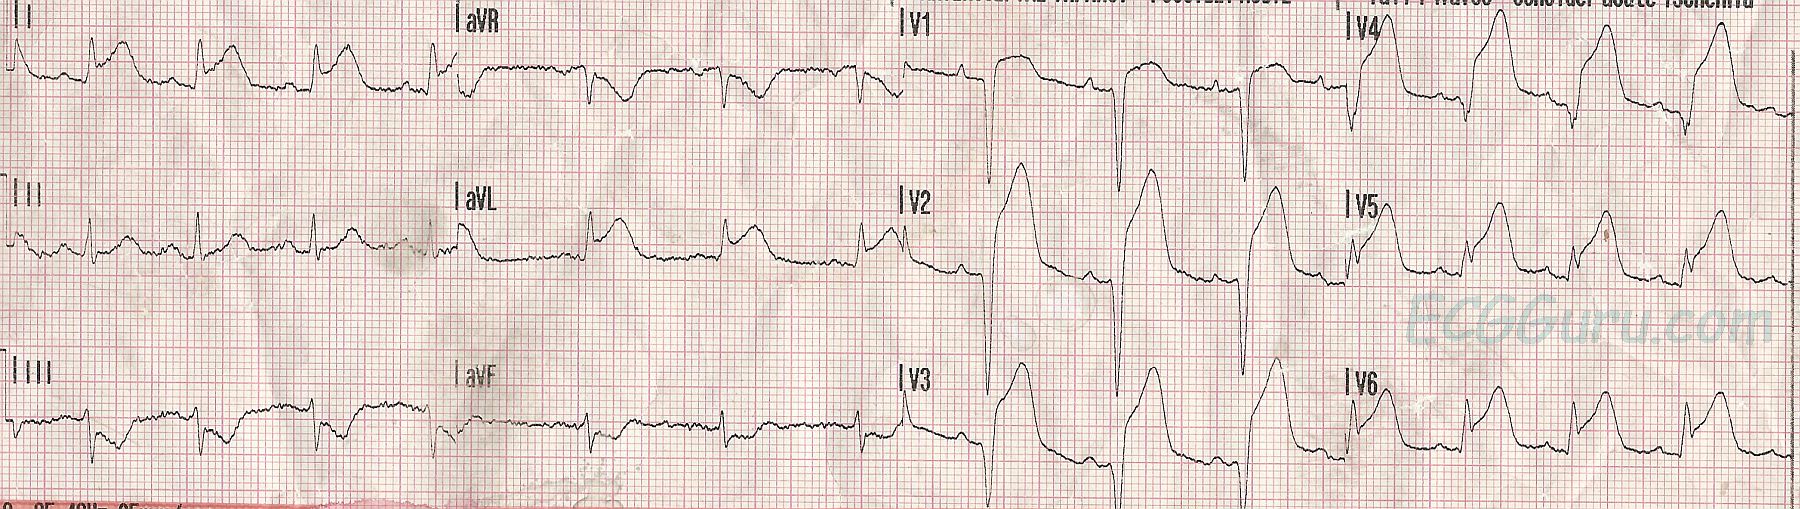
The third ECG, taken two days later in the cardiac step-down unit, shows improvement, and progression toward healing. The ST segments are still shaped in a slightly coved-upward shape, but they are less elevated. The R waves have returned. The T waves in V1-V3 are inverted. The deeply inverted T waves of V2 and V3, especially, and classic for ischemia, and we even see the "ischemic zone" extending across the anterior-lateral wall, including V4 through V6 and Leads I and aVL.
The patient did very well to discharge, and we don't have followup after that.