This ECG is taken from an elderly man with heart failure.
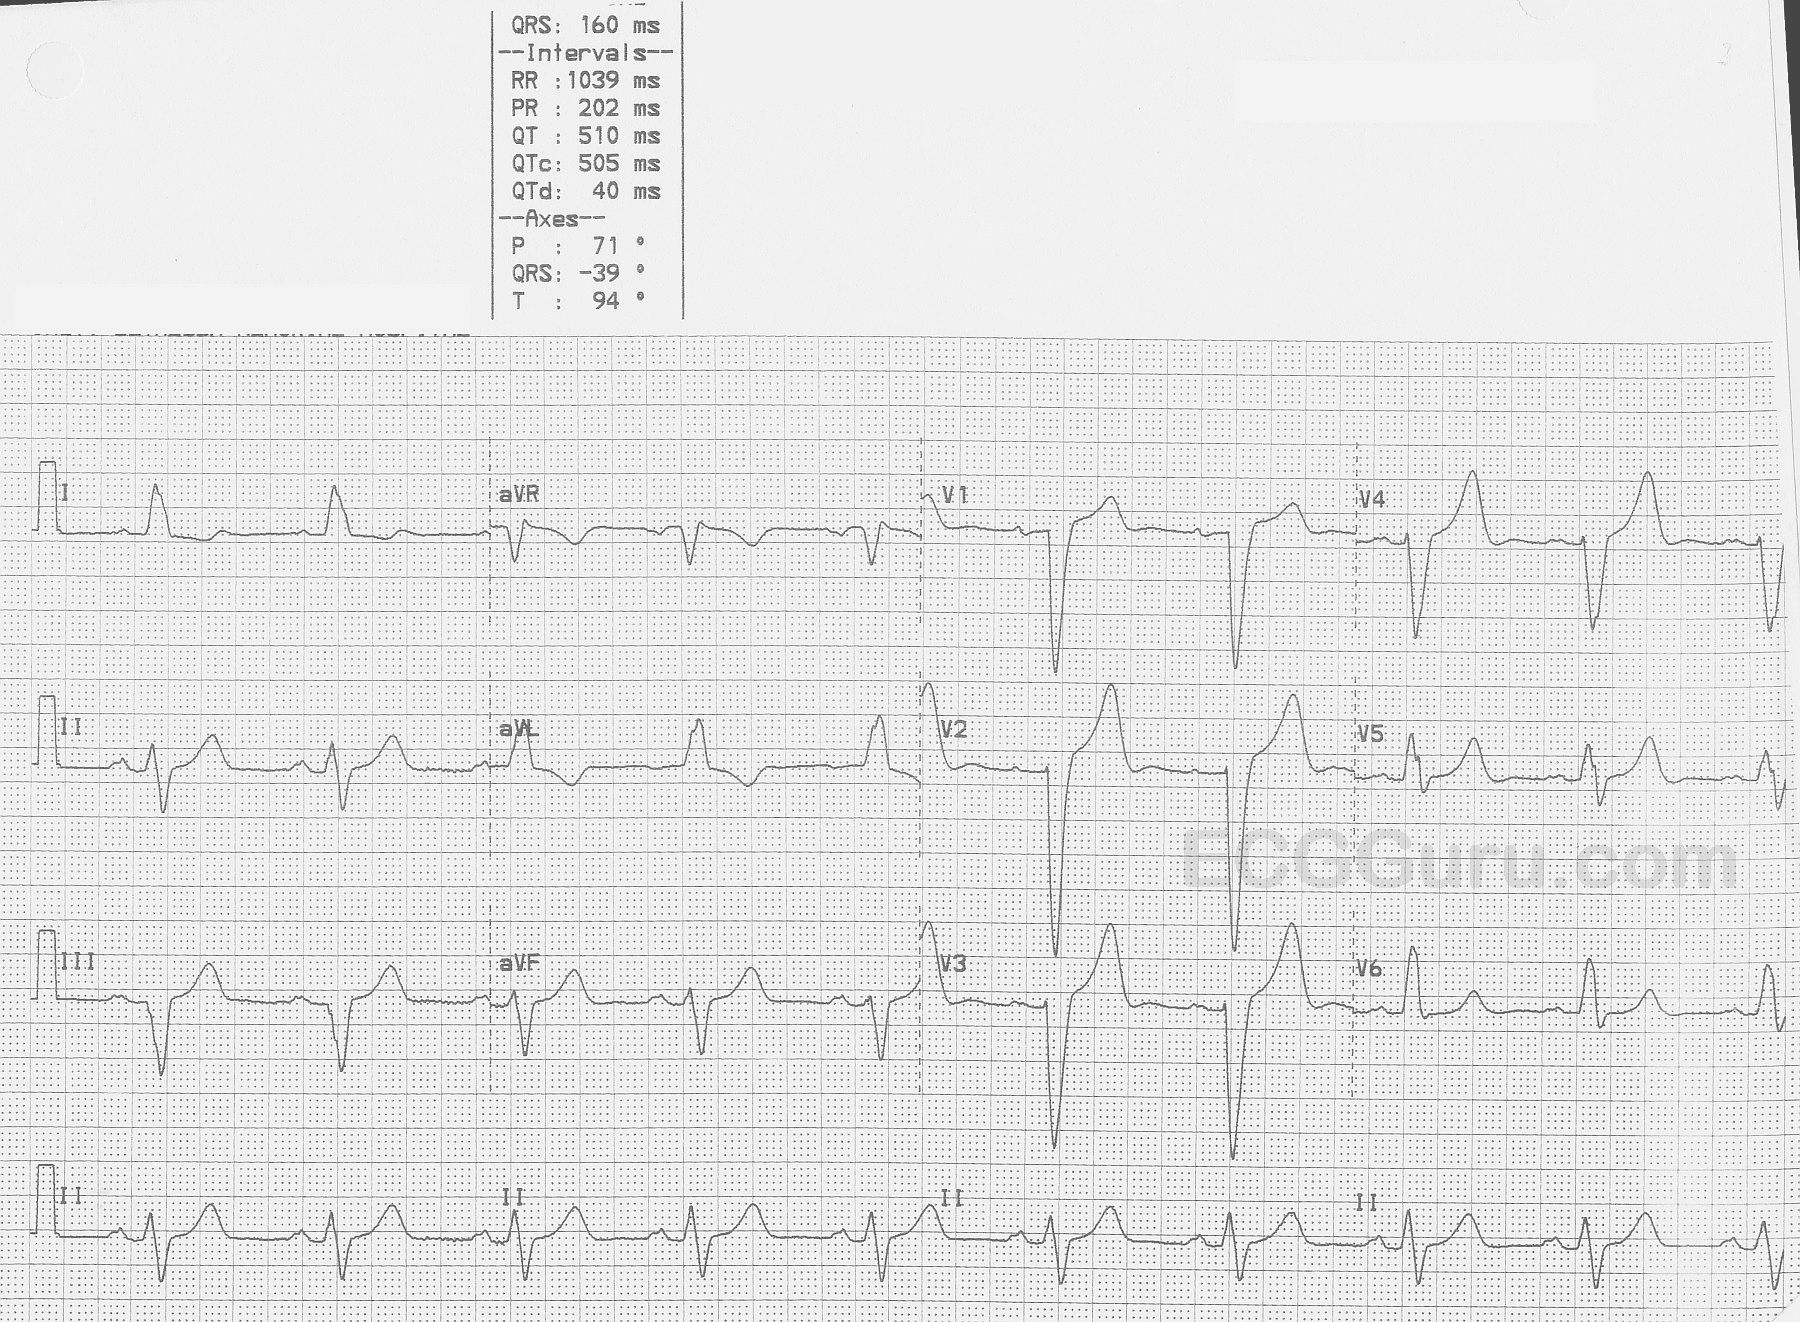
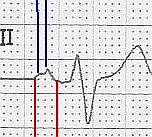
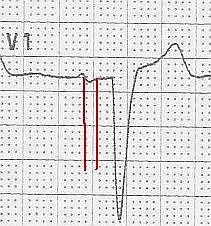
The ECG The first feature that might capture your attention is the wider-than-normal QRS complex, which is 160 ms (.16 seconds).The rate is 58 bpm. We do not know the patient’s medications or baseline rate.There are P waves present, and so the rhythm is SINUS BRADYCARDIA. The P waves are broad , > 110 ms in Lead II (red lines in close up) and bifid, with greater than 40 ms between the two peaks in Lead II (blue lines).In V1, the P waves are biphasic, with the terminal negative portion greater than 40 ms duration (red lines). This meets the ECG criteria for LEFT ATRIAL ENLARGEMENT, or preferably, LEFT ATRIAL ABNORMALITY. (https://LITFL.com/left-atrial-enlargement-ecg-library/) ECG criteria are not highly accurate for detecting atrial enlargement, and abnormal findings should be confirmed by anatomic measurement. (https://www.ncbi.nlm.nih.gov/pmc/articles/PMC2244611/).
The QRS complexes, as mentioned, are wide. Because there is sinus rhythm, we know the delay in conduction is due to interventricular conduction delay, and not to ventricular rhythm.This ECG meets the criteria for LEFT BUNDLE BRANCH BLOCK.
This ECG shows voltage criteria for LVH (deep S waves V1-V3 and tall R waves V4 - V6). There are many criteria in use for determining LVH, but probably the most commonly used is the Sokolow-Lyon criteria. This criteria says that if the voltage of the S wave in V1 PLUS the tallest R wave of V4, V5, and V6 equals 35 mm or more, the criteria are sufficient for LVH.
In order to diagnose LVH from the ECG, we must also show repolarization abnormalities, called the "strain pattern". This is seen in sloping ST depressions in all leads with upright QRS complexes. There will also be slight ST elevations (reciprocal to the depressions) in leads with negative QRSs. Chest xray and echocardiogram are important in confirming the extent of the left ventricular enlargement.
The axis of this ECG is not typical of LVH, as it is normal. LVH usually has a left axis deviation. In this ECG, Lead aVL appears to have a pathological Q wave. Possible high lateral damage in the past has skewed the axis downward. The wide p waves in Lead II and the biphasic p waves in V1 may also indicate left atrial strain, a common finding with LVH, called "P mitrale".