This image is courtesy of Dr. Stasinos Theodorou of the Limassol Cardiology practice. It may be used free of charge and free of copyright for educational purposes. For any commercial use, please contact Dr. Theodorou at the Limassol Cardiology practice.
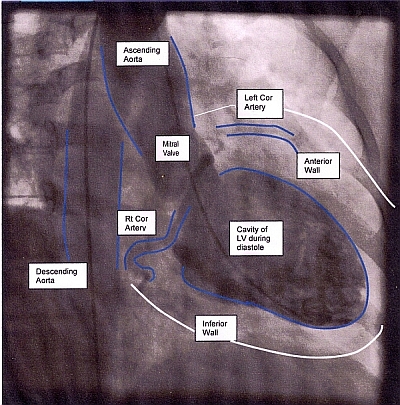
This ventriculogram shows the typical apical ballooning of the left ventricle during Takotsubo myocardiopathy. This serious condition can be caused by extreme stress, such as in the death of a loved one, or prolonged high stress levels. The ECG will usually show ST elevations indicating an anterior wall M.I., but the angiogram will show no arterial occlusions. Takotsubo myopathy causes a sudden onset of congestive heart failure. It is transient, and those who survive it generally recover fully. For an excellent and complete discussion of Broken-Heart Syndrome,
The ECG Guru now has a You Tube site where you can find videos to enhance your classes. As with all ECG Guru content, there is no charge and no copyright. Ventriculograms are often obtained during a cardiac cath procedure. A curved, or pigtail, catheter is inserted through the arterial access line into the aorta and then the left ventricle. Contrast is introduced into the left ventricle and the pumping function of the ventricle can be observed. The structure and function of the aorta and mitral valve may also be observed during this procedure.
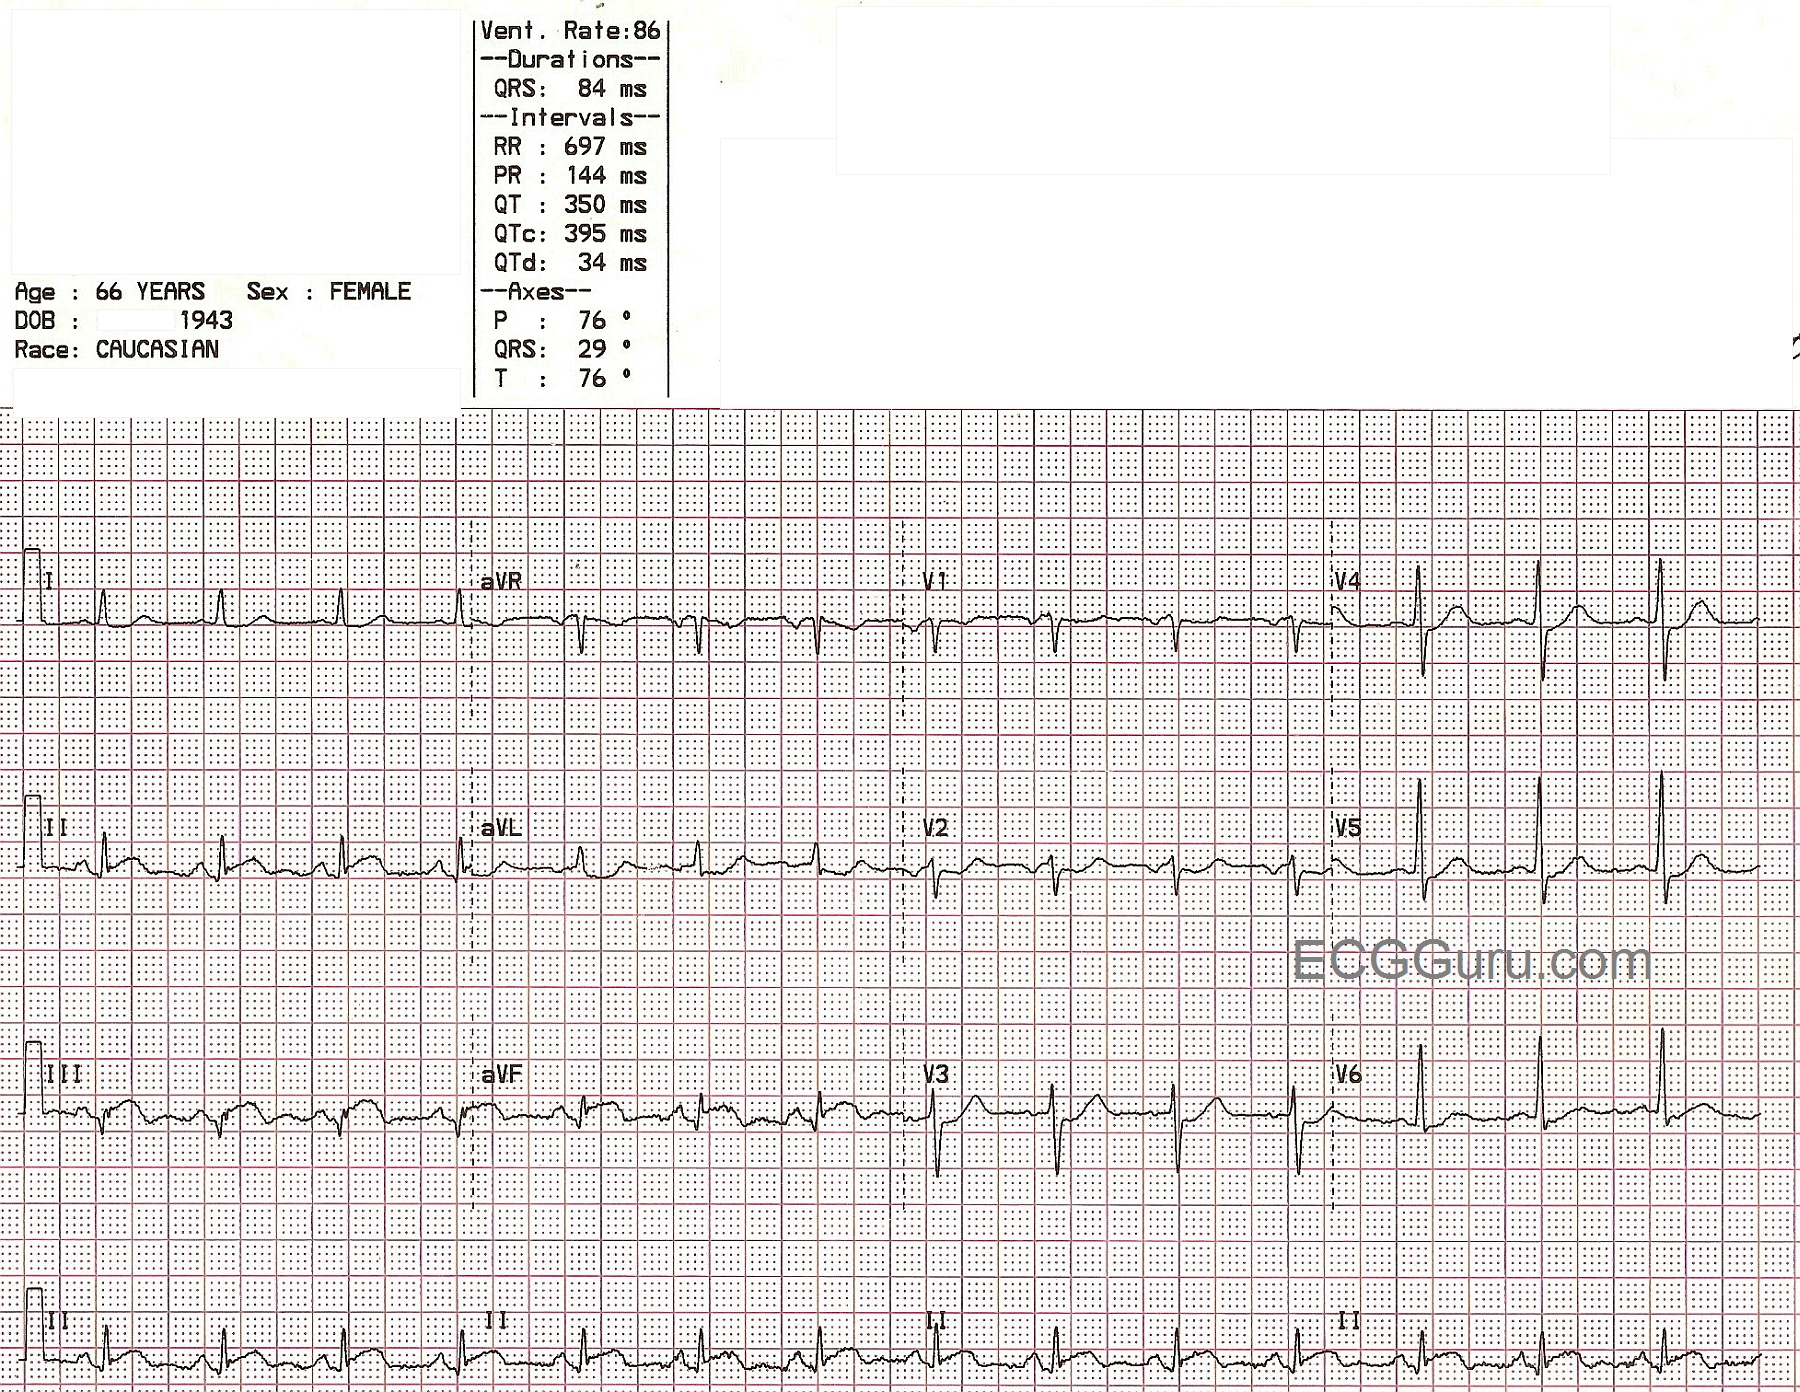
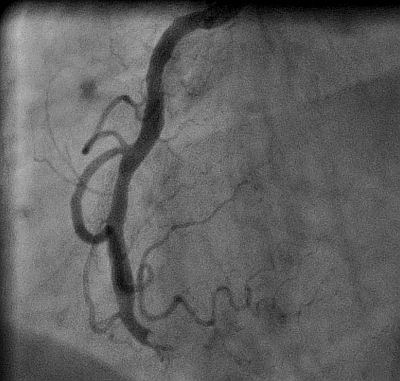
This ECG was taken from a 66-year-old woman who presented to the emergency department complaining of chest pain and shortness of breath. She attributed her symptoms to her COPD, but stated that her aerosol treatment had not helped. She waited for some time before deciding to go to the hospital, then drove herself. In the emergency department, she had blood drawn, an I.V. started, and an aerosol treatment of albuterol. She was then taken to the radiology dept. for a chest xray. When she returned, a 12-lead ECG was done. 45 minutes had passed since she first arrived at the hospital. This ECG is shown here. It shows ST elevation in the inferior leads: II, III, and aVF. The patient was taken immediately to the cath lab, where her right coronary artery was found to have a 100% occlusion. (See image accompanying this ECG). Angioplasty was successful, and stents were placed in the artery. The patient was found to have anemia, with a hemoglobin of 5.5, and she was given a blood transfusion. During the cath procedure, a ventriculogram was performed, which showed a stunned and akinetic inferior wall. Unfortunately, subsequent ventriculogram performed several weeks later showed the lack of motion of the inferior wall to be permanent. The ventriculogram is also posted here, and at this YouTube link, so you will be able to show your students the mechanical effects on the heart of a delay to treatment in acute STEMI. See our YouTube site for more ventriculograms and cath videos.
At this link, you will find a ventriculogram showing a normally-functioning left ventricle with an excellent ejection fraction. For your students, ventriculograms can illustrate muscle function visually, and are a great aid when teaching ECG. Watch the ECG Guru website and YouTube page for more ventriculograms and other cath lab videos.