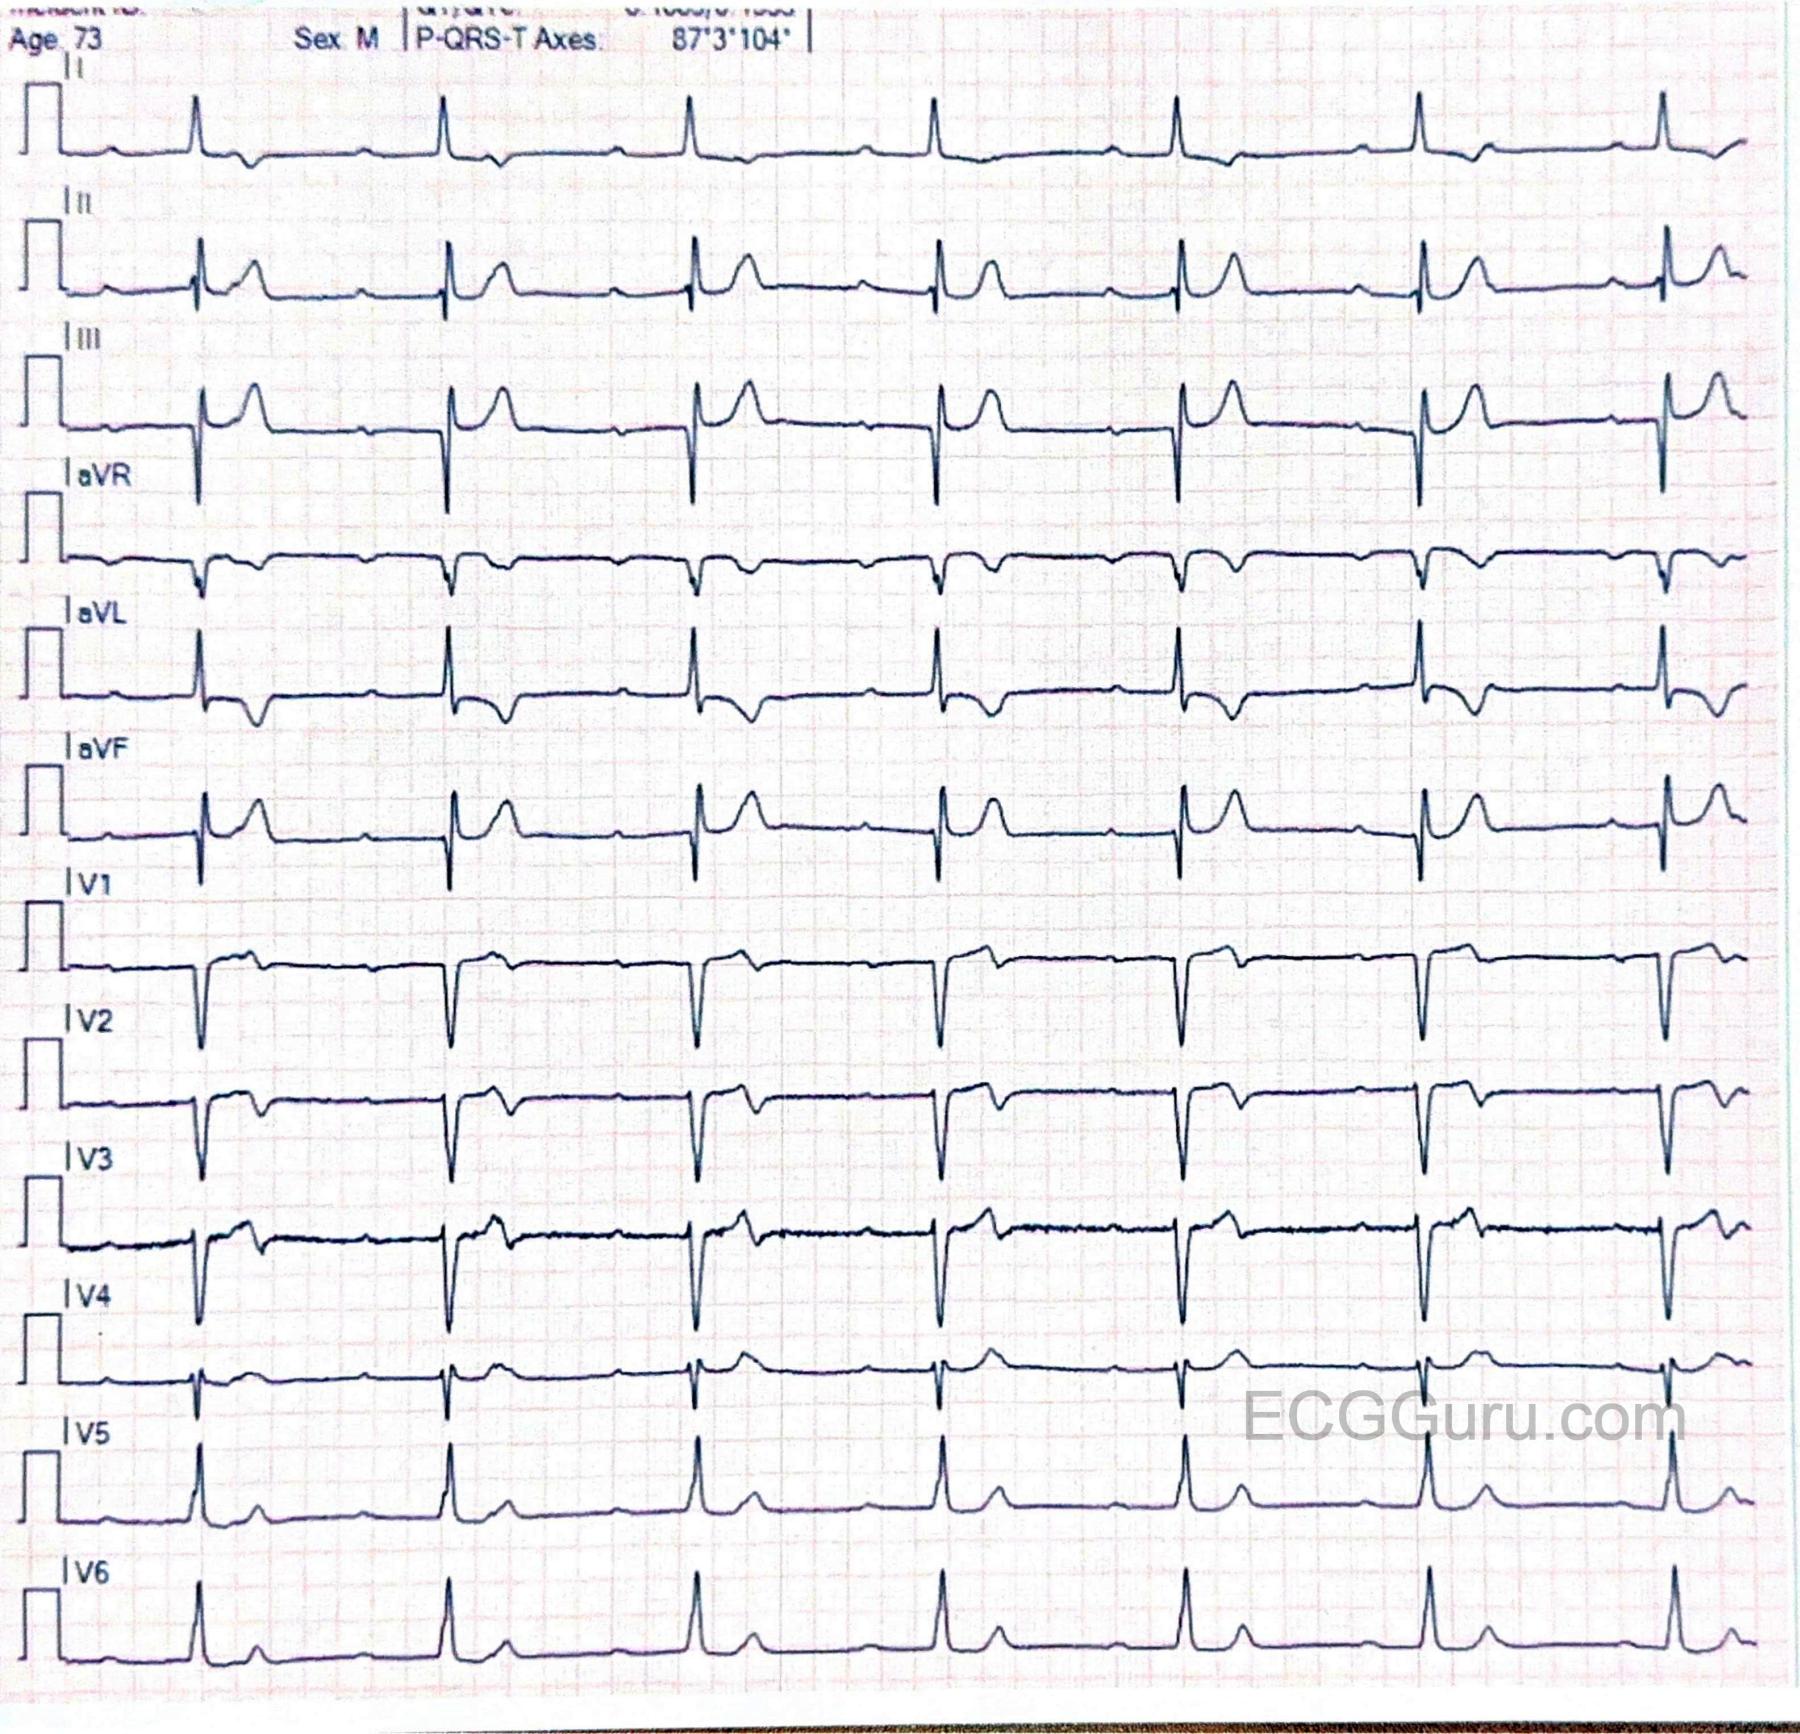
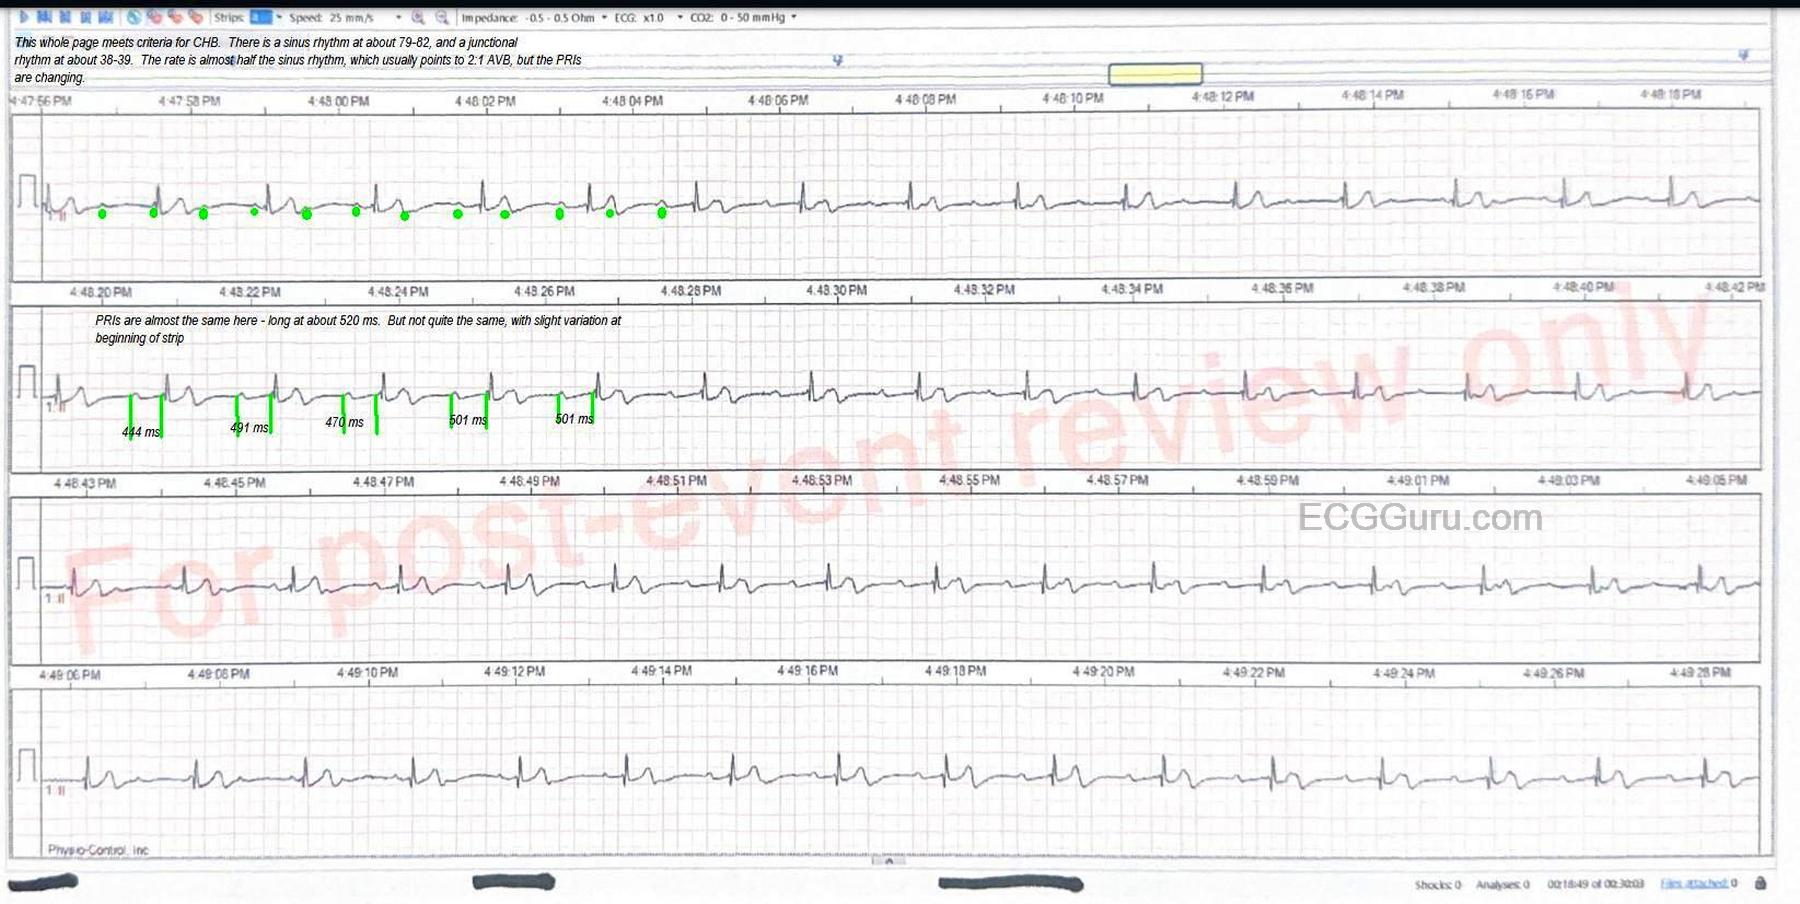
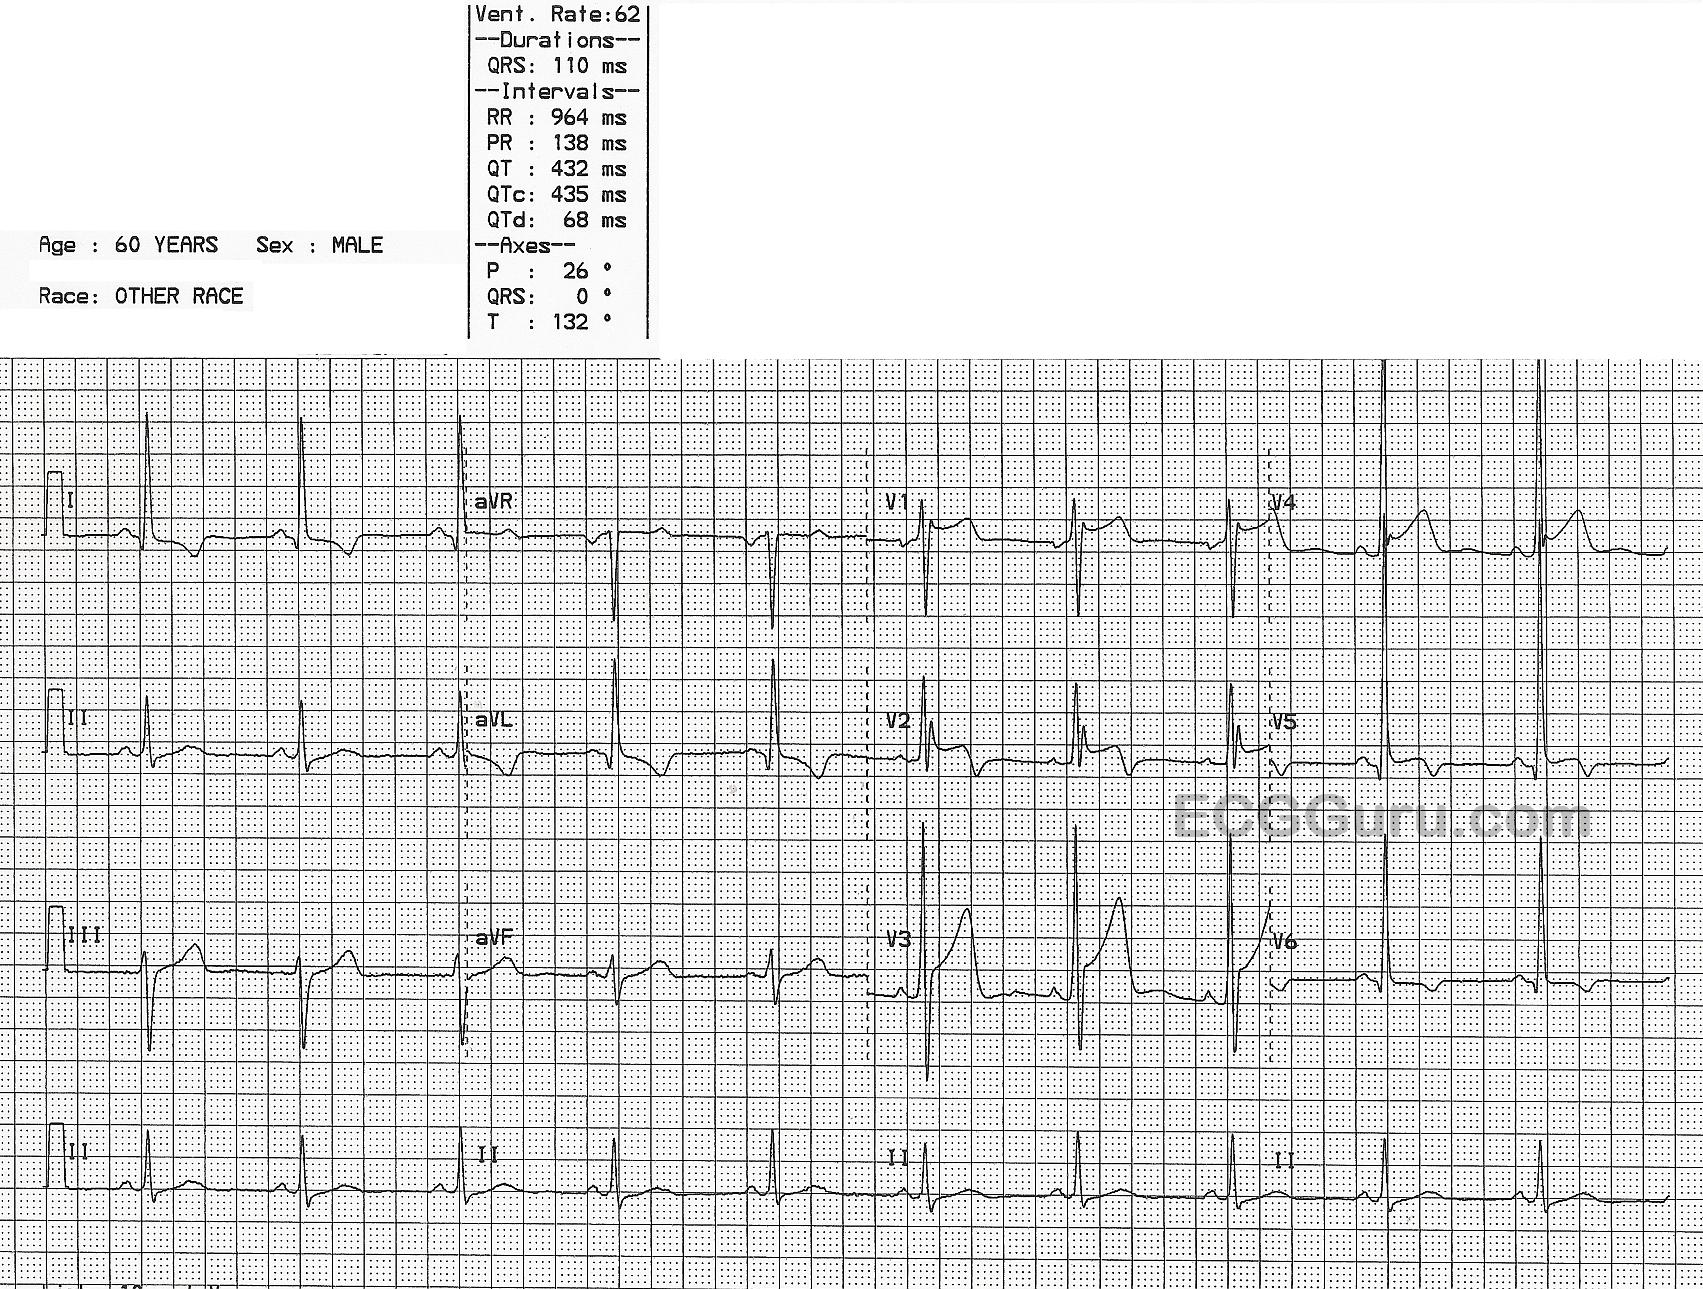
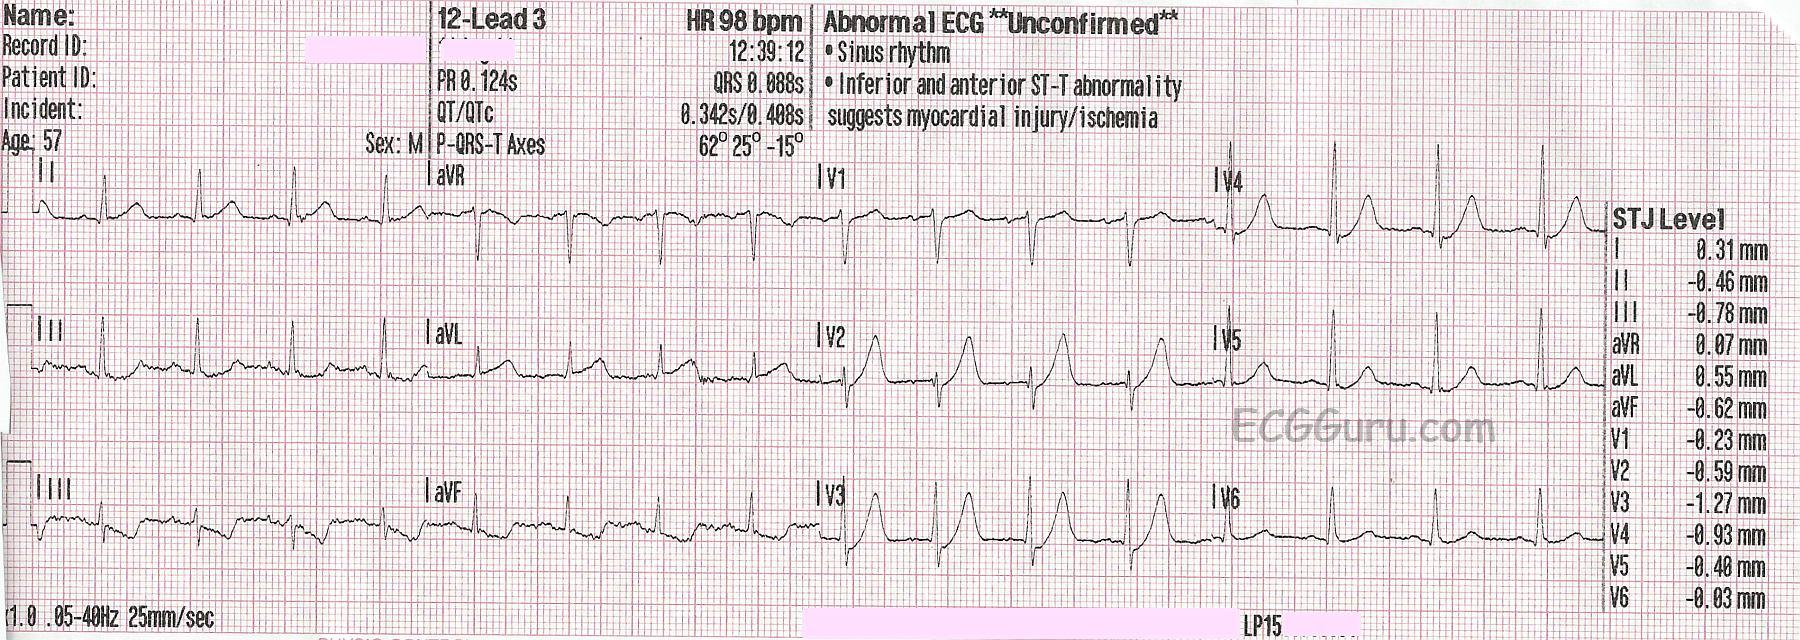
Displaying 1 - 4 of 4
Dawn's picture

Instructors' Collection ECG: Hyperacute T Waves: de Winter T Waves

The Patient

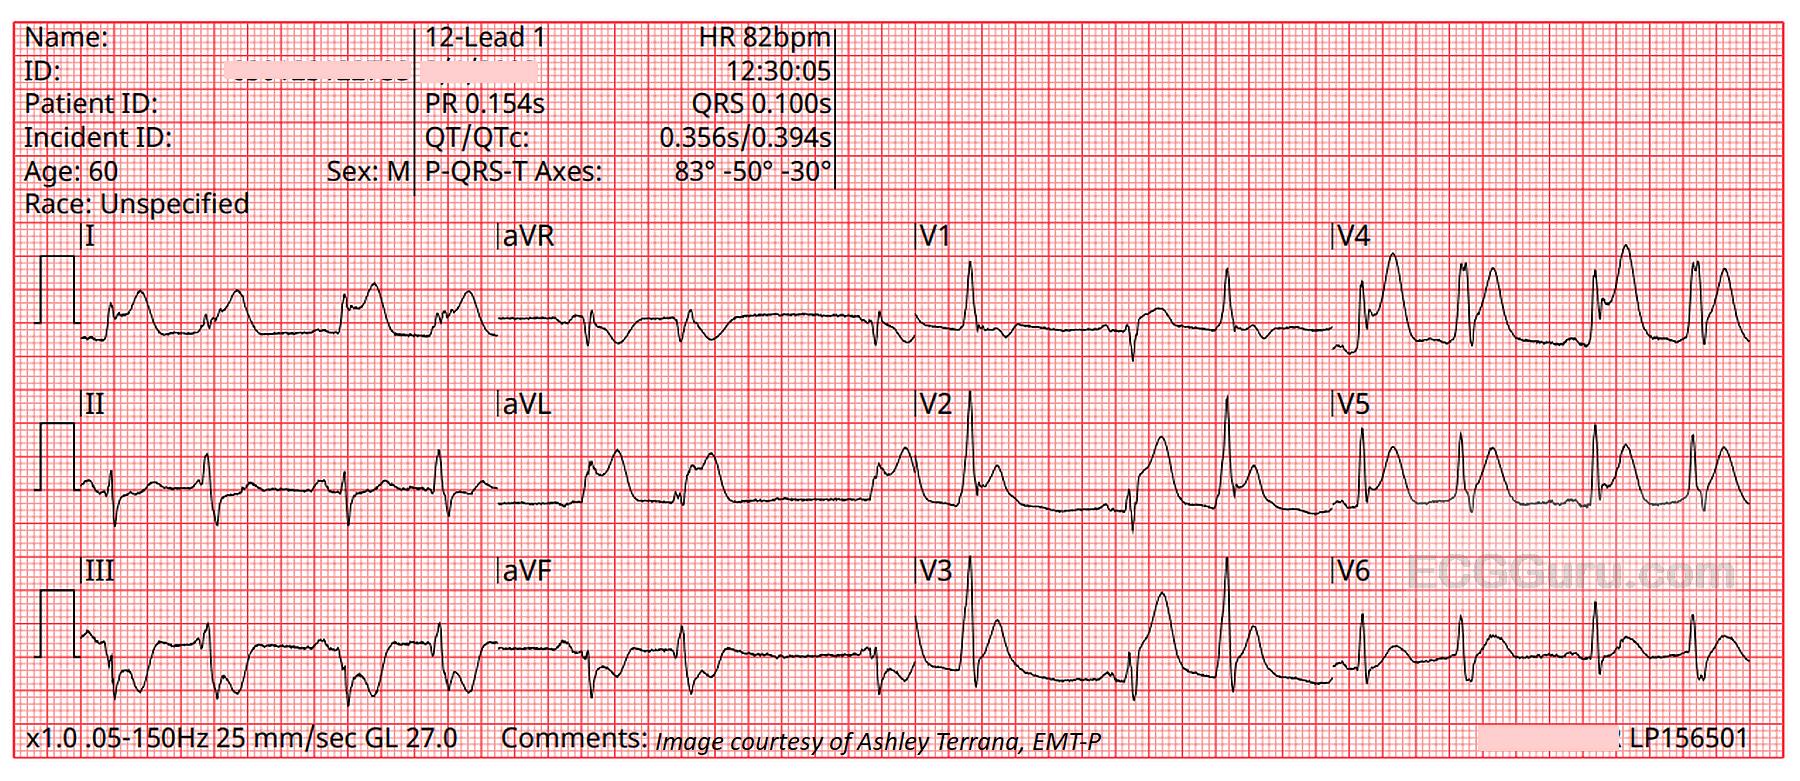
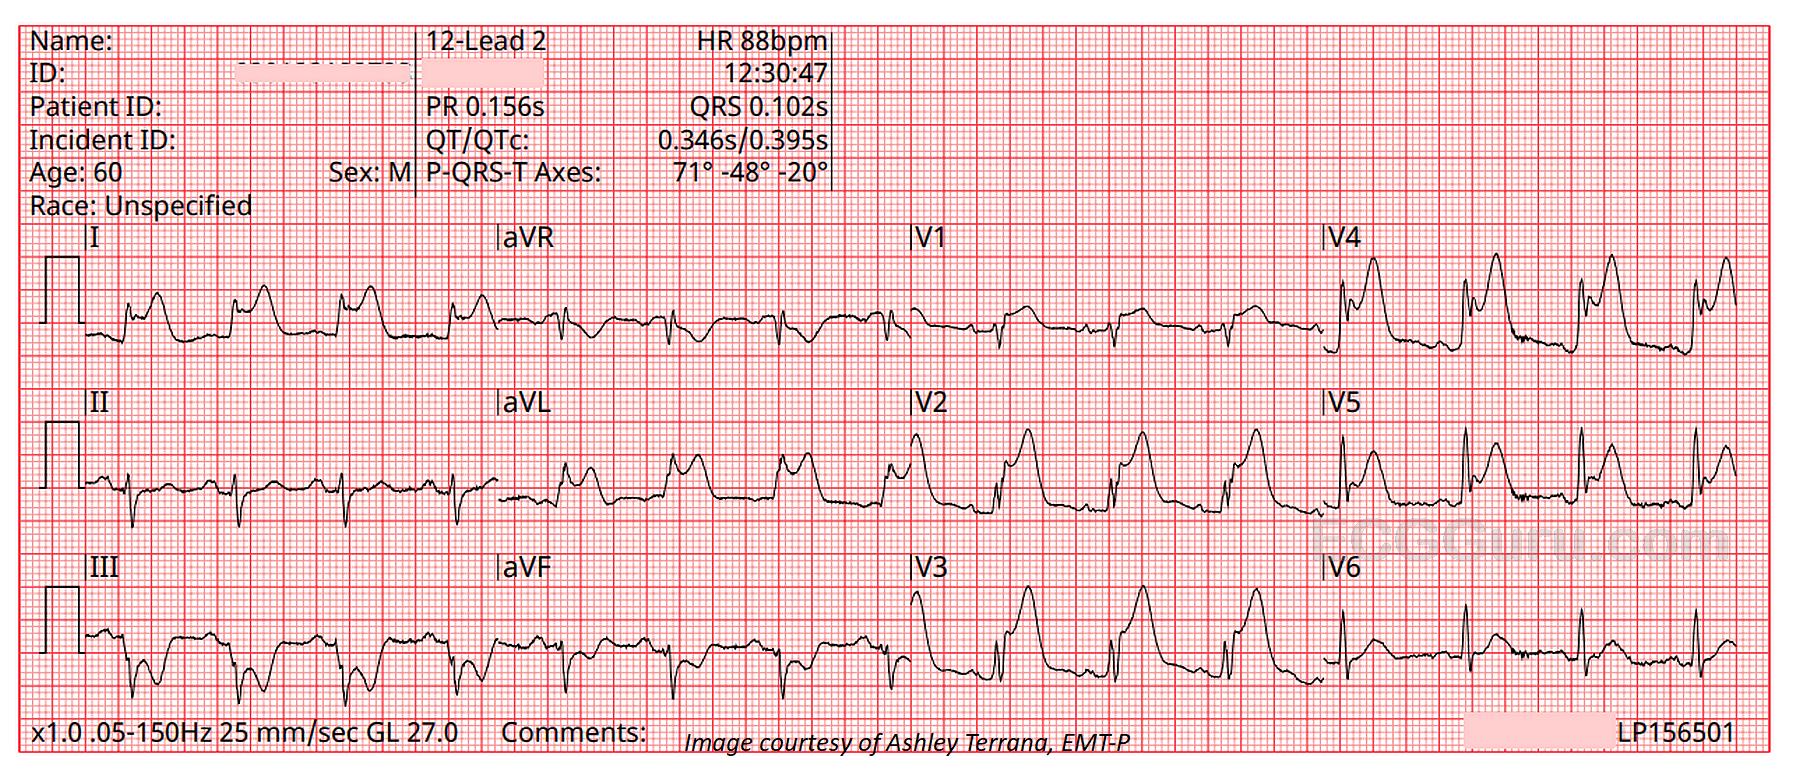
This ECG is from a 57-year-old man complaining of sub-sternal chest pain for 30 minutes.  EMS found him pale, diaphoretic, and anxious.  We don't have other clinical information or past medical history.  
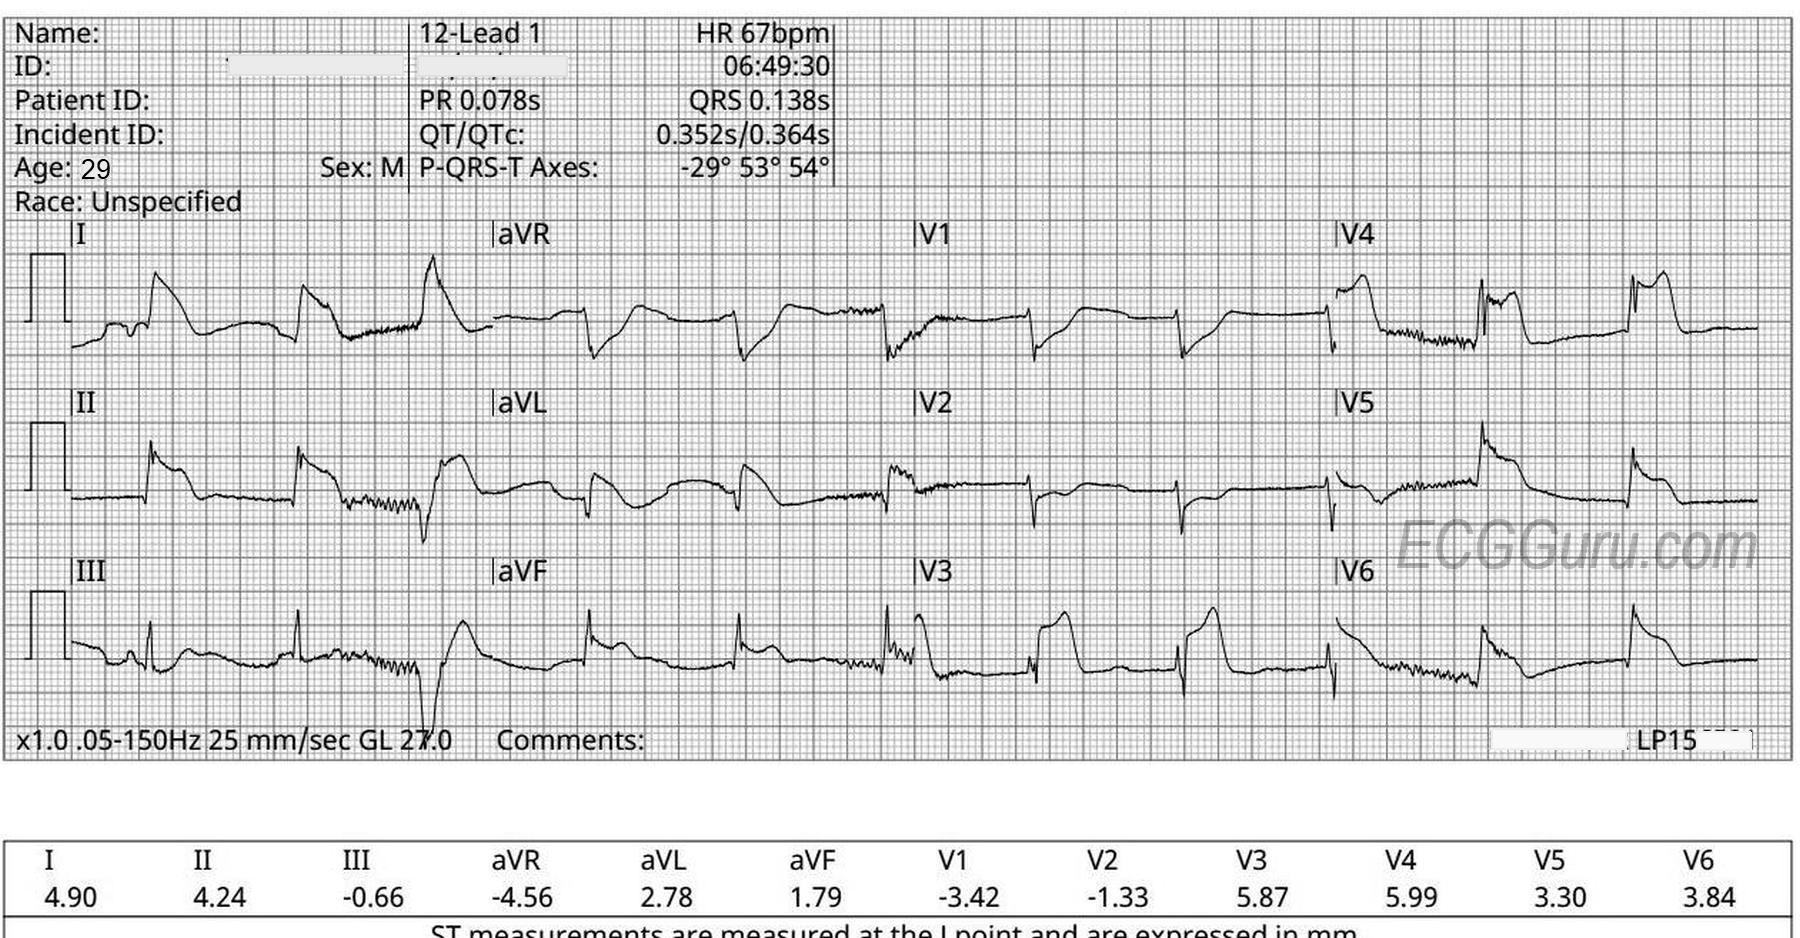
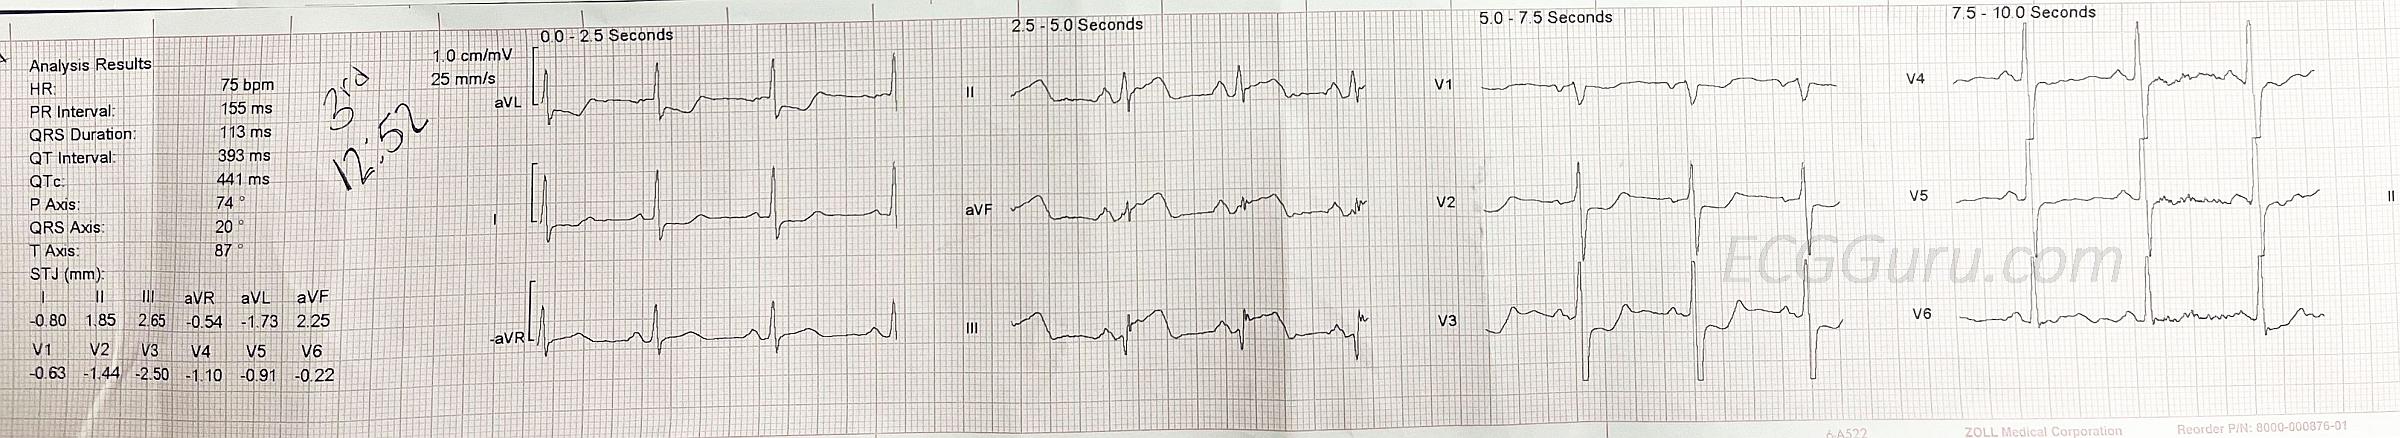
The ECG

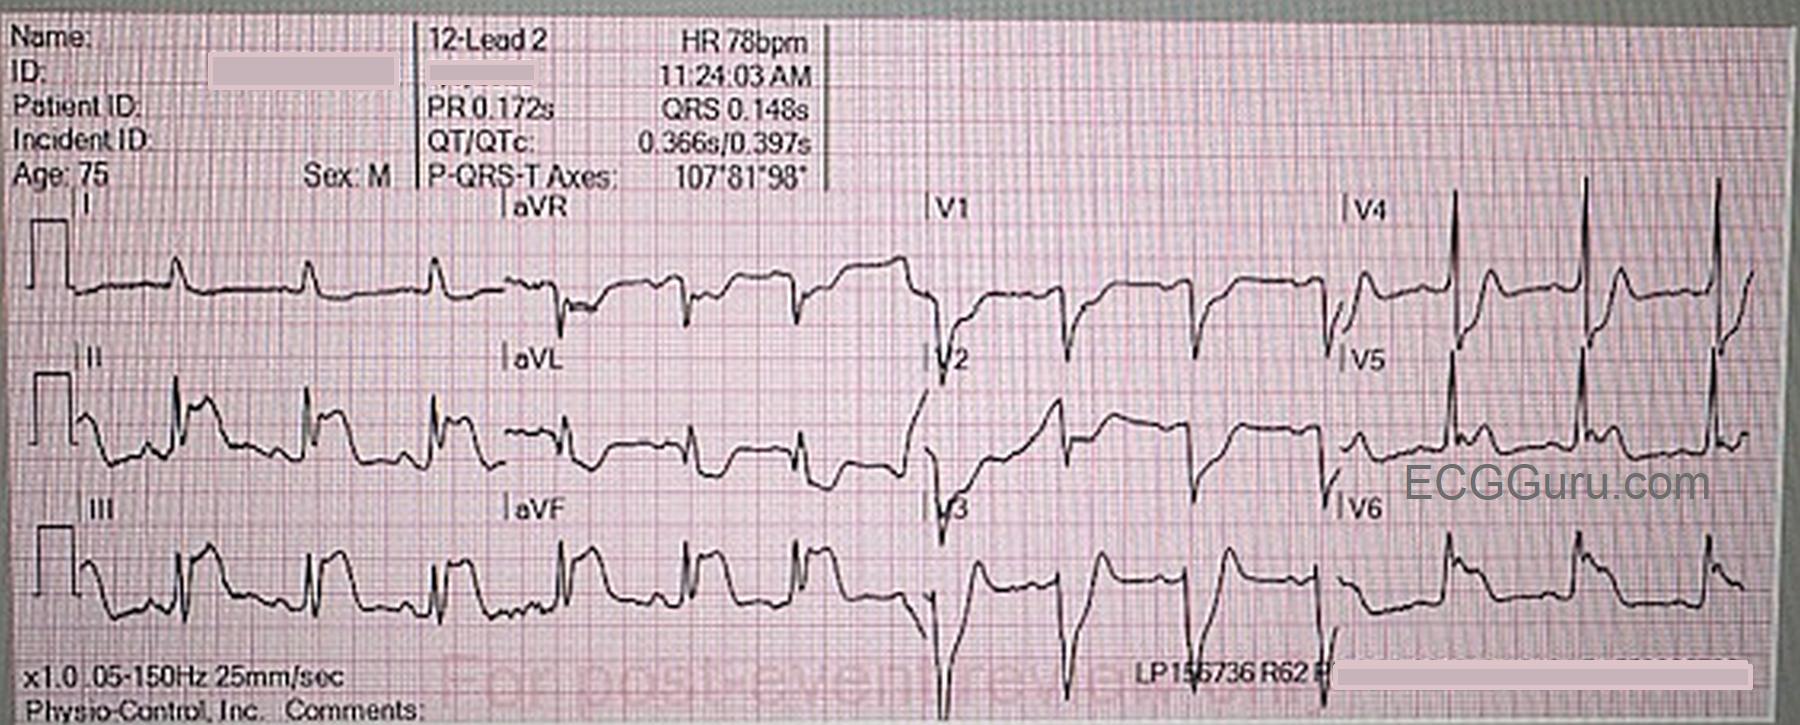
The rhythm is normal sinus rhythm at 98 bpm.   The QRS is narrow, and the PR and QTc intervals are within normal limits. In precordial leads V2 through V4, ST segments begin at a J point that is below the baseline by one small block (the computer reads all precordial leads as having a small J point depression).  From those depressed J points, there are upsloping ST segments leading into hyperacute T waves.   

This is called de Winter T wave pattern, and it is a sign of critical proximal occlusion of the left anterior descending coronary artery.  Dr. Robbert de Winter, et al, described this pattern in a letter to the editor of the New England Journal of Medicine in 2008.  Since then, it has been estimated to occur in about  2%-3.4% of acute occlusive myocardial infarctions. It has been seen in occlusions of other major arteries, but by far most cases are seen in LAD occlusion.  This should not be considered to be an "impending M.I.", but rather a STEMI equivalent, warranting emergent treatment in a cath lab. 

In this ECG, we see a curving upward of the ST segment in aVR, with very slight STE noted by the computer.  ST elevation in aVR is a common finding with proximal LAD occlusion.  There is also subtle ST elevation in I and aVL with reciprocal ST depression in II, III, and aVF without hyperacute T waves, common when the occlusion is so proximal it affects the obtuse marginal branch of the circumflex or first diagonal branch of the LAD.

The J point changes of the de Winter pattern are seen with hyperacute T waves.  T waves are considered hyperacute if they are larger than normal for the lead they are seen in.  When we say, "large", it refers more to the width of the base of the T waves, and the space contained within the T wave, although they can be quite tall sometimes.  A tall, but narrow and pointed T wave would be more indicative of hyperkalemia than of de Winter pattern. 
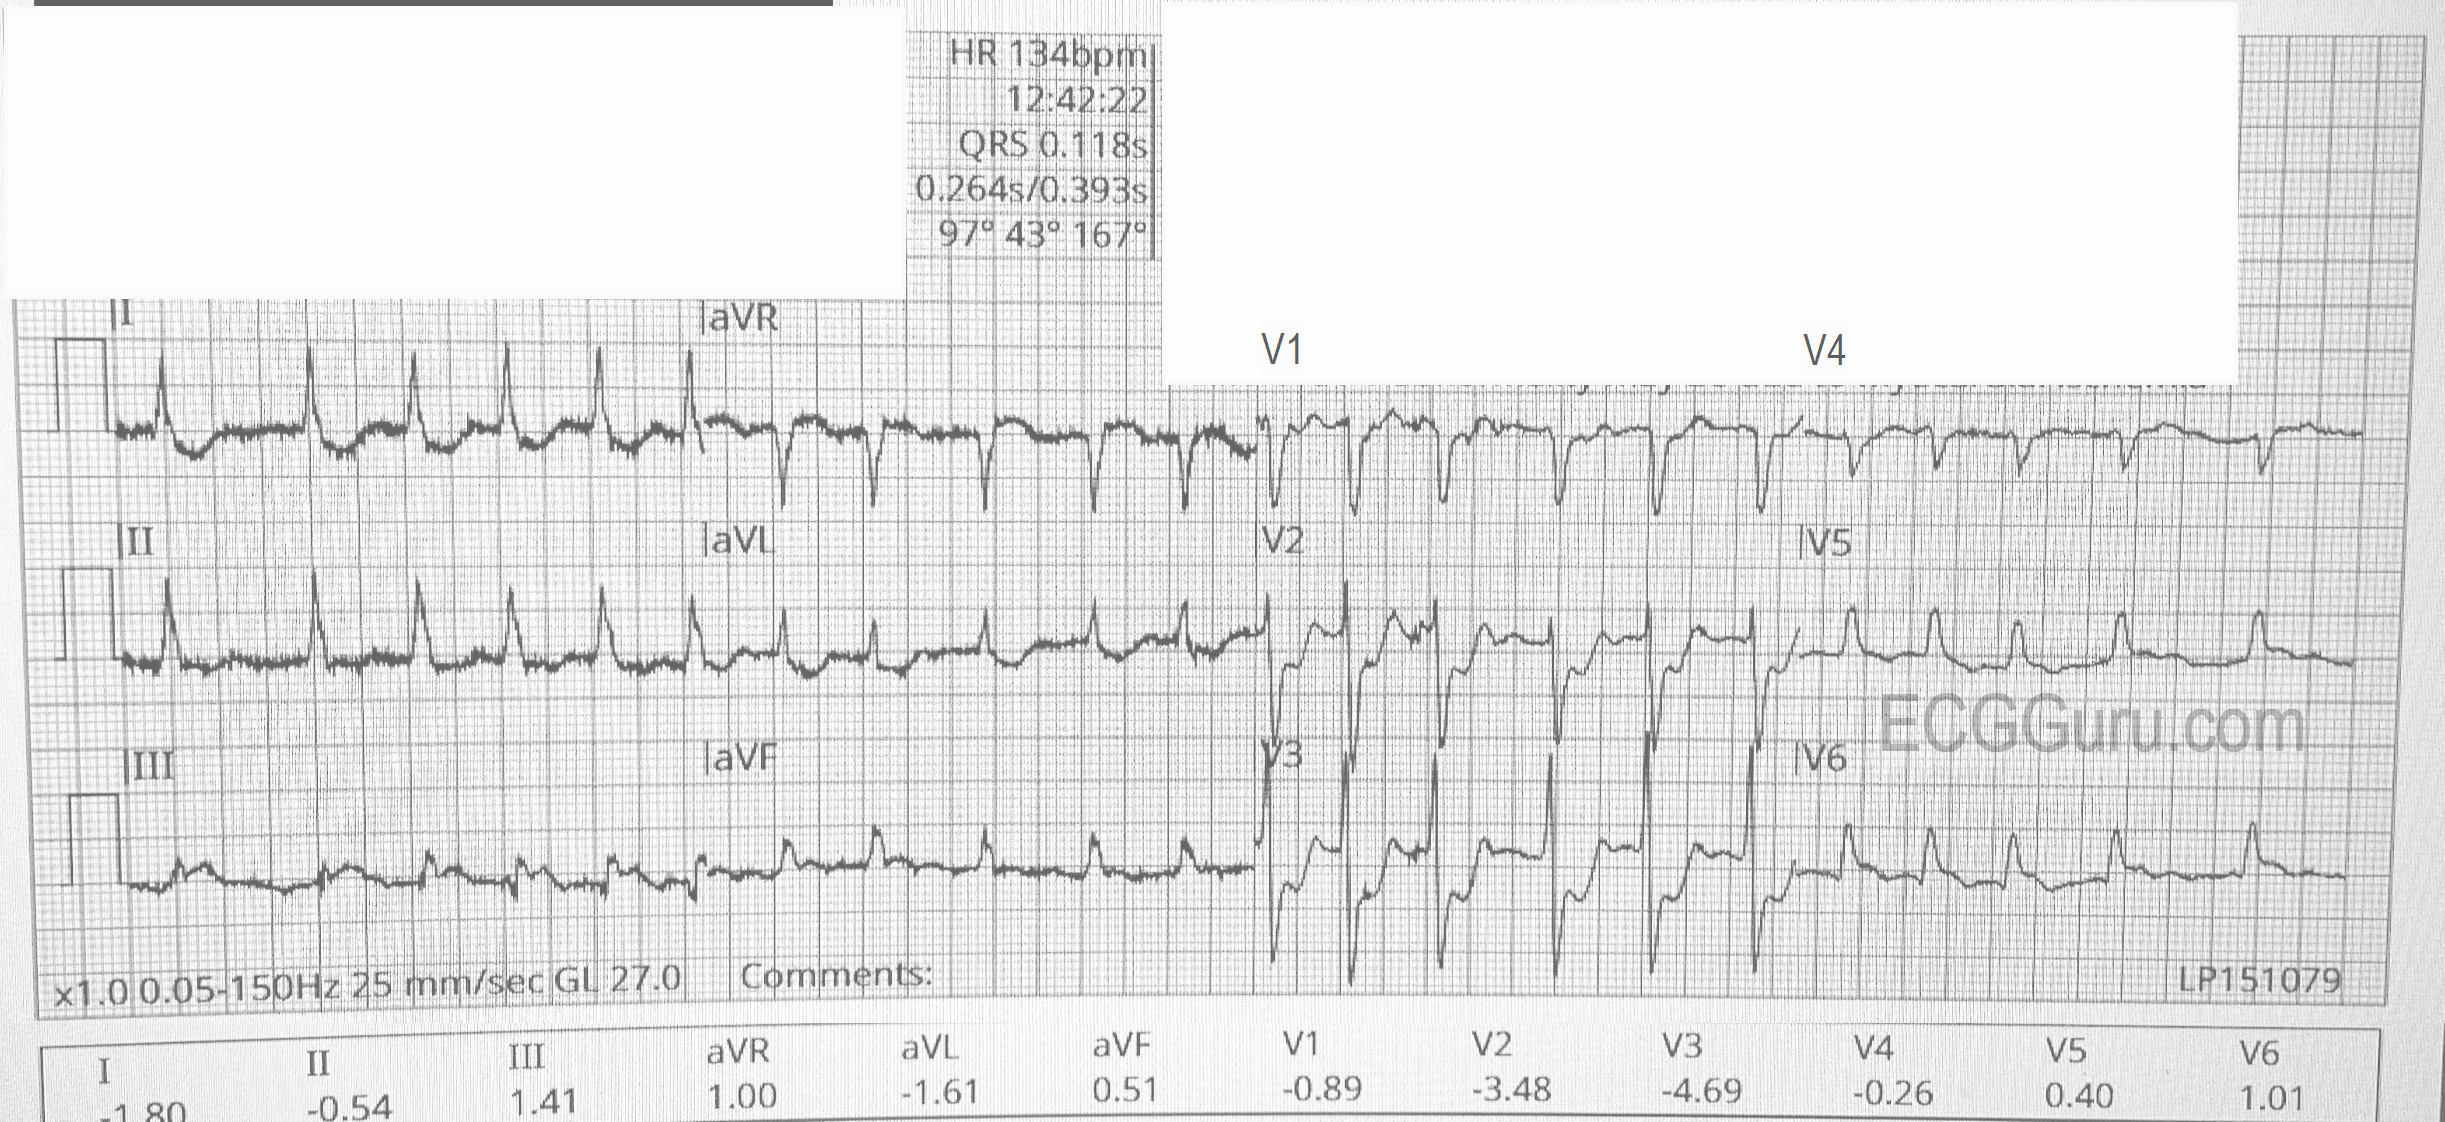
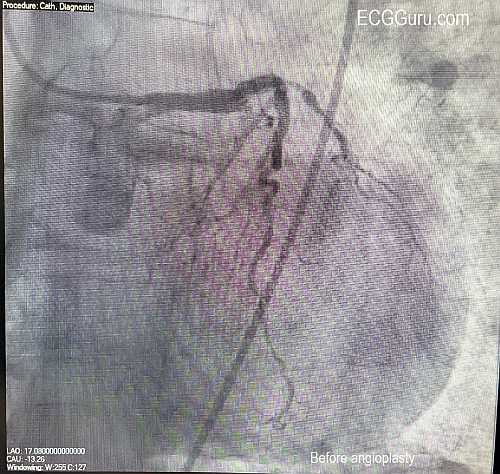
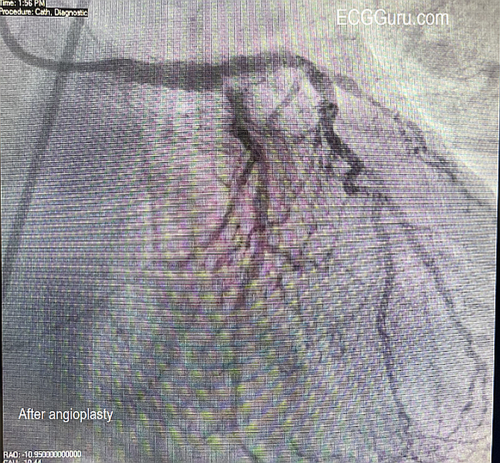
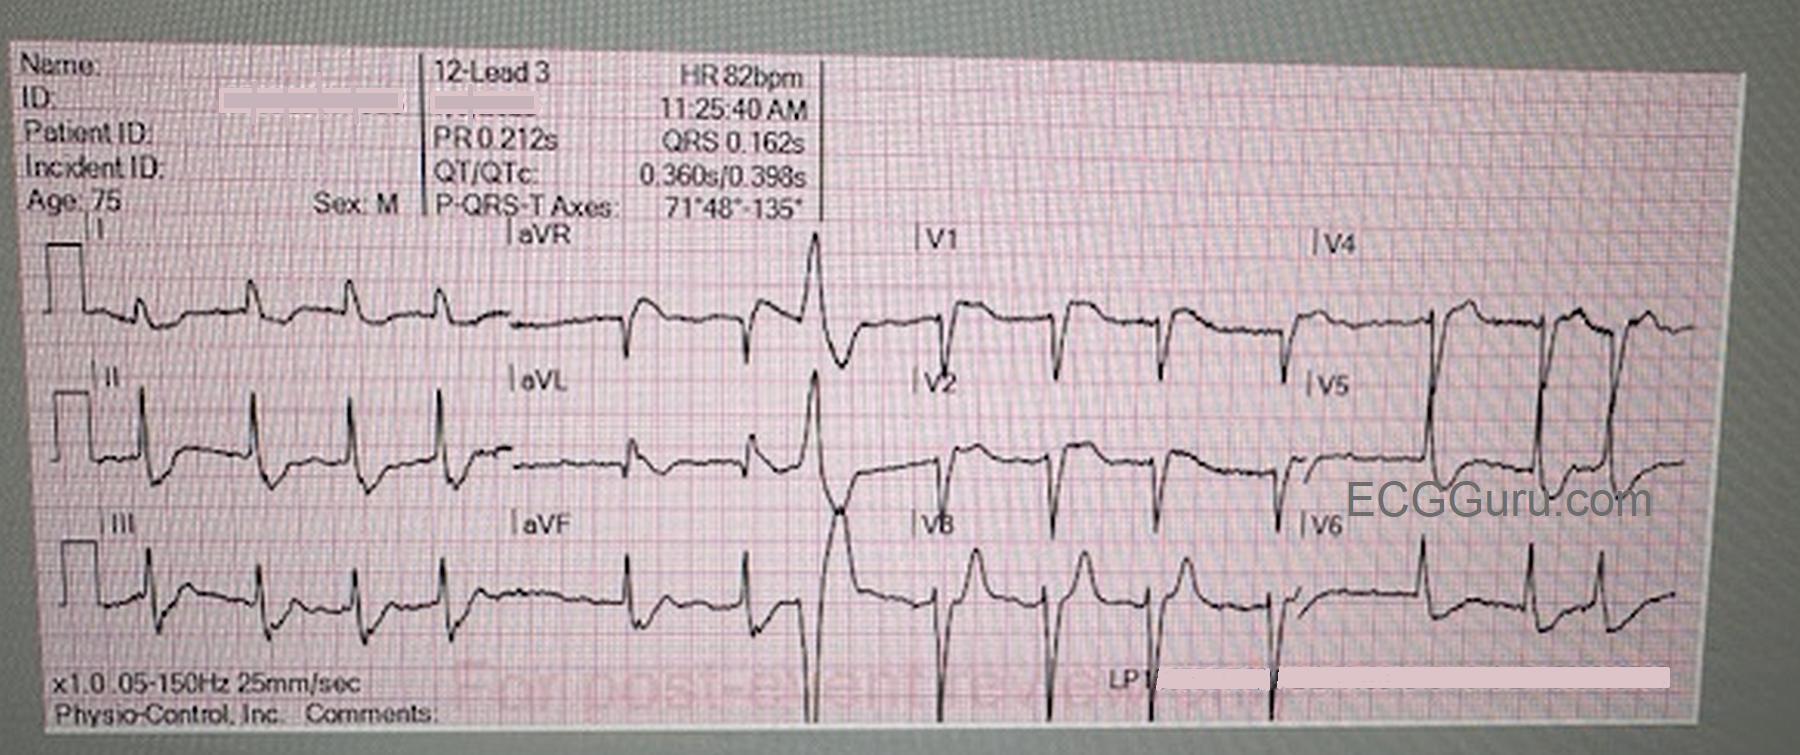
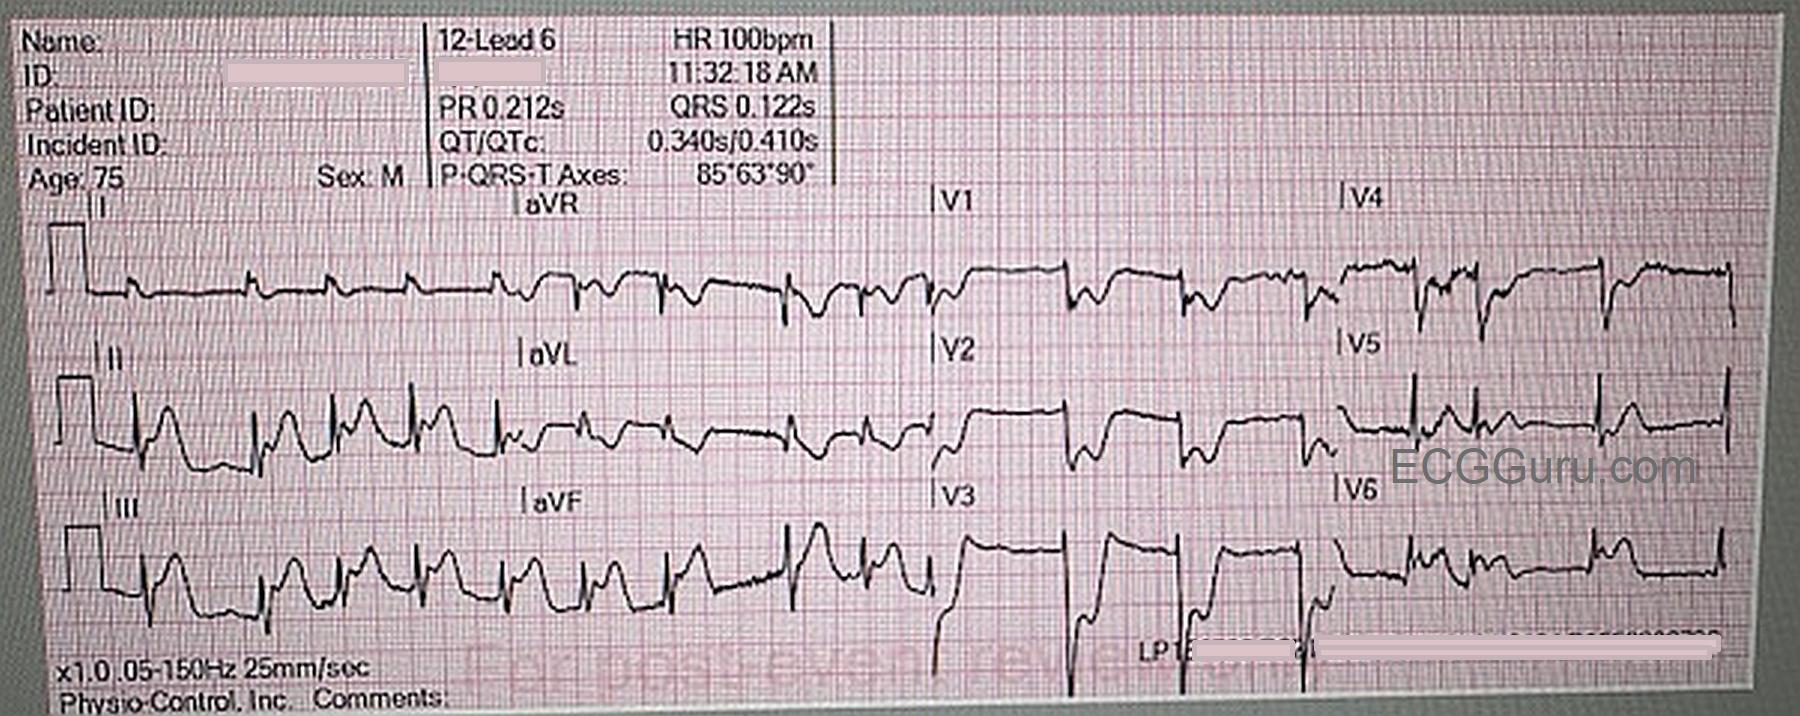
Follow up

Unfortunately, we don't have follow up information on this patient, other than he arrived at the Emergency Department alive and was scheduled for the cath lab. 

Dawn's picture

Acute Anterior-lateral STEMI

The Patient:  A 60-year-old man at work. He experienced a sudden onset of substernal chest pain, nausea & vomiting, and dizziness.  He states the pain is a 5 on 1-10 scale.  No cardiac history or current medications. 

The ECGs:  The first ECG, taken at 12:30:05, shows a sinus rhythm with ventricular bigeminy. In some leads, you can see the sinus P waves hidden in the beginnings of the PVCs, so we know the underlying sinus rhythm is about 82 bpm.

There is obvious ST elevation in V1 through V5, which is the anterior wall, an area perfused by the left anterior descending artery.  Remember – the ST elevation sign may also show in the PVCs, but because ventricular beats have secondary ST changes of their own, we should assess only the sinus beats for ST changes. 

There is also obvious ST elevation in Leads I and aVL.  This is the high lateral wall, which is perfused by the circumflex and first diagonal arteries, both proximal branches of the left coronary artery.  So, the involvement of the high lateral wall indicates a proximal lesion in the LCA – not good.  Leads III and aVF have distinct ST depression – this is a reciprocal change reflecting the ST elevation in Leads I and aVL.

Dawn's picture

Isolated Posterior Wall M.I.

This interesting case was provided by Dr. Bojana Uzelac, Emergency Medicine physician.  We are paraphrasing a translation of her comments here.

The patient is a 50-year-old complaining of chest pain.

The ECG shows a rare occurrence – an isolated POSTERIOR WALL MI (PWMI).  Note that leads V1 through V4 show the usual signs of posterior wall MI.  We see ST segment depression, which represents a reciprocal view of the ST elevation present on the posterior wall of the left ventricle.  The relatively tall, wide R waves in V2 and possibly V3 represent pathological Q waves on the posterior wall. (V2 R/S ratio > 1). What is unusual here is that there are no signs of inferior wall MI or lateral wall MI.  Posterior wall MI usually occurs in conjunction with one of these.

 PWMI is most often seen as an extension of inferior wall MI or lateral wall MI, because of shared blood supply.  Usually, it is the right coronary artery that supplies both the posterior and inferior areas of the left ventricle (about 80% - 85% of the population).  In some individuals, the circumflex artery supplies both areas. Posterior M.I. may also be seen in conjunction with lateral wall MI, when the circumflex supplies the posterior and lateral walls.  In the case shown here, only the posterior wall is involved.  Most cases of isolated PWMI involve either the circumflex or one of its marginal (OM) branches.  Only about 3.3% - 5% of all MIs are isolated PWMI.


Dawn's picture

Inferior Posterior Wall M.I. In Cabrera Format

Does something about this ECG look "different" to you?    This ECG shows a “classic” presentation of inferior-posterior M.I. when it is caused by a lesion in the right coronary artery (RCA). There are ST elevations in leads II, III, and aVF.  Reciprocal ST depression is seen in Leads I and aVL.  There is also reciprocal ST depression in Leads V1 – V3.  These more rightward anterior leads are reciprocal to the posterior (or posterior-lateral) wall, so the ST elevation is actually posterior.  Another sign that this is an RCA lesion is that the ST elevation in Lead III looks worse than the STE in Lead II.  It would be helpful to check the right precordial leads, or at least V4 Right, as elevation there would indicate right ventricular M.I. 

Depending on how experienced you are at evaluating ECGs, you might have immediately noticed something “different” about this tracing.  It is printed in Cabrera format, which groups the leads (viewpoints) more geographically than a traditional ECG does.  In addition to grouping the leads more geographically, instead of aVR, the machine records - aVR.  That reverses the negative and positive poles of aVR, putting the positive ("seeking") electrode at 30 degrees - halfway between Leads I and II.   Those of us who have been looking at ECGs for decades often feel a bit disconcerted by this format, because we have developed almost an intuitive way of seeing the ECG as a “map”, and this rearrangement thwarts our brains’ approach to the ECG.  I would imagine, however, that this might make interpretation a bit easier for someone who is not prejudiced by the standard way of printing.  This method is especially helpful when looking for inferior wall M.I., as we see here, because the lateral leads are together in a row, and the inferior leads are grouped together. 

All our content is FREE & COPYRIGHT FREE for non-commercial use

Please be courteous and leave any watermark or author attribution on content you reproduce.