Displaying 1 - 10 of 16
Dawn's picture

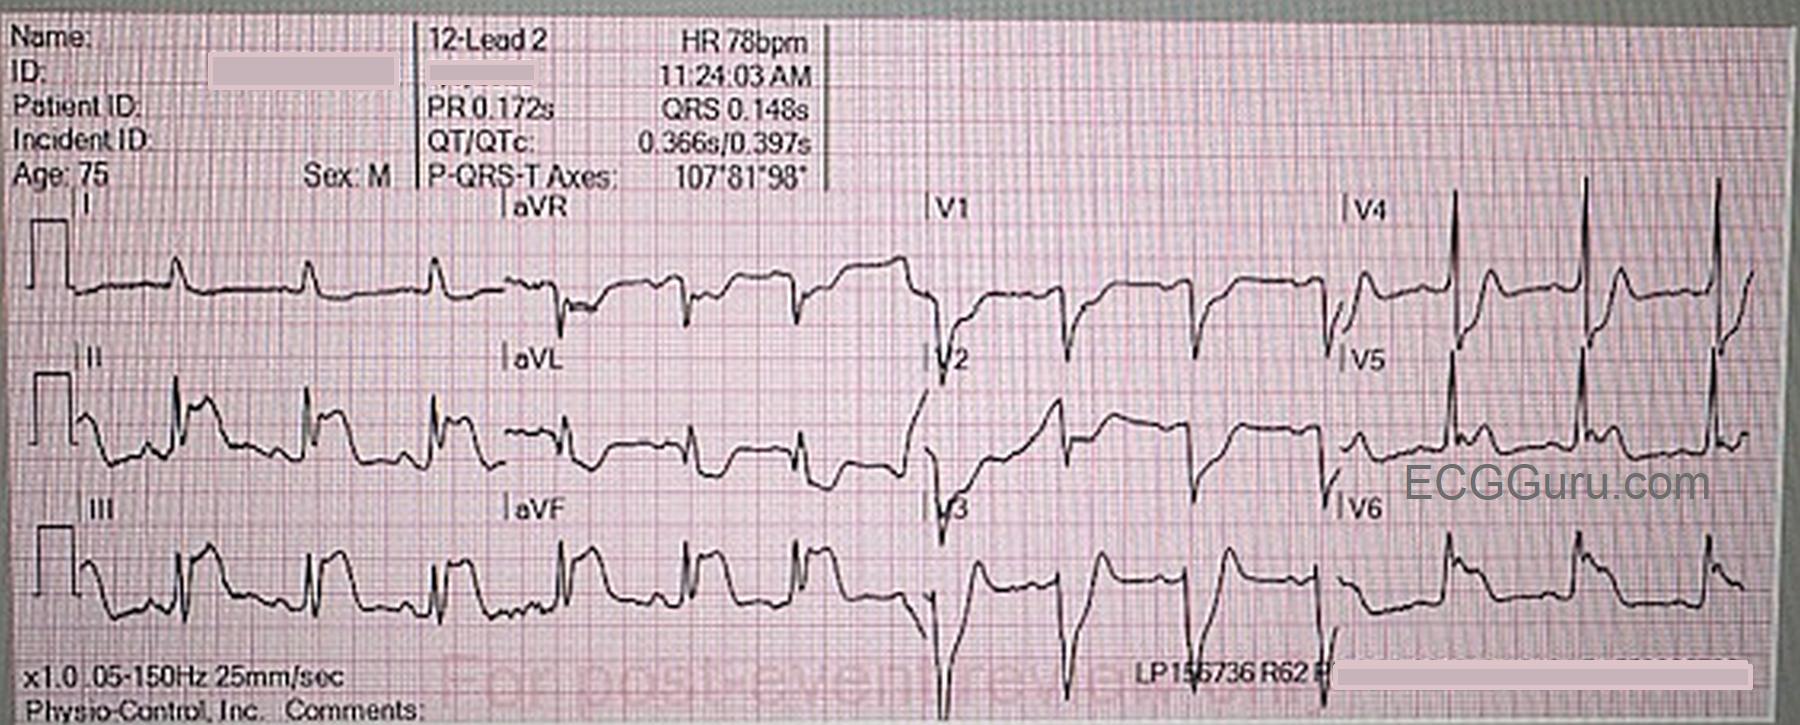
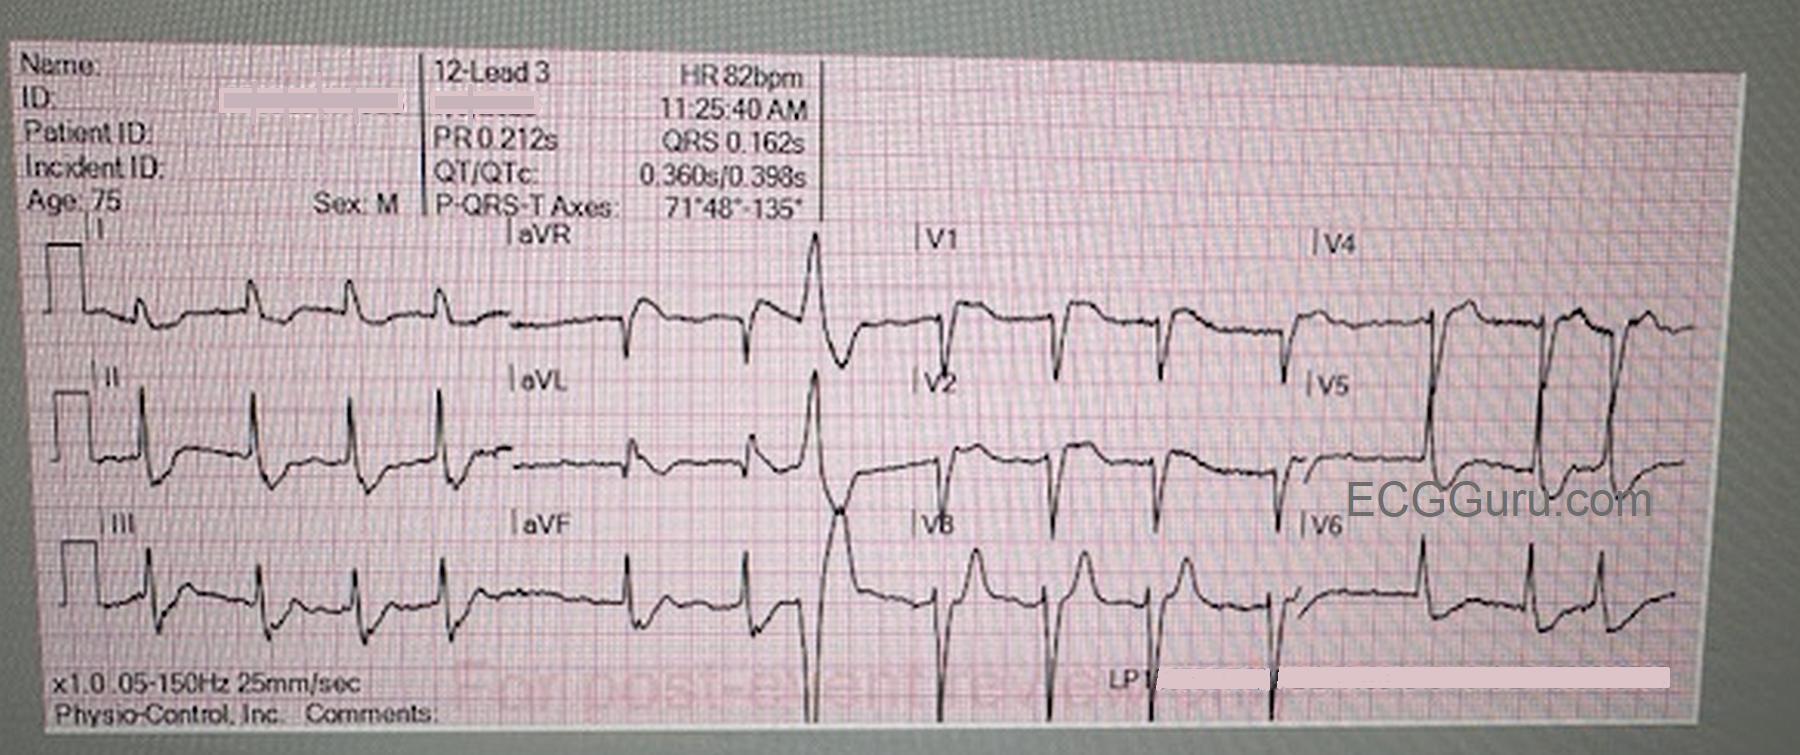
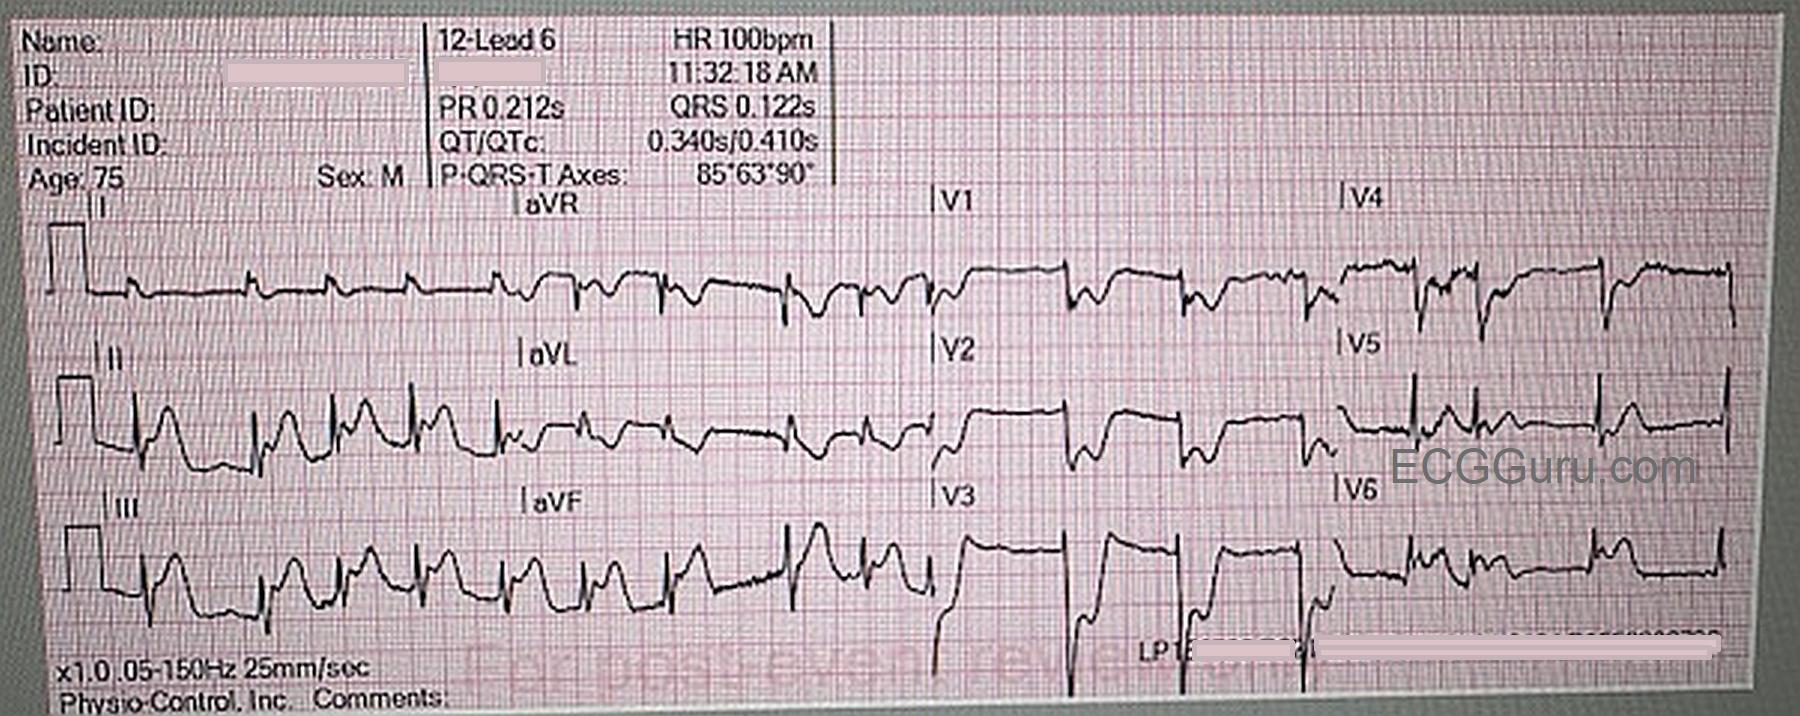
OMI With Dominant Circumflex Artery

The Patient:  A 75-yr-old man called Emergency Services because of chest pain and shortness of breath. He had just returned from a 15-mile bicycle ride, during which he had to stop several times to catch his breath, not normal for him.  He was so diaphoretic, they were not able to get a good 12-lead ECG. While the paramedics were assessing him and preparing for transport, he went into ventricular fibrillation. He was defibrillated at 360 joules within seconds of onset, and converted to sinus rhythm with pulses.

The ECGs:

11:24 am:  This ECG is obtained after defibrillation, and there is return of spontaneous circulation (ROSC).   The rhythm is sinus at 78 bpm.  The QRS is slightly wider than normal at .12 seconds. (It is my opinion that the ECG machine read the QRS wider because of the J point and ST changes.) Other intervals and frontal plane axis are within normal limits. R wave progression is normal.

There is marked ST elevation in Leads II, III, & aVF, with reciprocal ST depression in Leads I, aVR, & aVL. (inferior wall transmural injury). There is ST elevation in V5 and V6 (low lateral transmural injury), and ST depression in V1 through V4 (posterior-lateral transmural injury with reciprocal changes in these leads.)

Dawn's picture

Complete AV Block

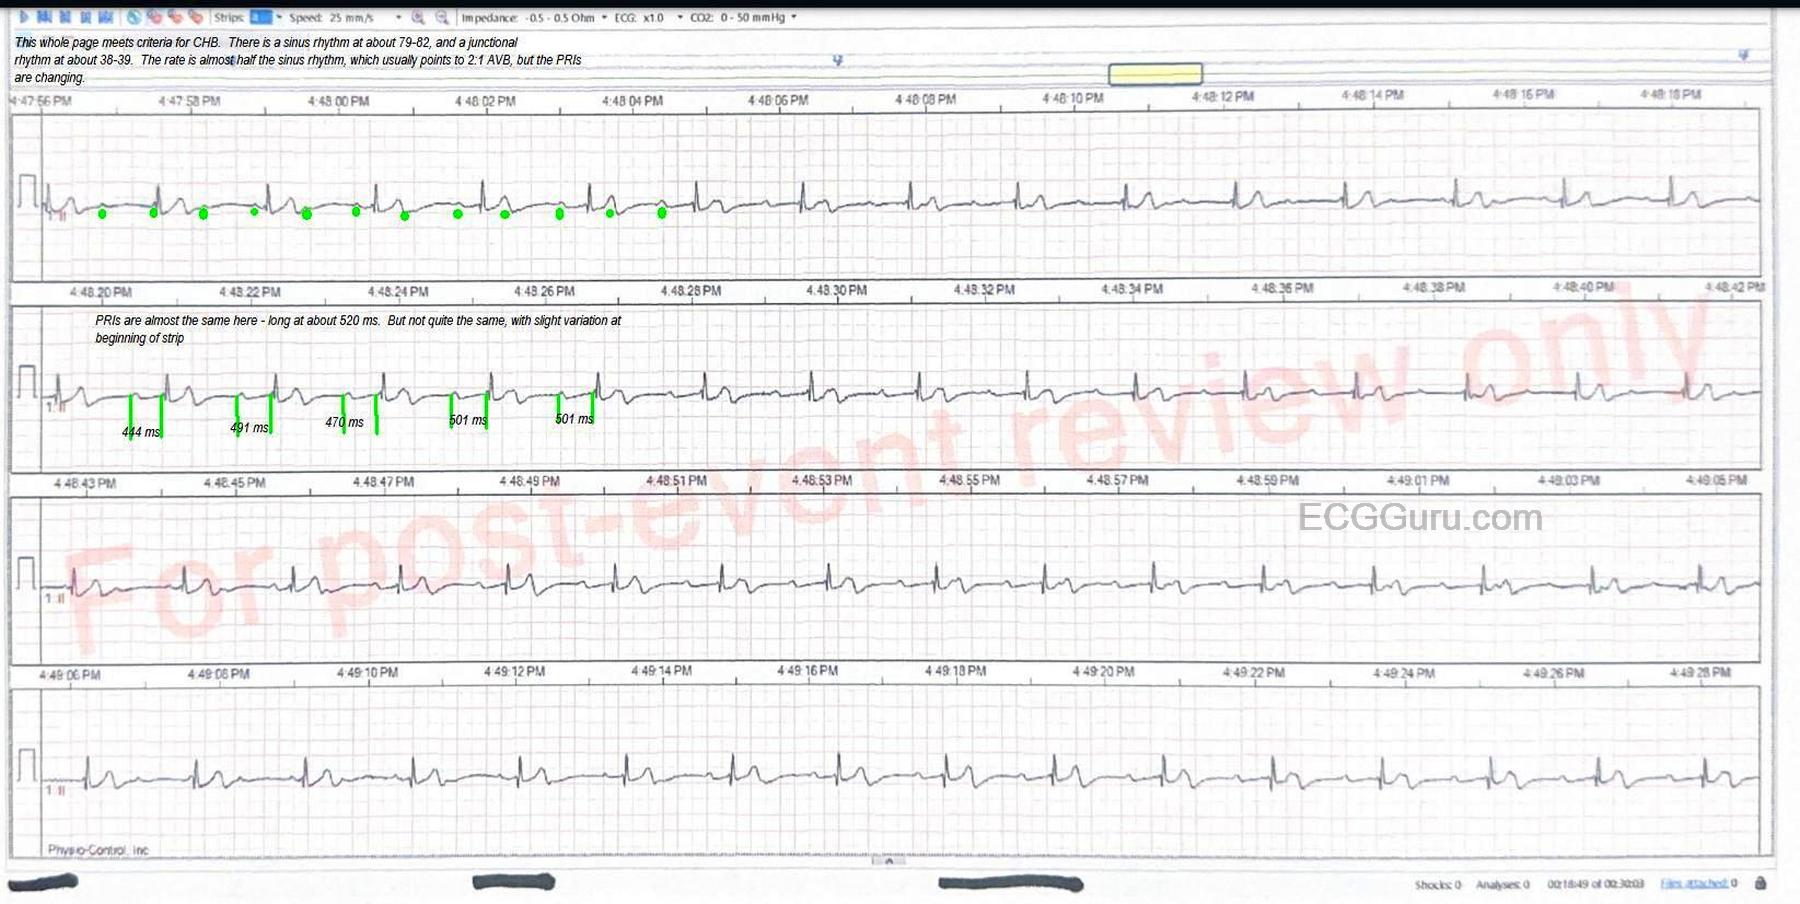
This is an interesting case for your students who want to delve into dysrhythmias with an eye on detail.  It is also a good teaching case for discussing treatment options when the diagnosis may be uncertain or controversial.  I will start the discussion by admitting that I am not an expert of electrophysiology or complex dysrhythmias. My approach has always been more clinical  - how is this rhythm affecting the patient and what are the chances it will deteriorate?  I hope some of our dysrhythmia Gurus will delve into the rhythm and maybe even provide laddergrams.

The patient:  This is a man in his seventies who complains of light-headedness for several days, and feeling worse today, prompting an emergency call. He offers no cardiac history.  BP 116/62 and 116/58.  Blood glucose 220 mg/dL.   Physical exam unremarkable. 

12-Lead ECG :  I will admit that, on first quick glance, I thought I was looking at a 2:1 AV block.  But on closer inspection, I noted that the "PR intervals" varied, becoming shorter as the strip progressed.  Another 12-lead on the same patient showed even more pronounced variations.  The atrial rate is about 76 bpm (measured with a digital caliper).  The atrial rhythm is fairly regular (allowing for slight variations in sinus rhythm).  The ventricular rate is around 39 bpm, almost exactly half that of the atrial rate. This rhythm is also regular.  Because of the PRI interval changes, I believe this is complete AVB with an escape rhythm that is just about half the atrial rate.  If that is correct, the ventricular rhythm originates in the AV junction, because the QRS complexes are narrow, and the rate is very near 40 bpm.  The frontal plane axis is slightly leftward, within normal range, and the R wave progression in the chest leads shows a late transition, with patholoogical Q waves in V1.  There are also Q waves in III and aVF.

There are ST and T wave changes in Leads I, aVL, V1, V2, and V3.  I do not know if this patient has a history of cardiac disease or a recent complaint of chest pain, but T wave inversion and some biphasic T waves makes me think of reperfusion changes, reflecting a recent M.I.  The ST segments in leads with T wave changes are also uncomfortably straight.  We do not have followup on this patient's hospital course or treatment.

I have included a rhythm strip with some markup for those who would like to really get into the mechanism of this rhythm.  For myself, as a retired ER RN and paramedic, I think of the clinical ramifications of such a rhythm.

1)  Is this rhythm the result of OMI?  This would demand further investigation, probably with a temporary transvenous pacemaker as a safeguard measure.

Dawn's picture

Anterior M.I. and Left Ventricular Hypertrophy

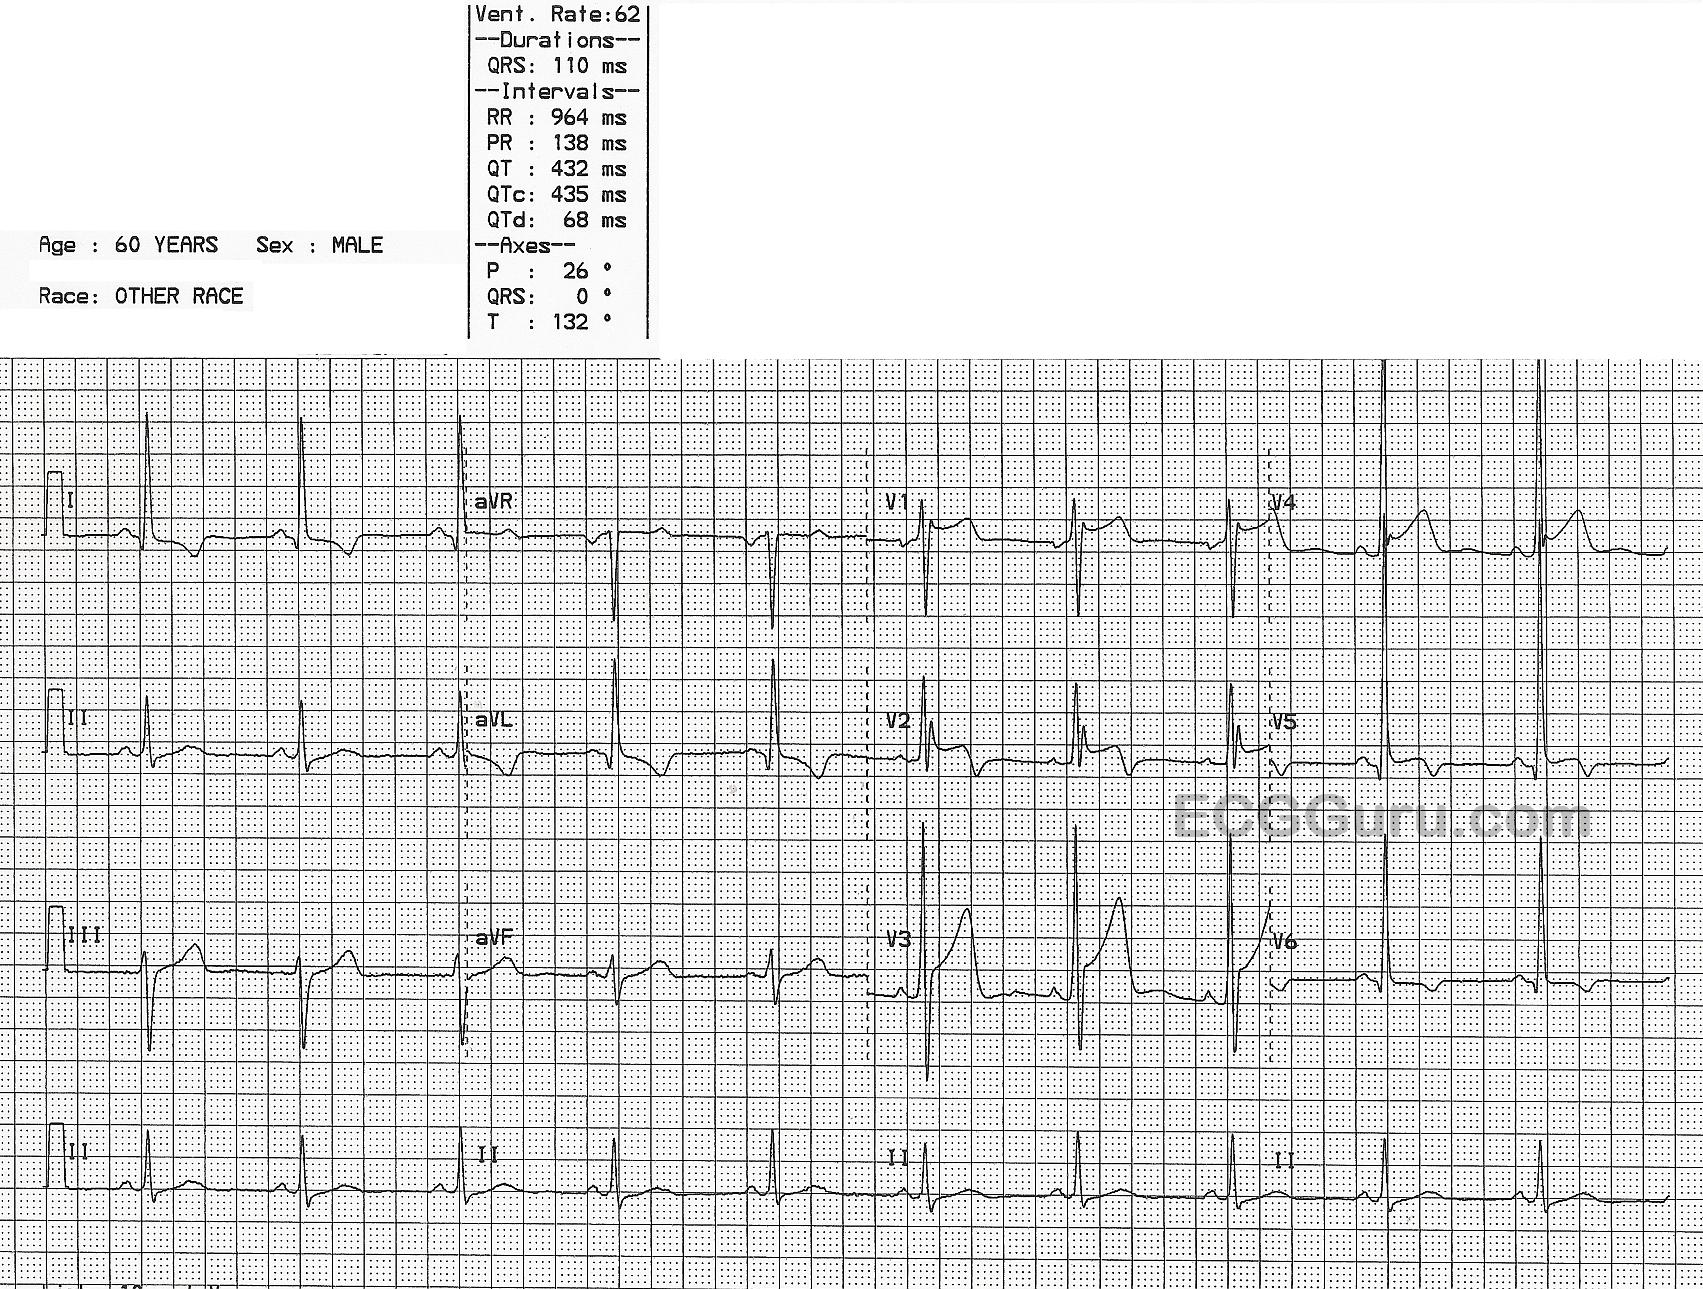
The Patient:  Sixty-year-old man with a complaint of severe substernal chest pain. Denies hx of M.I., but reports feeling short of breath on exertion for about a year.  Hx of hypertension, but admits he is non-compliant with his medication.  Appears pale and diaphoretic, BP 110/68.

The ECG:  The rhythm is sinus at 62 bpm.  The QRS is slightly wide at 110 ms (.11 seconds), but still within normal limits.  The intervals are WNL.  The frontal plane axis is slightly leftward, while still normal.  The QRS complexes are tall, especially on the left side.  The voltage meets criteria for left ventricular hypertrophy (LVH). This is also called left ventricular enlargement (LVE).  There are several accepted criteria for determining LVH, and this ECG meets them all.  The V1 S wave plus the V5 R wave equal 52 or 52 mm. There is a slightly increased R wave peak time in V5 and V6 (normal is about one small block).  There is ST depression and T wave inversion in the lateral leads: I, aVL, V6.  This is called the "strain" pattern.  V5 is also a lateral lead, but something else is preventing ST depression.

Note the ST elevation in V1 through V5.  This is acute transmural ischemia, or ST elevation M.I.  The STE in V5 was enough to overcome the STD caused by the LVH. The more modern term for these ECG changes is “OMI”, or occlusion myocardial infarctionhttps://litfl.com/omi-replacing-the-stemi-misnomer/  This term replaces "STEMI", as it includes myocarial injury with ST elevation and also with other ECG findings that are classified as "STEMI Equivalents". 

We don't have information regarding the patient's outcome, but it is worth mentioning that the BP of 110/68 is probably low for him, and he has poor peripheral perfusion, evidenced by his pale skin and sweating.

Dawn's picture

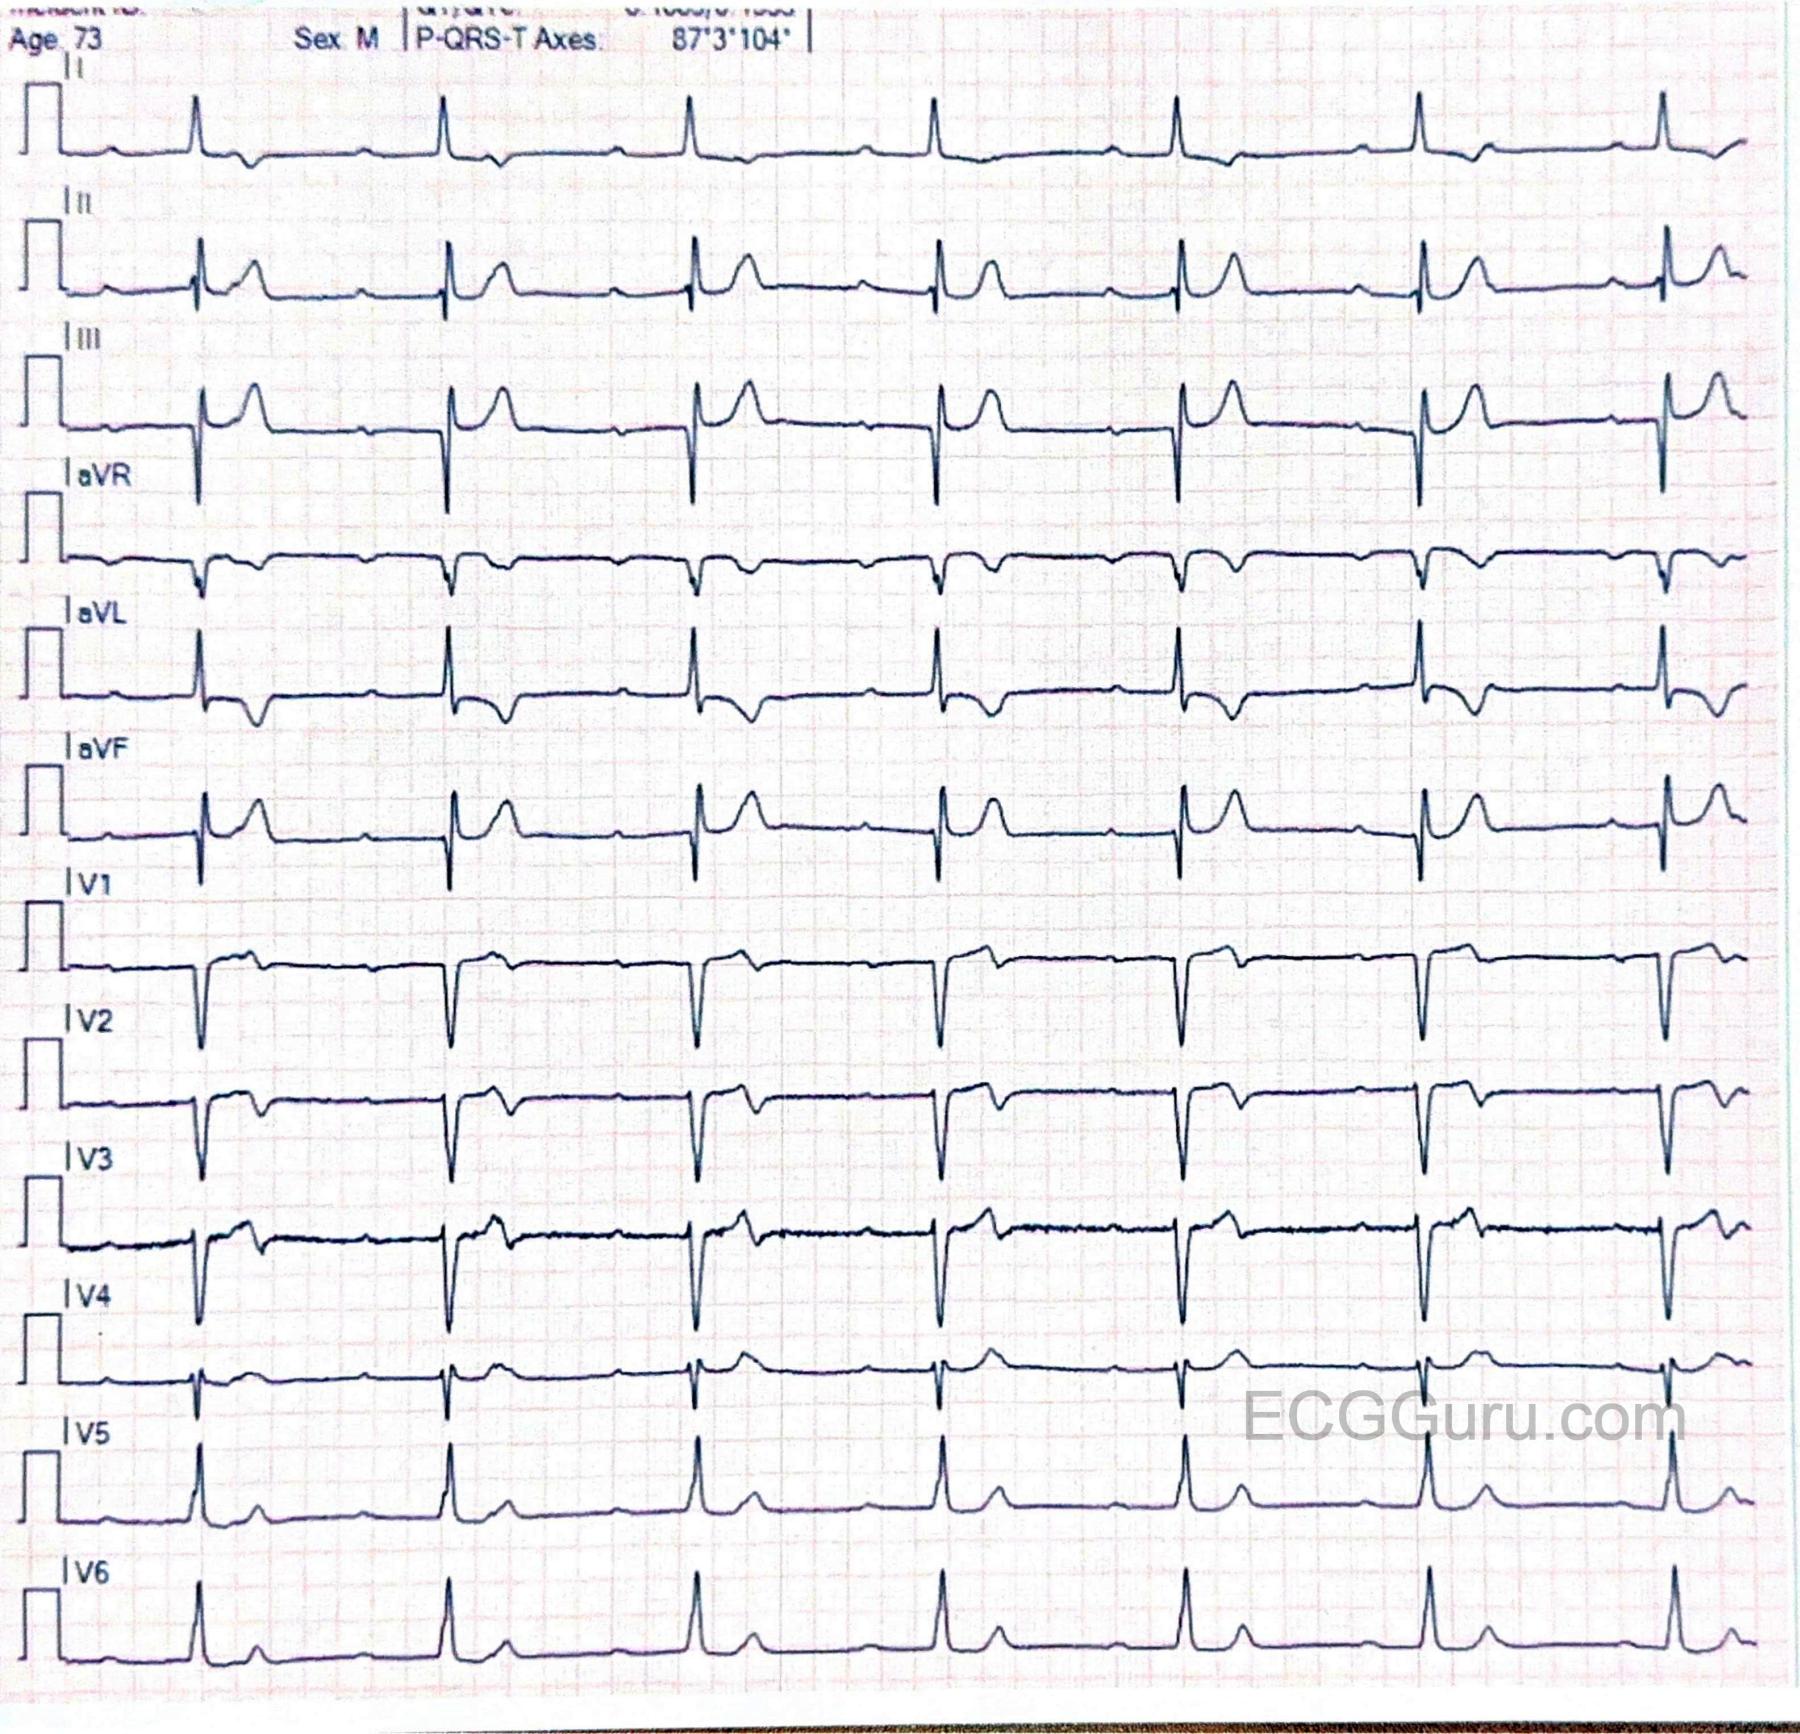
Inferior Wall M.I.

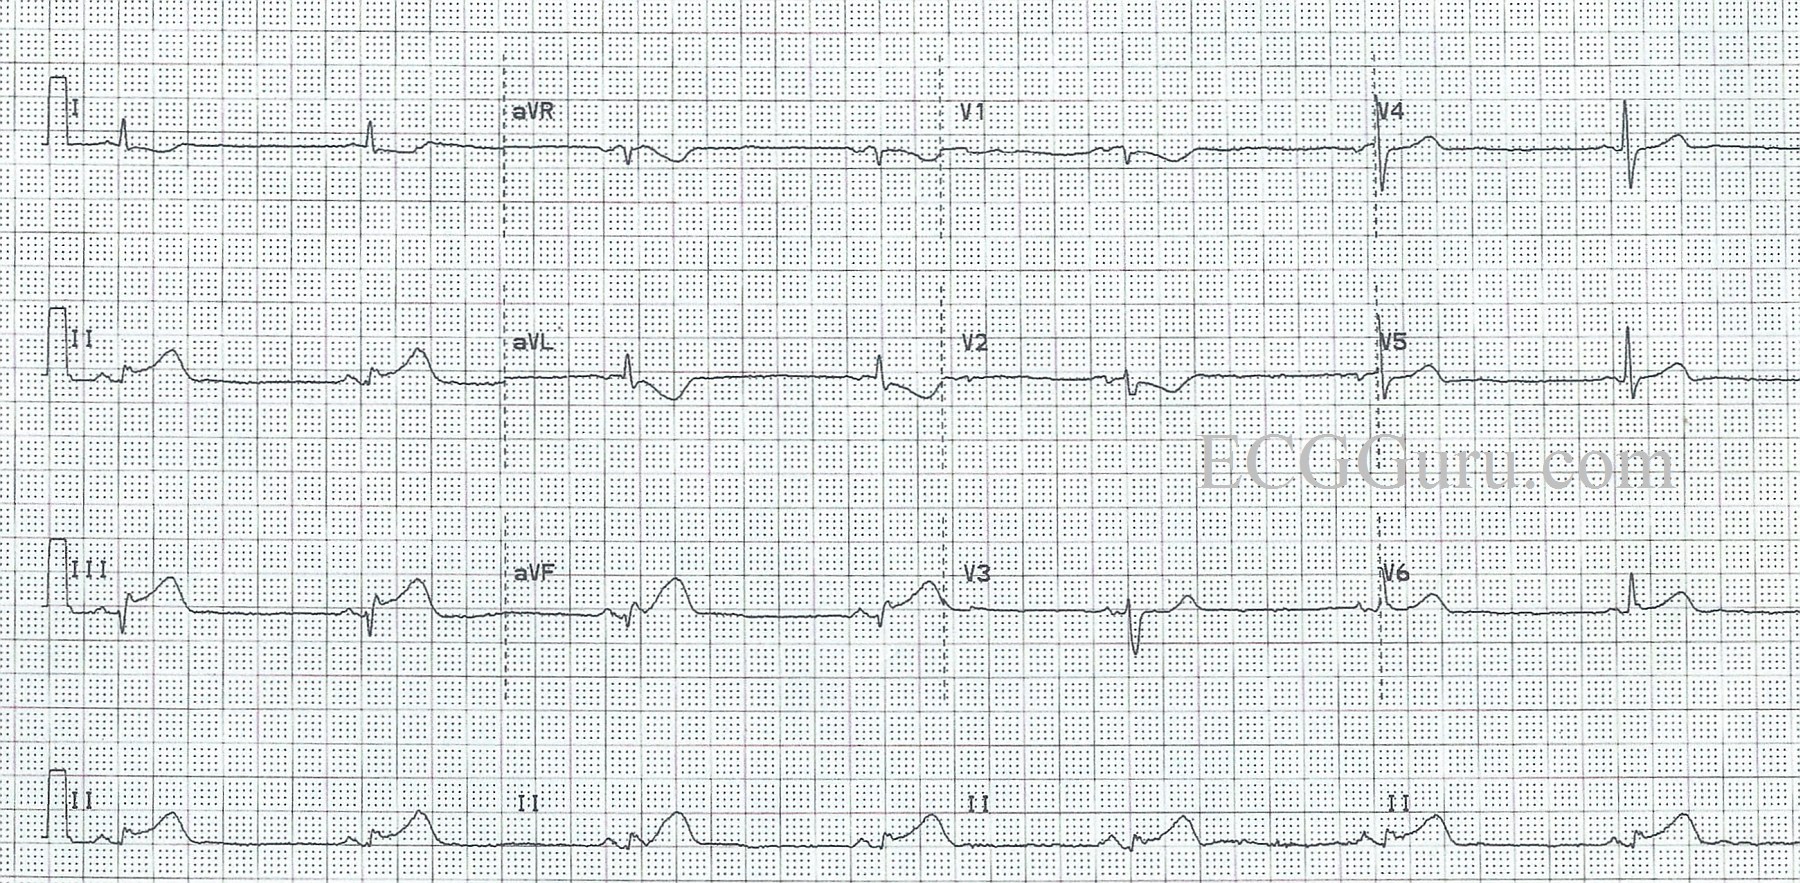
This ECG shows a common manifestation with inferior wall M.I., BRADYCARDIA.  We see the signs of acute inferior wall M.I. in the inferior leads:  II, III, and aVF all have ST segment elevation.  There almost appear to be pathological Q waves in Leads III and aVF.  There are still VERY tiny r waves, and the downward deflections are not wide, but should full-blown Q waves develop in these leads, they would signify necrosis in the area.  A repeat ECG would certainly be warranted. 

Another sign that there is an inferior wall STEMI is the ST segment depression in Leads I and aVL, which are reciprocal to Lead III.  ST depression can have many meanings, but when it is localized in the leads which are opposite ST elevation, it is reciprocal.  There is also ST depression in Leads V1 and V2.  These leads are reciprocal to the POSTERIOR wall, otherwise known as the upper part of the inferior wall.  If an inferior wall M.I. is large enough, it can produce ST elevation in the posterior leads (not performed in this case), and ST depression in the anterior leads, especially V1, V2, and V3. 

The rhythm is a marked sinus bradycardia, at just under 40 beats per minute.  Sinus bradycardia is very common in inferior wall M.I., because the inferior wall and the sinus node are usually both supplied by the right coronary artery.  AV blocks can also occur because the AV node is also supplied by the RCA in most people. 

It is important to remember that bradycardia does not always need to be treated.  In patients with acute M.I., a well-tolerated bradycardia may actually be beneficial to the injured heart, reducing supply/demand ischemia.  A well-tolerated bradycardia is a rate that does not produce low blood pressure and poor peripheral perfusion.  Some people tolerate rates in the 40’s quite well.  If the patient shows signs of poor perfusion: low BP, decreased mentation, pallor, shortness of breath, the rate should be cautiously increased with medication or electronic pacing.  


Dawn's picture

Acute Inferior-Lateral M.I. In A Patient With A Dominant Circumflex Artery

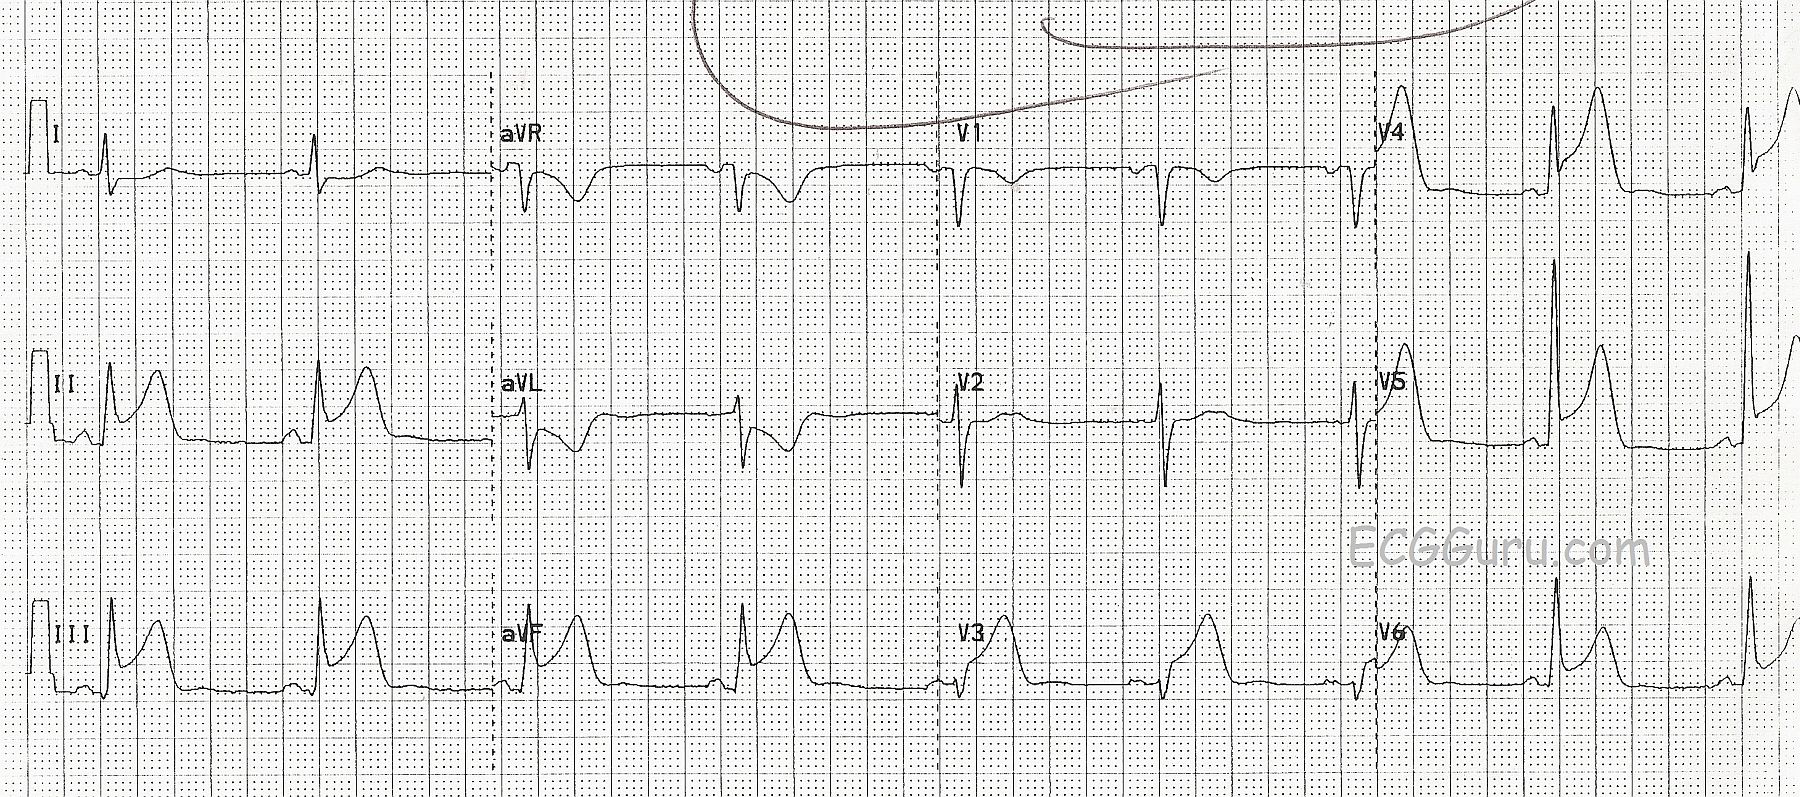
This ECG was obtained from a patient who suffered an obstruction of the circumflex coronary artery.  Unfortunately, he was in the approximately 15-18% of the population in whom the circumflex artery is dominant.  That means that it connects with the posterior descending artery, perfusing not only the lateral wall of the left ventricle, but also the posterior and inferior walls.  In this case, the obstruction is in the midportion of the artery, and the high lateral wall is spared.  The large number of leads with ST elevation indicate the large amount of myocardium affected.  Leads II, III, and aVF have ST elevation, as do Leads V3 through V6.  Lead aVL has reciprocal ST depression. The T waves in the affected leads are "hyperacute", or taller than normal.  This is usually an early change in acute M.I., and disappears after the onset of ST elevation.

It is not always easy to determine from the ECG that the circumflex artery is the culprit artery, rather than the right coronary artery, which perfuses the inferior wall in the majority of people.  Some clues are:  Lead III has ST elevation equal to that of Lead II, the low lateral wall (V5 and V6) are affected, and aVL has reciprocal depression but Lead I does not.

This is a very large M.I., due to the dominance of the circumflex artery.  The patient did not survive, in spite of aggressive treatment.

Dawn's picture

Inferior Wall M.I. and Right Bundle Branch Block

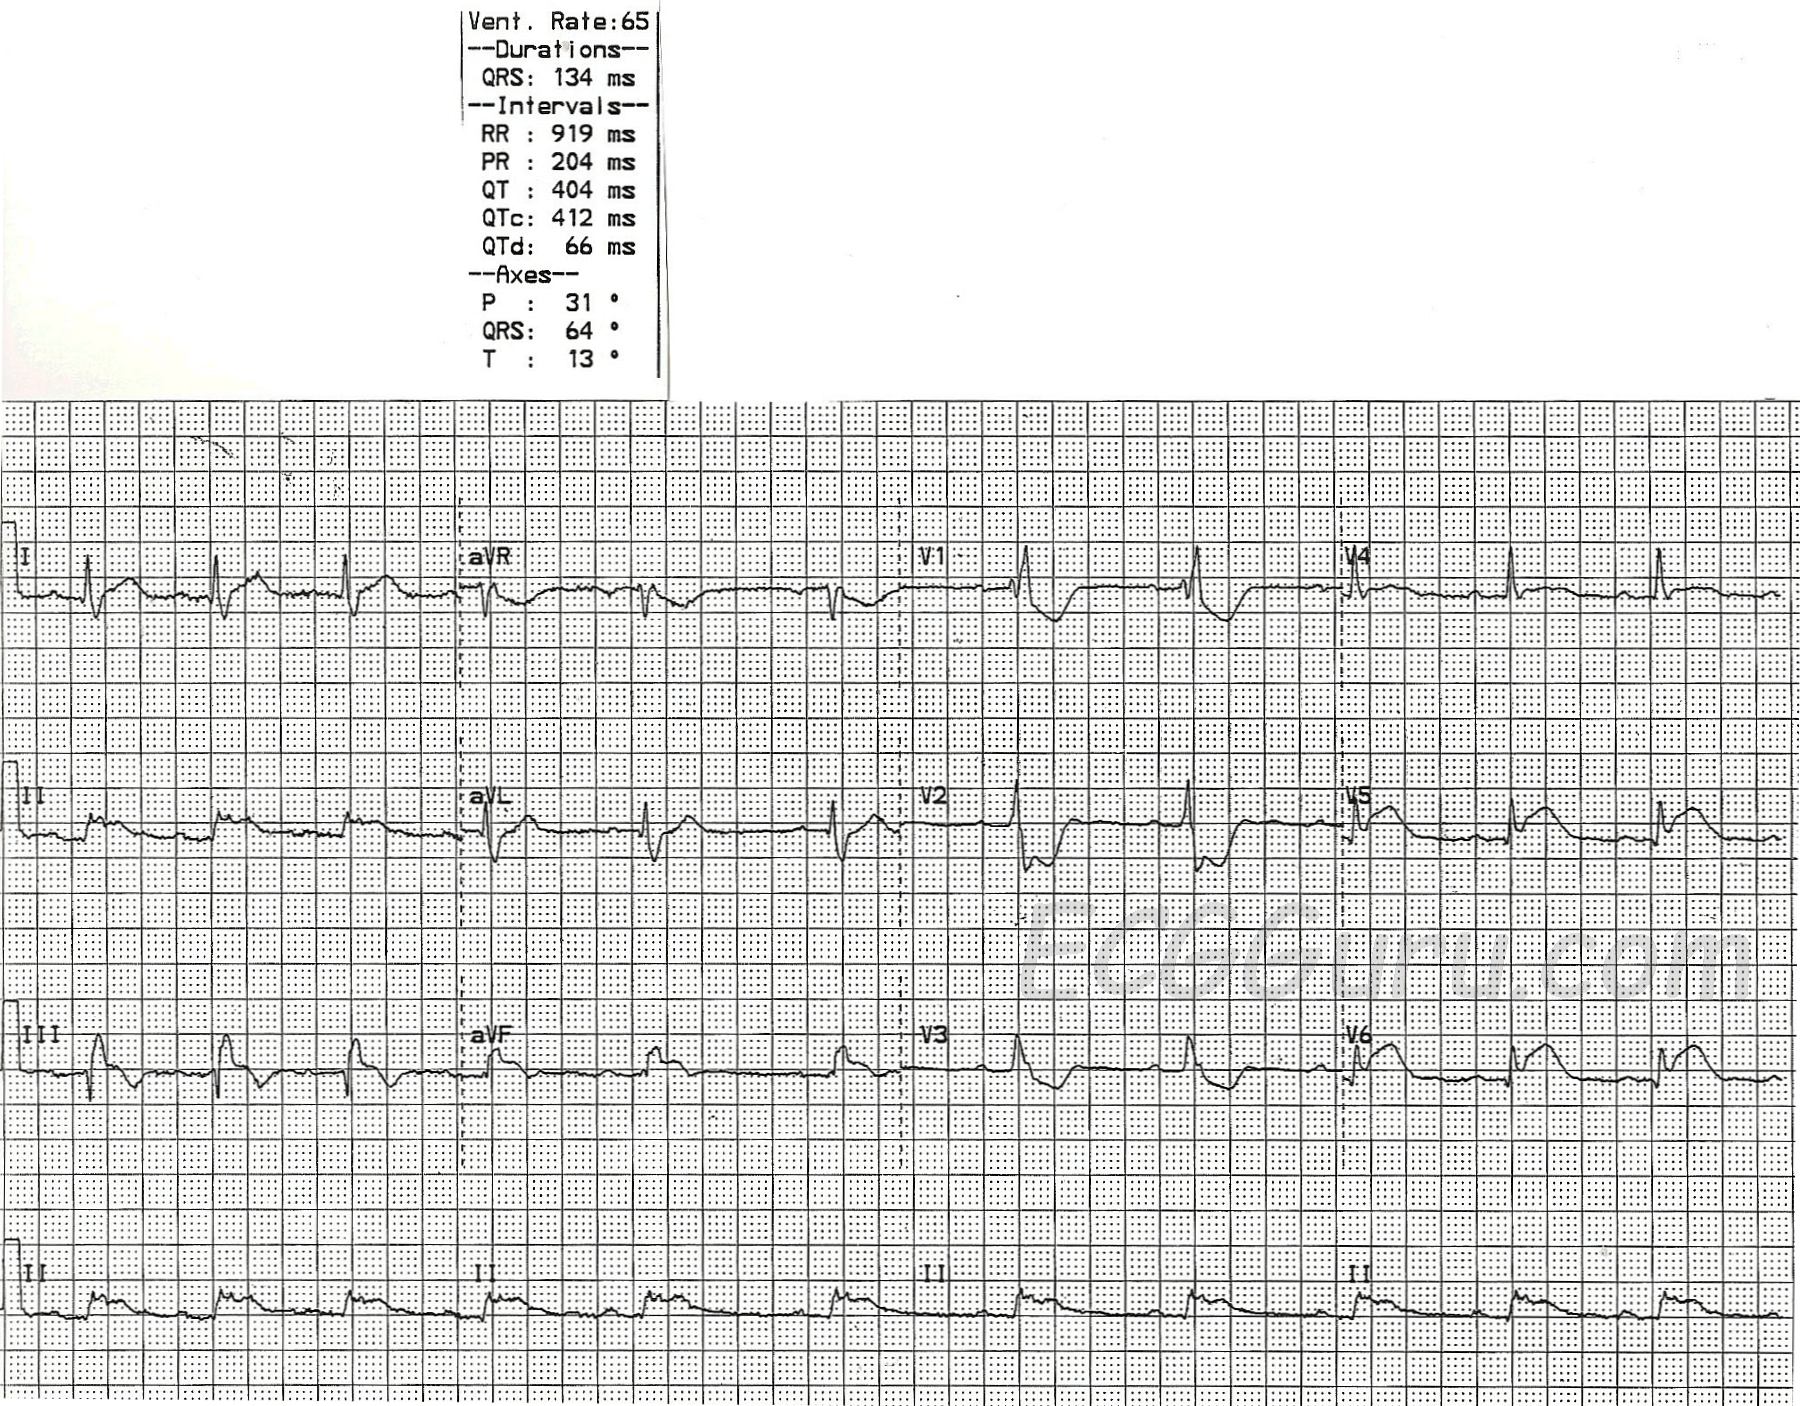
This ECG shows two obvious abnormalities, right bundle branch block AND inferior wall M.I.  It is also a good teaching example of how the terminal wave of RBBB can be mistaken for the ST elevation of M.I.

First, check this ECG to see if it meets the criteria for right bundle branch block:

1)  The QRS will be wide. That is, it will be greater than or equal to .12 seconds (120 ms).  In this case, the QRS is 134 ms.

2)  The rhythm will be supraventricular.  Supraventricular rhythms originate from above the ventricles.  This ECG has P waves before each QRS.  Even though the rhythm is irregular, slowing down during this recorded period, it is a sinus rhythm.

3)  The QRS will have a terminal wave after the "normal" part of the QRS.  This represents the right ventricle depolarizing late.  It is very easily seen in V1, which normally has an rS pattern, and with RBBB has an rSR' pattern, making it appear upright.  V6 and Lead I will show this terminal wave as a wide little s wave.

As mentioned, there is also an acute inferior wall M.I. here.  The ST segment elevation in Leads II, III, and aVF are actually quite subtle.  The flat top of the ST segments gives them away as abnormal, along with the associated ST elevations in V5 and V6, and the reciprocal ST depressions in V1 through V3.  Normally, in IWMI, there will be reciprocal ST depressions in Leads I and aVL, but the elevations they are reflecting are very subtle, and so, therefore, are the depressions. 

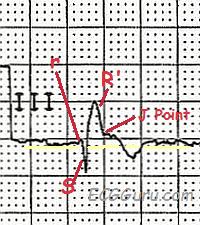
The tricky thing about this ECG is that you must look carefully at the inferior wall leads to see the true ST elevation, which, as mentioned, is subtle.  The RBBB terminal wave of the QRS complexes in Leads III and aVF is upright, and is often mistaken for ST elevation.  Remember, ST segments are smooth from the end of the QRS to the peak of the T wave.  See the detail illustration.

This ECG is suitable for your classes from beginner level (rate variation in sinus rhythm) through advanced (clinical significance of RBBB in acute M.I.).  It also offers an example of reciprocal ST changes, and of a situation where the inferior leads II, III, and aVF are related to the low lateral leads V5 and V6 by a shared blood supply.


Dawn's picture

Extensive Anterior Wall M.I. With Recent Inferior Wall M.I.

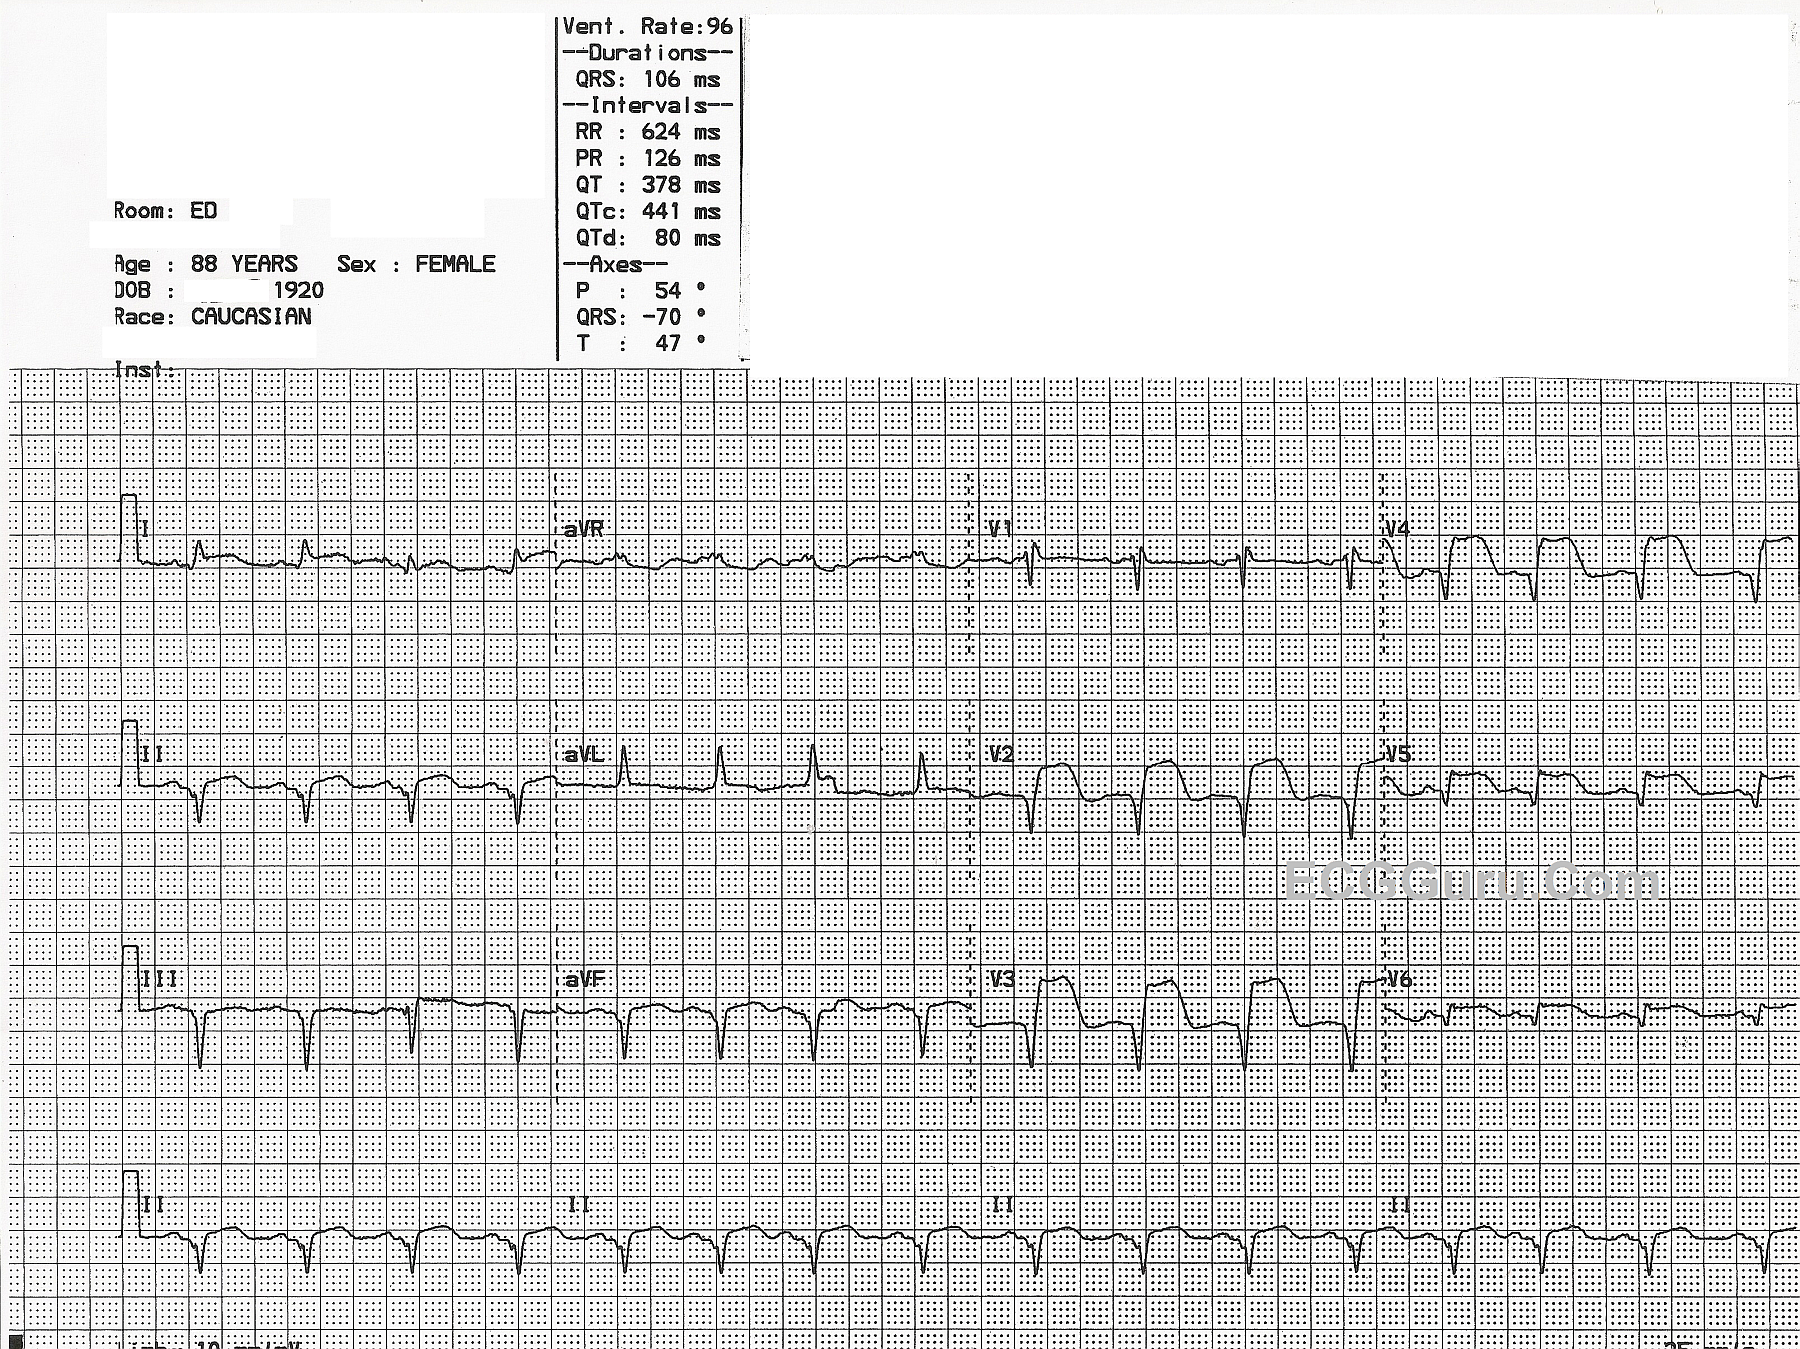
This 88-year-old woman was brought to the Emergency Department in cardiogenic shock.  Very little is known of her past medical history, but it was relayed to the EMS responders that she had been ill for about four days, when she became much worse.

This ECG shows a large, acute anterio-lateral wall M.I., as evidenced by the ST ELEVATIONS in V2 through V6, Leads I and aVL.  To make matters worse, there are PATHOLOGICAL Q WAVES in Leads V2 through V6.  Pathological Q waves indicate areas of necrosis.  Because the myocardium facing the positive electrode is not electrically active, we "see through" the dead tissue to the myocardium on the opposite side of the heart.  Pathological Q waves could be thought of as "reciprocal R waves".  This represents a great deal of dead myocardium, which will be akinetic - not moving.

To make matters worse, she has pathological Q waves in the INFERIOR WALL as well, in Leads II, III, and aVF.  Her ST segments in those leads are flattened and possibly slightly elevated, but not much.  There are no reciprocal ST depressions in I and aVL, because they are affected by the anterior - lateral wall M.I., and are elevated.

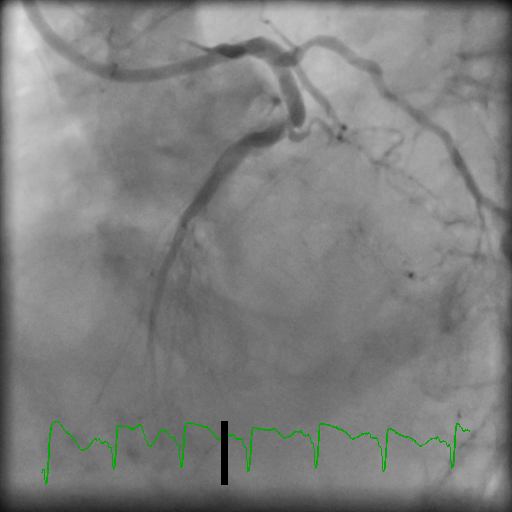
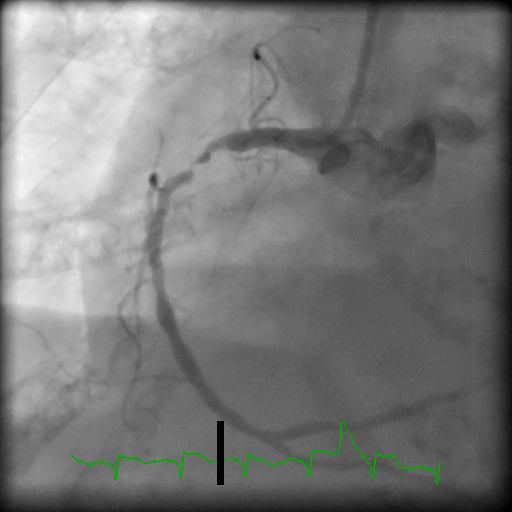
The accompanying photos show her left coronary artery angiogram indicating severe coronary artery disease and a "missing" left anterior descending artery.  This is due to a proximal lesion that occurred around the area of the first diagonal artery, cutting off blood flow to a very large part of her anterior-lateral wall.  The photo of the right coronary artery shows a very tight lesion which is allowing some blood to pass.  The Interventionalist felt that this represented a resolving 100% occlusion (remember, she had been sick for four days).  As the blood clot broke up, blood flowed again, lowering the ST segments.  Unfortunately, permanent damage had already been done, and she had Q waves in the inferior wall also.  This leaves very little of her heart beating, and it is easy to understand why she presented in shock.  She suffered cardiac arrests several times during the procedure, and was managed with a balloon pump and ventilator.

Unfortunately, this type of injury is not survivable, and she died in the CVICU a few hours after her procedure. She contributes to our education by demonstrating the cumulative effects of M.I., especially when permanent damage occurs.  For a look at her ventriculogram, to understand the devastating effects of these injuries, go to our You Tube channel.

Dawn's picture

Artifact on an ECG With Inferior, Posterior, Lateral M.I.

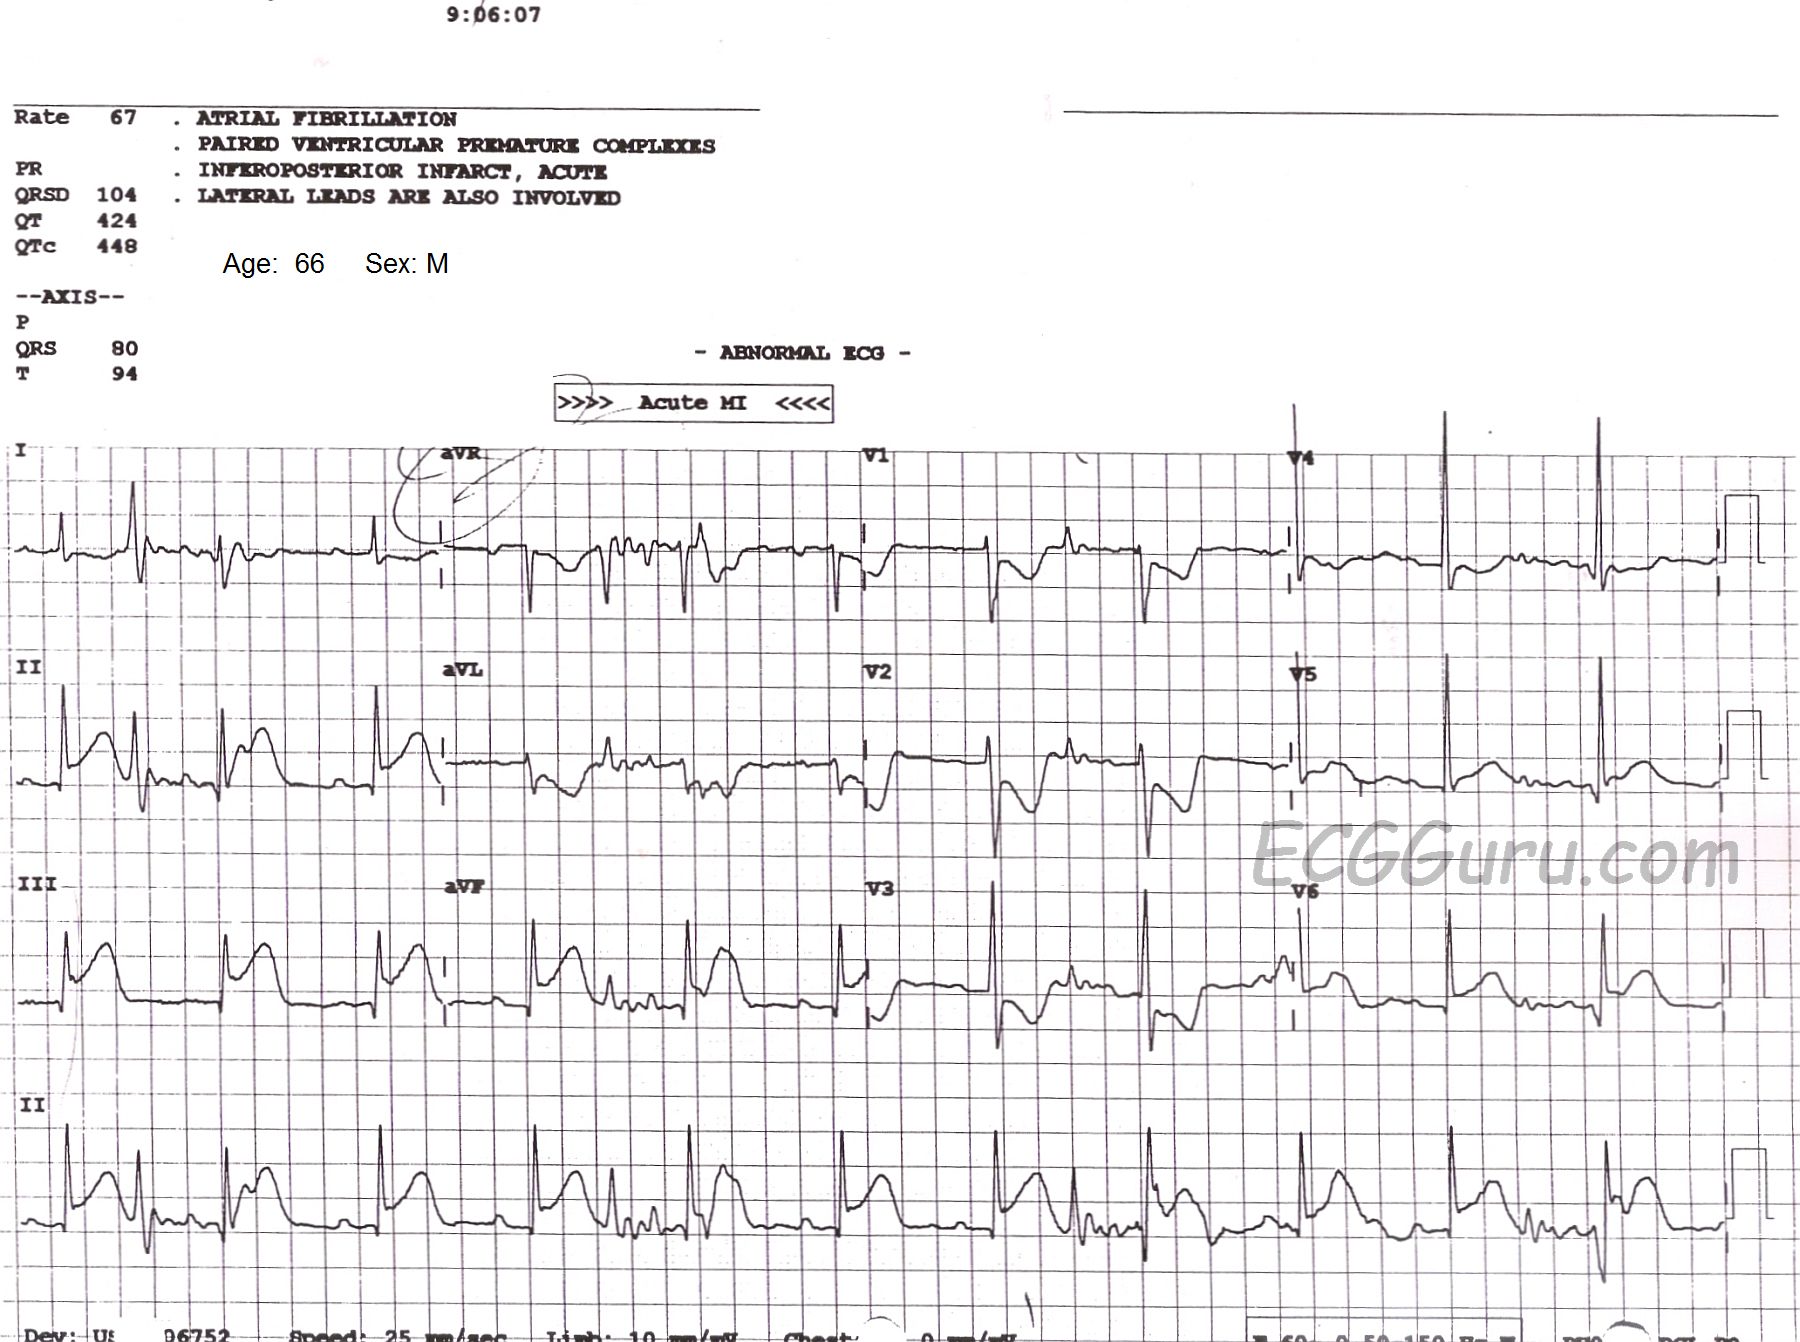
If you are an ECG instructor, it is important that you address the subject of artifact on the ECG.  Artifact has many causes, and it is important eliminate it whenever possible.  We should strive for the "cleanest" ECG possible.  As you can see in this example, the presence of artifact has caused the machine's computer rhythm interpretation to be incorrect.  The noisy baseline has caused the computer to call this rhythm "atrial fibrillation", but we clearly see P waves in all leads, especially in Lead II.  We recognize these P waves as authentic because they are regular, they  all look alike, and they have the same relationship to the QRS complexes each cycle (PR interval is the same).  

The patient is suffering a very large M.I., showing as ST segment elevation in Leads II, III, aVF, with slight elevation in V5 and V6.  In addition, Leads V1 through V3 have definite  ST depression, indicating extension of the inferior wall injury up the posterior wall of the heart.  There has been quite a bit of discussion lately in the literature about whether to call this a "posterior" M.I, or "high lateral", or just "inferior".  Semantics aside, the involvement of so many leads tells us that this  is a large M.I.  The patient was in the Emergency Dept. complaining of chest pain.

It is fortunate that the artifact did not affect our ability to see the ST elevation, but it could have.  And, of course, we would not want to treat this patient's "atrial fib" based on the machine interpretation.  But, it is always prudent to try to get rid of artifact.  In this example, Lead III has no artifact, so it could be assumed that the right arm electrode is the culprit, as Lead III does not utilize the RA electrode, and the other leads do.  

Troubleshoot for the cause of the artifact, and then retake the ECG.  Some common causes of baseline  artifact of this nature include:  patient movement, loose electrode, dried electrode, something touching the electrode, faulty or broken lead wire, and poor skin contact due to substances on the skin.  The electrodes should be fresh from the package, and applied to skin that is clean and dry.  The patient should be encouraged to relax and hold still (not so easy for a patient in distress).  Others at the bedside should avoid touching or manipulating the limbs of the patient during acquisition of the ECG data.  This only takes about 10 seconds.  I have seen artifact many times when a patient's blood was being drawn during the ECG, and the patient was squeezing his fist for the phlebotomist.

Dawn's picture

Acute Inferior Wall M.I.

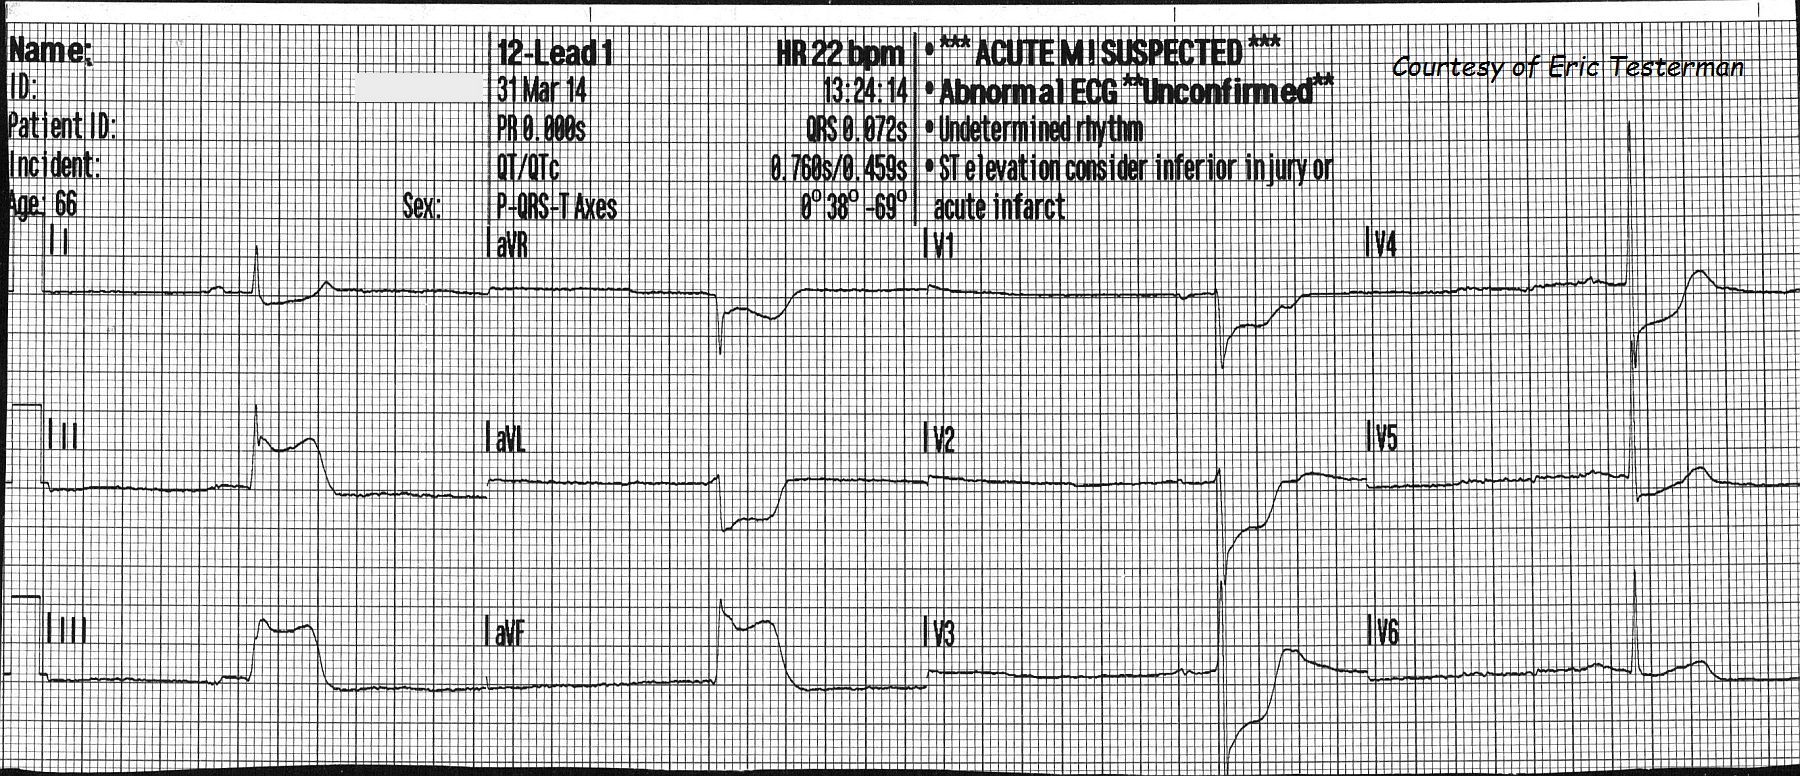
Another great ECG donated by Paramedic Eric Testerman.  This ECG is from a 66 year old man who was complaining of feeling dizzy, weak, and of having "minor" chest pain. He was extremely pale/ashen, had moderate cyanosis, and was very clammy and diaphoretic.  His initial heart rate was about 20 bpm.  His initial BP was 131/113 then, just before arrival at the hospital was 127/85. His HR increased to about 50 bpm (not shown). He was given 400 ml I.V. fluid, 324 gr of aspirin, and oxygen.  Transcutaneous defibrillator/pacemaker pads were applied. 

At the hospital, he was successfully treated with angioplasty for a 100% occlusion of the right coronary artery. The time from beginning of treatment to reperfusion of the artery was 47 minutes, which is very good! 

This is a "classic" inferior wall M.I., with ST elevation in leads II, III, and aVF. There are reciprocal ST depressions in I and aVL.  There are also ST depressions in V1 through V5.  This is generally considered to represent reciprocal ST changes in the posterior and lateral walls.There is a quite severe bradycardia, and the patient's skin showed signs of poor perfusion. Amazingly, the patient's BP stayed adequate during transport.  Bradycardia is common in inferior wall M.I. due to ischemic effects on the SA node and vagus nerve (sinus bradycardia) and the AV node (heart block).  In this case, the rhythm is sinus bradycardia.  The heart rate is in the 20's, and the PR interval is around .20 - .22 seconds. 

Dawn's picture

Previous Inferior Wall M.I. and Left Axis Deviaton

If you are teaching frontal plane axis to your students, you will need to teach them HOW to determine the axis - usually beginning with the QRS axis and then adding the P and T waves.  But, you also need to teach them WHY we measure axis, to provide relevance to something that may seem challenging to beginners.  There are many ECG interpretations that rely heavily or are dependent upon the determination of the axis.  

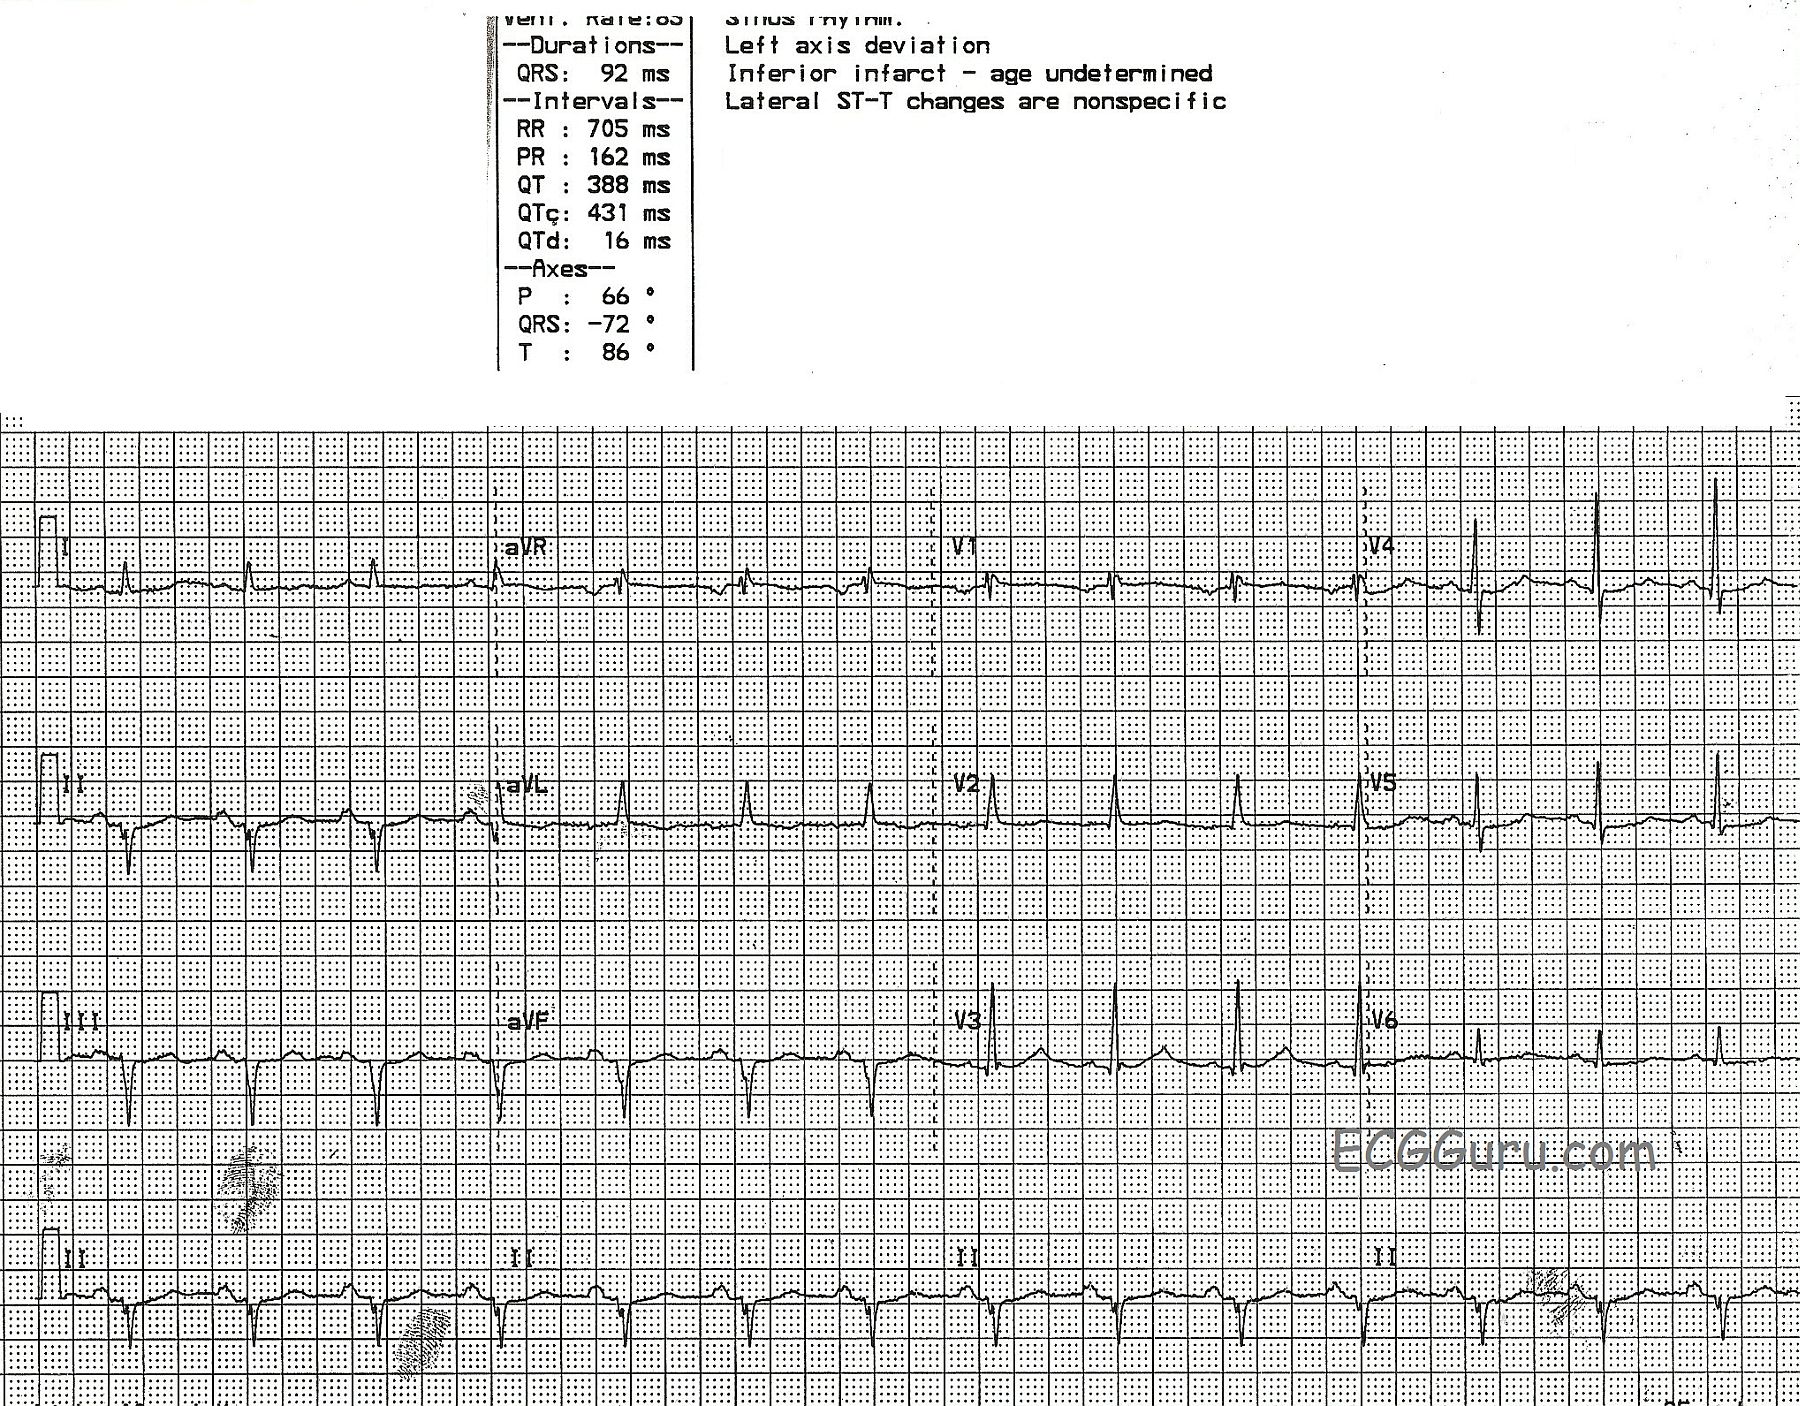
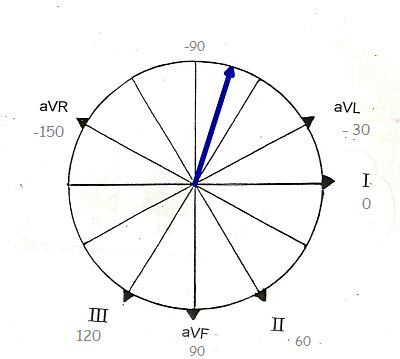
This ECG is a great example of left axis deviation.  The cause is readily discernible, if your students know the ECG signs of myocardial infarction. This patient had an inferior wall M.I. in the distant past, and now has pathological Q waves in Leads II, III, and aVF.  Pathological Q waves in related leads in a patient with history of M.I. are a sign of necrosis, or permanent damage, in that part of the heart.  The inferior wall has lost an extensive amount of tissue, which is now electrically inactive as well as mechanically inactive.  (You may also find it helpful to show students videos of ventriculograms showing normal LV function and hypokinesis of the LV due to M.I.)  Because of the loss of electrical activity in the inferior wall, the "mean" electrical direction (or axis) is AWAY from the inferior wall.  That is, the electricity travels AWAY from II, III, and aVF and TOWARD I and aVL.

Many of the blogs and webpages listed in our "Favorites" address the subject of axis determination.  Here is one from Cardio Rhythms Online if you would like a review.


Pages

All our content is FREE & COPYRIGHT FREE for non-commercial use

Please be courteous and leave any watermark or author attribution on content you reproduce.