Dawn's picture

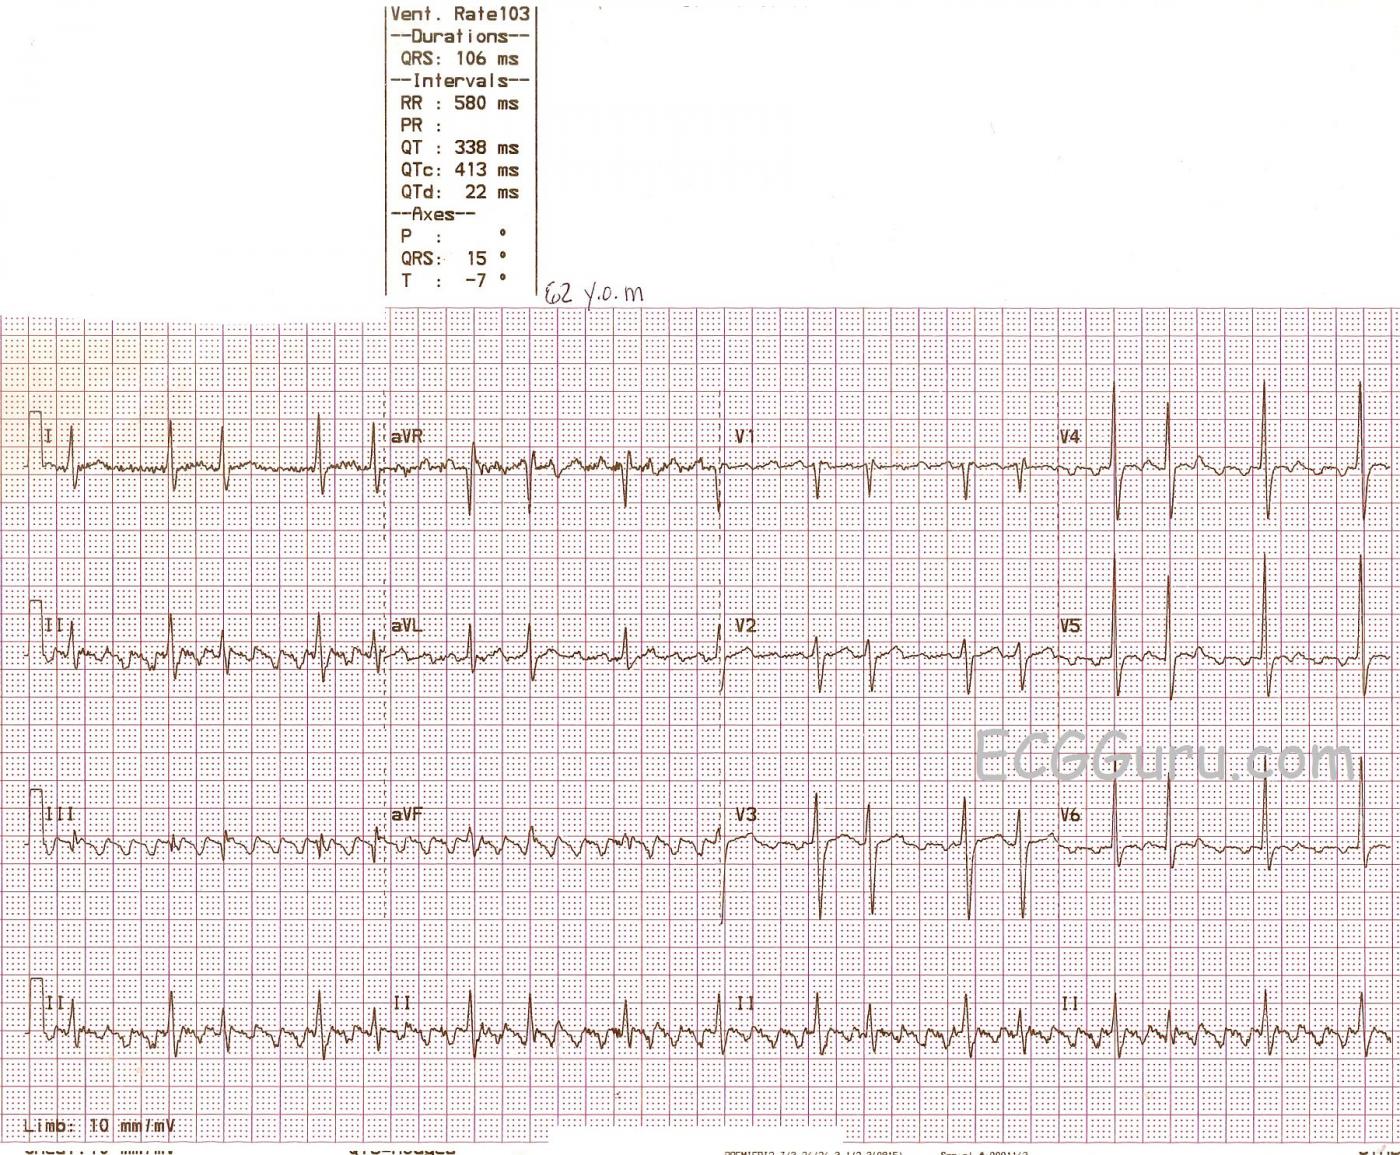
This ECG provides an example of atrial flutter with variable conduction.  There are two distinct R - R intervals, making this a somewhat regularly-irregular  rhythm, as opposed to the irregular irregularity of atrial fibrillation.  The flutter waves (P waves) are very easy to see in most leads, but not in all.  If you are teaching students who are making the transition from reading monitors and rhythm strips to 12-lead ECGs, this is a great ECG to illustrate for them how the more leads you have, the more you will see.  The flutter waves are invisible in Lead I and, to the untrained eye, they may be hard to see in the precordial leads.  The four channels on this ECG are run simultaneously, so if  P waves or flutter waves are visible in one lead, they are also present in all leads that line up vertically with that one.  In other words, the Lead II rhythm strip at the bottom confirms that flutter waves exist across the entire ECG.

The R - R intervals in this ECG reflect alternating 2:1 and 4:1 conduction.  There are a couple of times when the 4:1 ratio repeats itself without alternating.  Often, the length of these varying R - R intervals will be multiples of each other, or have a common denominator.  These do not appear to, and may reflect the fact that, when R to P intervals lengthen, R to R intervals sometimes shorten.  In other words, the PR intervals, which are difficult to measure in atrial flutter, may be changing.  I would invite my colleagues with more expertise in this area to comment below.

There are no blatant ST segment abnormalities here, but ST segments can be very difficult to assess in atrial flutter because of the flutter waves.  We do not have clinical data, other than this is a 62-year-old man.

Rate this content: 
Average: 3.4 (52 votes)

Comments

ekgpress@mac.com's picture

     Interesting example of AFlutter presented by Dawn this week. I'll add a few comments regarding this interesting tracing. WARNING: Some of my comments below extend well beyond-the-basics. Hopefully they will nevertheless be of interest and provide insight to all who read this column.
  • Although there is baseline artifact — there should be no doubt that the underlying rhythm is AFlutter. Nothing else produces regular atrial activity at a rate close to 300/minute. As per Dawn  some leads show flutter waves better than others  so it is good to routinely survey the entire 12-lead tracing for atrial activity.
  • The rate of flutter in this example is actually faster than 300/minute. I calculate the rate at ~ 330/minute. To come up with this estimate  I modify the "every-other-beat" method for rate determination. Using calipers  I counted 5 flutter waves and note that the R-R interval for these 5 flutter waves is between 4 and 5 large boxes (closer to the latter so 1/5 the rate ~ 66/minute X 5 ~ 330/minute.
  • There is more than one pattern of atrial flutter. Depending on the direction and path through the atria  atrial activity may take on a different appearance. AFlutter in this example looks "typical"  with prominent sawtooth in each of the inferior leads. But awareness of atypical patterns (that often overlap with the appearance of Atrial Tachycardia) is important when you see very rapid atrial activity but without "that sawtooth". For more on specific aspects of AFlutter  Please check out this pdf excerpted from my ACLS-2013-ePub. (Beyond-the-Core discussion of "typical" vs "atypcal" AFlutter begins in Section 14.4.12 in this pdf ). 
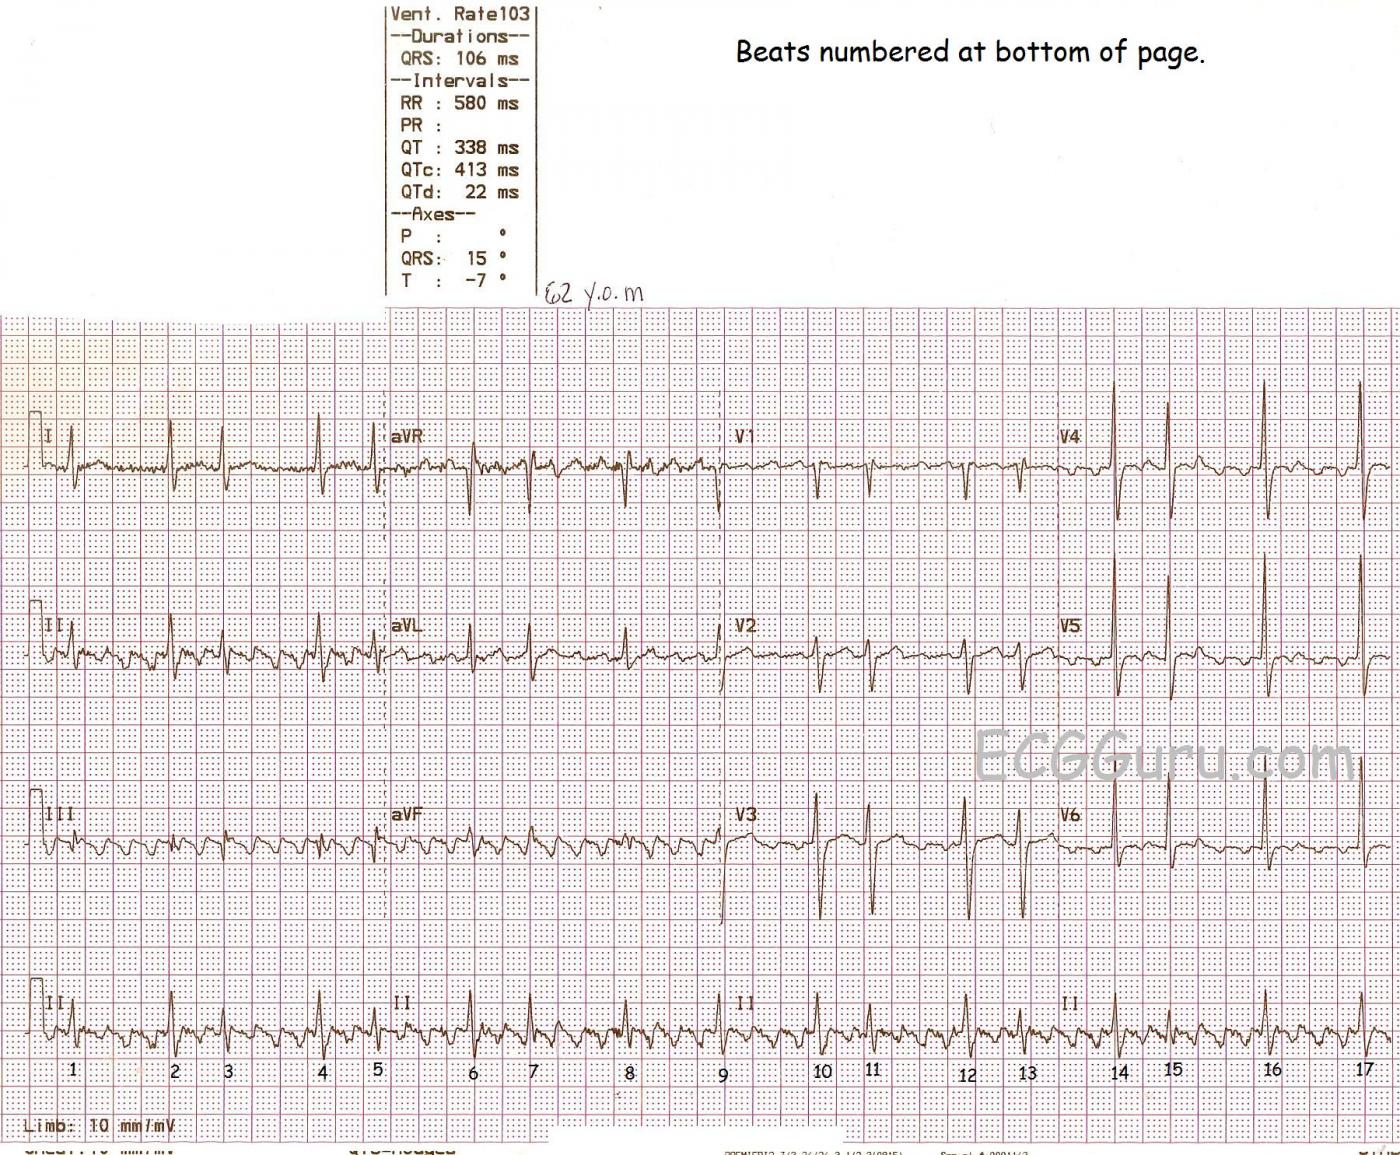
  • Dawn's point that the ventricular rhythm is regularly irregular (ie, "grouped" or patterned) is important! This is NOT by chance. We KNOW that flutter waves ARE conducting  because the flutter-to-QRS distance IS constant before similar-appearing beats. I'll explain. Note in the long lead II rhythm strip that there are 16 beats. Note that the QRS for beats #3,5,7,11,13 is slightly smaller than for beats #1,2,4,6,8,9,10,12,14,15,16.
  • I see a constant flutter-to-QRS (ie, "PR") interval preceding each "taller" QRS  and a constant (abeit different) flutter-to-QRS interval preceding each smaller beat. This tells us that there IS conduction  albeit with different PR intervals. Technically  we cannot tell WHICH flutter wave is conducting from the surface ECG (it is almost never the closest flutter wave  due to concealed conduction from 300 impulses/minute attaining the AV node). But the presence of GROUP BEATING (as seen here) in association with AFlutter almost always means that there is Wenckebach conduction out of the AV Node. This can get complicated  as there may be multiple "levels" within the AV Node  each conducting with a different Wenckebach ratio. That said  what CAN be said  is that the rhythm here is AFlutter at ~ 330/minute with group beating suggestive of Wenckebach conduction out of the AV Node.
  • If this patient was on Digoxin  one should consider the possibility of Digoxin toxicity  since Wenckebach out of the AV node is a common Dig toxic rhythm. However, if the patient is not on Digoxin  this may simply be a normal phenomenon of the AV node being unable to conduct 1:1 at this fast of a stimulating rate. The "good news" (for the patient is that the overall ventricular rate is not excessively rapid here.
  • What remains to be explained is why the slight-but-real change in QRS morphology on this tracing? I do not believe this is "alternans"  but rather reflecting slight aberration for the short-cycle beats (ie, beats #3,5,7,11,13). This is best seen in lead V1  where a terminal r' is noted for these short-cycle beats  which reflects an incomplete RBBB (Right Bundle Branch Block) pattern  which is the most common pattern for aberration. Predisposition to aberrant conduction is by the Ashman phenomenon (occurrence of a "short-long" cycle that sets up conditions for aberrancy).
  • Finally  We need to remember to look at the rest of the tracing. While interpretation of ST-T waves is always more difficult in the presence of large flutter waves  I do not see any "acute" ST-T wave changes. There are persistent S waves (through to V6). Voltage is a bit shy of criteria for LVH. 
There is a LOT happening on this tracing!
 
-----------------------------
  • For full Review on the Basics of AV Blocks  Please check out our 58-minute ECG Video @ www.avblockecg.com  
-----------------------------


Ken Grauer, MD  www.kg-ekgpress.com   [email protected] 

Dawn's picture

We are including a copy of this ECG with the beats numbered to help you follow Dr. Grauer's very helpful and interesting discussion.

Dawn Altman, Admin

All our content is FREE & COPYRIGHT FREE for non-commercial use

Please be courteous and leave any watermark or author attribution on content you reproduce.