
Submitted by Dawn on Fri, 06/07/2019 - 14:48
The Patient: This ECG was taken from a 73-year-old man with a history of heart failure with preserved ejection fraction, severe left ventricular hypertrophy, Type II diabetes, and stage 4 chronic kidney disease. He also suffered deep vein thrombosis and is on anticoagulation. He has a recent diagnosis of IgA myeloma. He presented with a complaint of nausea and vomiting and was found to have a worsening of acute kidney infection. There was suspicion of renal and cardiac amyloidosis, but the patient refused biopsy to confirm this. He was started on chemotherapy for multiple myeloma and will be followed as an outpatient.
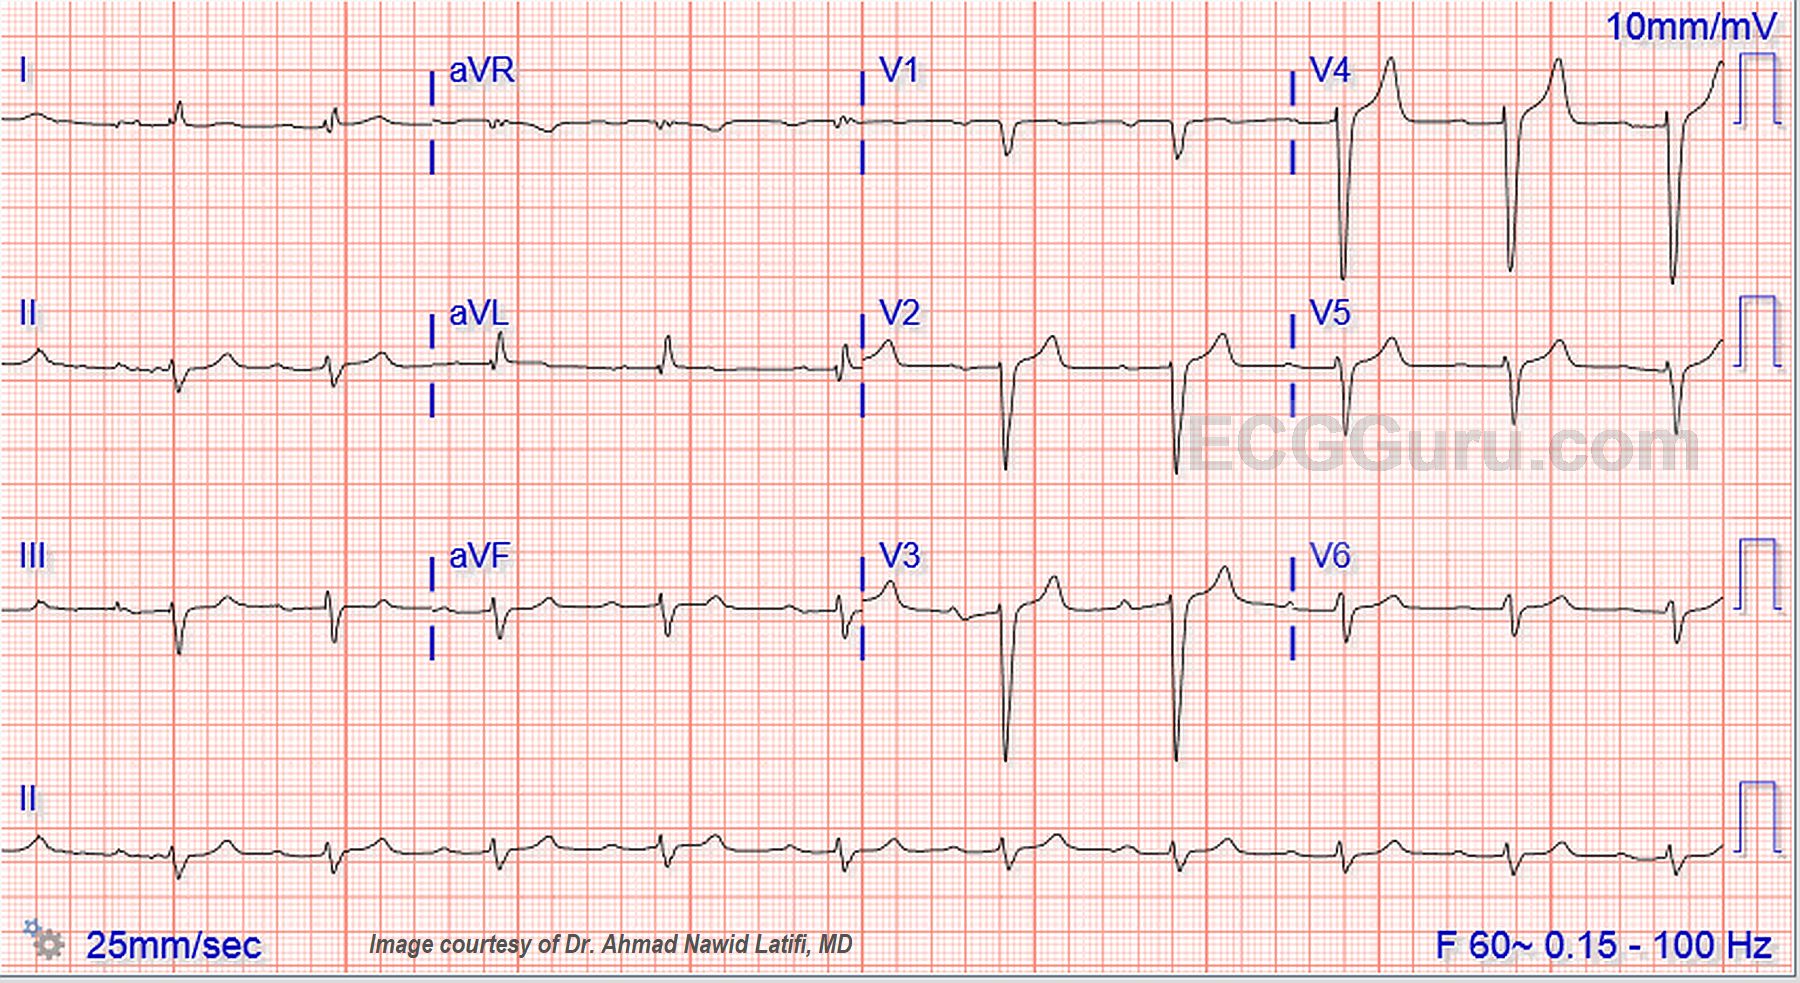
The ECG: The rhythm is sinus at around 60 bpm, although the rate varies a little at the beginning of the strip. The QRS complex is wide at .12 seconds, or 120 ms., representing interventricular conduction delay (IVCD). The PR interval is .32 seconds, or 320 ms. This constitutes first-degree AV block. There is left axis deviation in the frontal plane and poor R wave progression in the horizontal plane.
Wide QRS: When confronted with wide QRS, there are many diagnostic possibilities. We can rule out a ventricular origin for the beats, as there are P waves consistently before each QRS. There is no history given of the presence of electronic pacemaker, and no obvious spikes. One of the most common forms of IVCD is left bundle branch block. In this ECG, V1 has the appearance of LBBB with it’s monophasic, wide QS pattern. However Leads I and V6 do not have the typical LBBB pattern, which would be broad, positive QRS complexes. By ruling out obvious causes of the conduction delay, we are forced to simply call it “interventricular conduction delay (or defect)”.
Conduction delays below the level of the bundle of His can occur any place along the interventricular conduction system, and can even be a feature of the thickened or dilated left ventricle. One way to pinpoint the area of conduction delay is with electrophysiology studies.
In the past, patients who showed signs of LBBB (a bifascicular block) and first-degree AVB were said to have “trifascicular block”. This term is now outdated, and it is felt that it is preferable to just describe the conduction delays seen. The majority of first-degree AV blocks occur at the AV node level, but in the presence of LBBB, first-degree AVB can represent a conduction defect in the right bundle branch. Of course, EP studies can make the naming of blocks and conduction delays much more accurate. A 1971 study explored the occurance and location of first-degree AVB in the setting of interventricular conduction delays.
Left Ventricular Enlargement: (a term including hypertrophy and dilatation). The QRS complexes on this ECG do not meet the Sokolov-Lyon criteria for LVH, but LVH is not diagnosed by ECG findings, which tend to be less than reliable. This patient’s known history of LVH is presumably confirmed by xray and echocardiogram. The slight ST elevations in V2, V3, and V4 are typical of wide-complex rhythms, in that they are “discordant” to the QRS direction, and proportional to the size of the QRS. That is, the ST and T waves will point in a direction opposite that of the QRS, and there will be most notable ST elevation or depression in the leads with the tallest or deepest QRS complexes. For more on evaluation of ST elevation or depression in the presence of broad-complexes, see Dr. Smith’s work on the modified Sgarbossa criteria.
It is safe to say that this unfortunate patient has plenty of clinical history to have the ECG changes seen here, and that there are no acute ECG findings.
We would like to thank Dr. Ahmad Nawid Latifi for sharing this most interesting case with us. You will find another, similar case from Dr. Latifi here. Some of the discussion is relevant to both ECGs.
Related Terms:
Rate this content:
All our content is FREE & COPYRIGHT FREE for non-commercial use
Please be courteous and leave any watermark or author attribution on content you reproduce.
Comments
First, Check Serum K+ — Then Consider IVCD …
We are told that the 73-year old patient in this case has longstanding severe kidney disease with an acute kidney infection. As a result, I had 3 Questions after looking at this ECG: #1) What is the serum K+ value? — #2) What is the serum K+ value? — and, #3) What is the serum K+ value?
Reasons why my 1st, 2nd, and 3rd thoughts are to rule out hyperkalemia are: A) Because of the ECG findings of a relatively slow heart rate despite acute illness — 1st-degree AV block + QRS widening that is not consistent with any of the usual conduction defects — low-amplitude P waves — and peaked T waves with narrow base in several of the chest leads. All of these ECG findings are potentially consistent with a diagnosis of hyperkalemia in this patient with a clinical history that predisposes to this disorder.
B) IF this patient is hyperkalemic — then many (if not most) of the abnormal ECG findings may “go away” once serum K+ is corrected. As a result — I feel it academic to postulate reasons for the ECG abnormalities that we see if they are primarily the result of this electrolyte disorder.
NOTE: You may ask how this could be hyperkalemia without tall, peaked T waves in the limb leads? The answer potentially lies with finding a baseline ECG on this patient done at a time when serum K+ was known to be normal. IF this patient’s normokalemic ECG baseline manifests ST flattening and/or some ST depression in limb leads — it could be that the small-amplitude but relatively pointed T waves that we see in leads II, III and aVF do reflect the beginning of T wave peaking in leads that started out with marked opposing changes. BOTTOM LINE: ECG changes of hyperkalemia are superimposed on whatever the baseline ECG showed before the hyperkalemia developed …
IF it turns out that serum K+ was normal at the time this ECG was obtained — then I would interpret this ECG as showing — sinus rhythm at ~60/minute with 1st-degree AV block — nonspecific IVCD with left axis — peaked T waves in several chest leads, but most probably without acute ST-T wave changes. Access to a prior ECG on this patient (at a time when the serum K+ value was known to be normal) would be helpful in further clarification.
P.S. In my opinion — there is no evidence for “tri-fascicular block” (since we don’t even have LBBB). Even if typical LBBB was present — for the reasons I’ve previously stated (in the April 24, 2019 ECG Guru Instructor Collection case) — the term “trifascicular block” is no longer recommended.
Ken Grauer, MD www.kg-ekgpress.com [email protected]
typical amyloidosis?
I think this ECG is absolutely typical of cardiac amyloidosis, which Dawn mentions as a suspected diagnosis. The amyloid features on the ECG are:
· Low voltage limb lead QRS complexes
· Left axis deviation
· Long PR interval
· Poor R wave progression in the chest leads.
We are told that the patient had severe LVH but I wonder whether this was true LVH due to myocyte enlargement or non-LVH wall thickening due to amyloid deposition. My guess is that an echo simply showed the gross LV wall thickening which is characteristic of amyloidosis. This is not to say that there is not also some other superimposed condition here, eg hyperkalaemia, but I think that all the abnormalities we see could be explained by amyloidosis alone.
Here is a very similar ECG in cardiac amyloidosis: https://www.internationaljournalofcardiology.com/article/S0167-5273(13)00099-5/abstract
Thanks, Dave
Thanks for your comment re: amyloidosis. It is something I have encountered, but not familiar with the expected ECG changes. Great learning experience!
Too bad the patient refused bx, but with his medical history and condition, it is understandable.
Dawn Altman, Admin
Yes — COULD BE Amyloidosis — IF ...
THANKS for your comment Dave! Yes, this patient certainly could have cardiac amyloidosis — and his diagnosis of IgA myeloma clearly predisposes him to this. That said — FIRST ORDER of business is to find out the serum K+ level at the time that this ECG was done — since you’ll NEVER know what the patient’s baseline ECG looks like until you do (ie, hyperkalemic patients with resultant QRS widening. reduced P wave amplitude, 1st degree AV block and other conduction defects may resolve much of these ECG findings once serum K+ is normalized). That said — working on the assumption that serum K+ was normal — then clearly the ECG features Dave points out could be consistent with the diagnosis of amyloidosis (ie, this ECG DOES look quite similar to the one Dave references in the article by Ahmed et al — with the exception that there are NO peaked T waves on that tracing … ).
When I was trained — amyloidosis was RARE, and most often a post-mortem diagnosis. Improved imagining techniques + greater index of suspicion has changed this. Knowing what this patient’s Echo showed would have helped (ie, if the Echo showed gross LV wall thickening — this clearly would have supported the diagnosis). Otherwise, QRS voltage IS decreased in the limb lead of this tracing (though strict criteria = QRS amplitude ≤5mm in all 6 limb leads, are not quite met). As per Dave — the left axis, 1st-degree, and lack of R wave progression ARE findings commonly seen with amyloidosis. But poor R wave progression is commonly seen in lbbb-like conduction defects, and the “pseudo-infarction” pattern often mentioned in the literature on amyloidosis is absent here.
So — I REALLY would like to see this patient’s chart to review any and all ECGs (done while he was normokalemic) that are in his folder. If he DID turn out to have amyloidosis — it would be fascinating to trace his ECG EVOLUTION in recent years to see IF the ECG posted here truly is the end-result of cardiac amyloid deposits! (ie, perhaps the patient initially had a typical lbbb — but over the years lost P wave amplitude, developed a left axis, and evolved this unusual precordial lead QRS pattern … ).
BOTTOM LINE: Excellent thought by David Richley on the possibility of cardiac amyloidosis!!! That said, IF serum K+ was normal — I would still interpret this ECG as sinus rhythm — 1st degree AV block — IVCD with left axis — nonspecific ST-T wave changes that do not appear to be acute. In my opinion — this ECG pattern is not “specific” for cardiac amyloidosis — though it certainly COULD BE CONSISTENT with that diagnosis IF confirmed by other tests. So, putting myself in the position I occupied for 30+ years (ie, reading all ECGs for 35 medical providers in an ambulatory care center) — after verifying serum K+, I would have thought this to be a distinctly ATYPICAL form of IVCD because lateral chest leads are not consistent with LBBB — and the much wider-than-expected initial R wave that we see in leads V5 & V6 just isn’t what is typically seen with most IVCDs. This ECG would have suggested SOME FORM of underlying structural heart disease to me — and I would have been fascinated to learn that this could have been cardiac amyloidosis.
Ken Grauer, MD www.kg-ekgpress.com [email protected]
Thanks, Ken
This case is such a good learning experience - thank you for your detailed explanation. I hope Dr. Latifi (the source of the case information) will be able to provide more information regarding the patient's clinical history, course, and test results.
Dawn Altman, Admin
Thanks Dr. Ken Grauer
Thank you so much Dr. Ken Graurer and Dawn for your interests in this EKG. This patient's baseline K has always been on the higher side in the range of 4.8-5.6. By The time this EKG was recorded, it was 5.4. So I went through his old records and about 2 years ago, I found one of his EKG when his K was 3.8. That time the recorded EKG still showing QRS of 119 and the PR interval was 270. I think the patient does have underlying IVCD with superimposed hyperK changes (peaked T waves). I have attached the EKG which was recorded around 2 years ago when his K was 3.8.