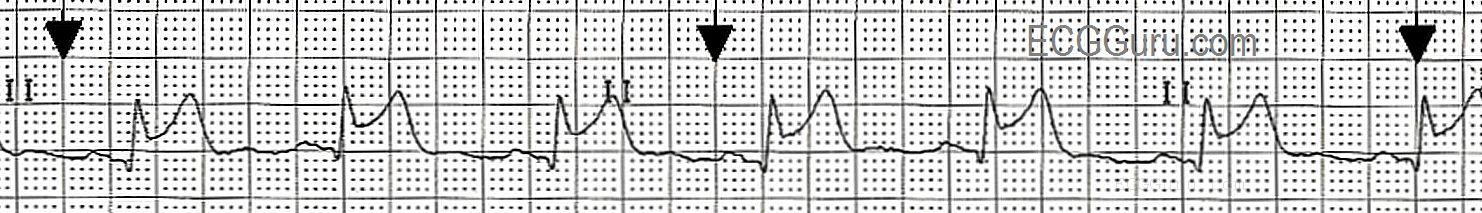
This Lead II rhythm strip was taken from a 12-Lead ECG performed on a 66-year-old man who was having an acute inferior wall M.I. The rhythm is normal sinus rhythm at 65 bpm. The QRS complex is slightly wide at 112 ms (.11 seconds). The patient did not have a bundle branch block pattern on his 12-lead ECG. The PR interval is .17 seconds, and the P waves are widened and have a "double peak". This can be a sign of left-sided heart failure, and is called P Mitrale. Your students should be advised not to try to diagnose acute M.I. from a monitor strip, as ST segments can be inaccurate on some types of monitors. However, any derangement of the ST segment on a monitor strip calls for an immediate 12-Lead ECG for confirmation.
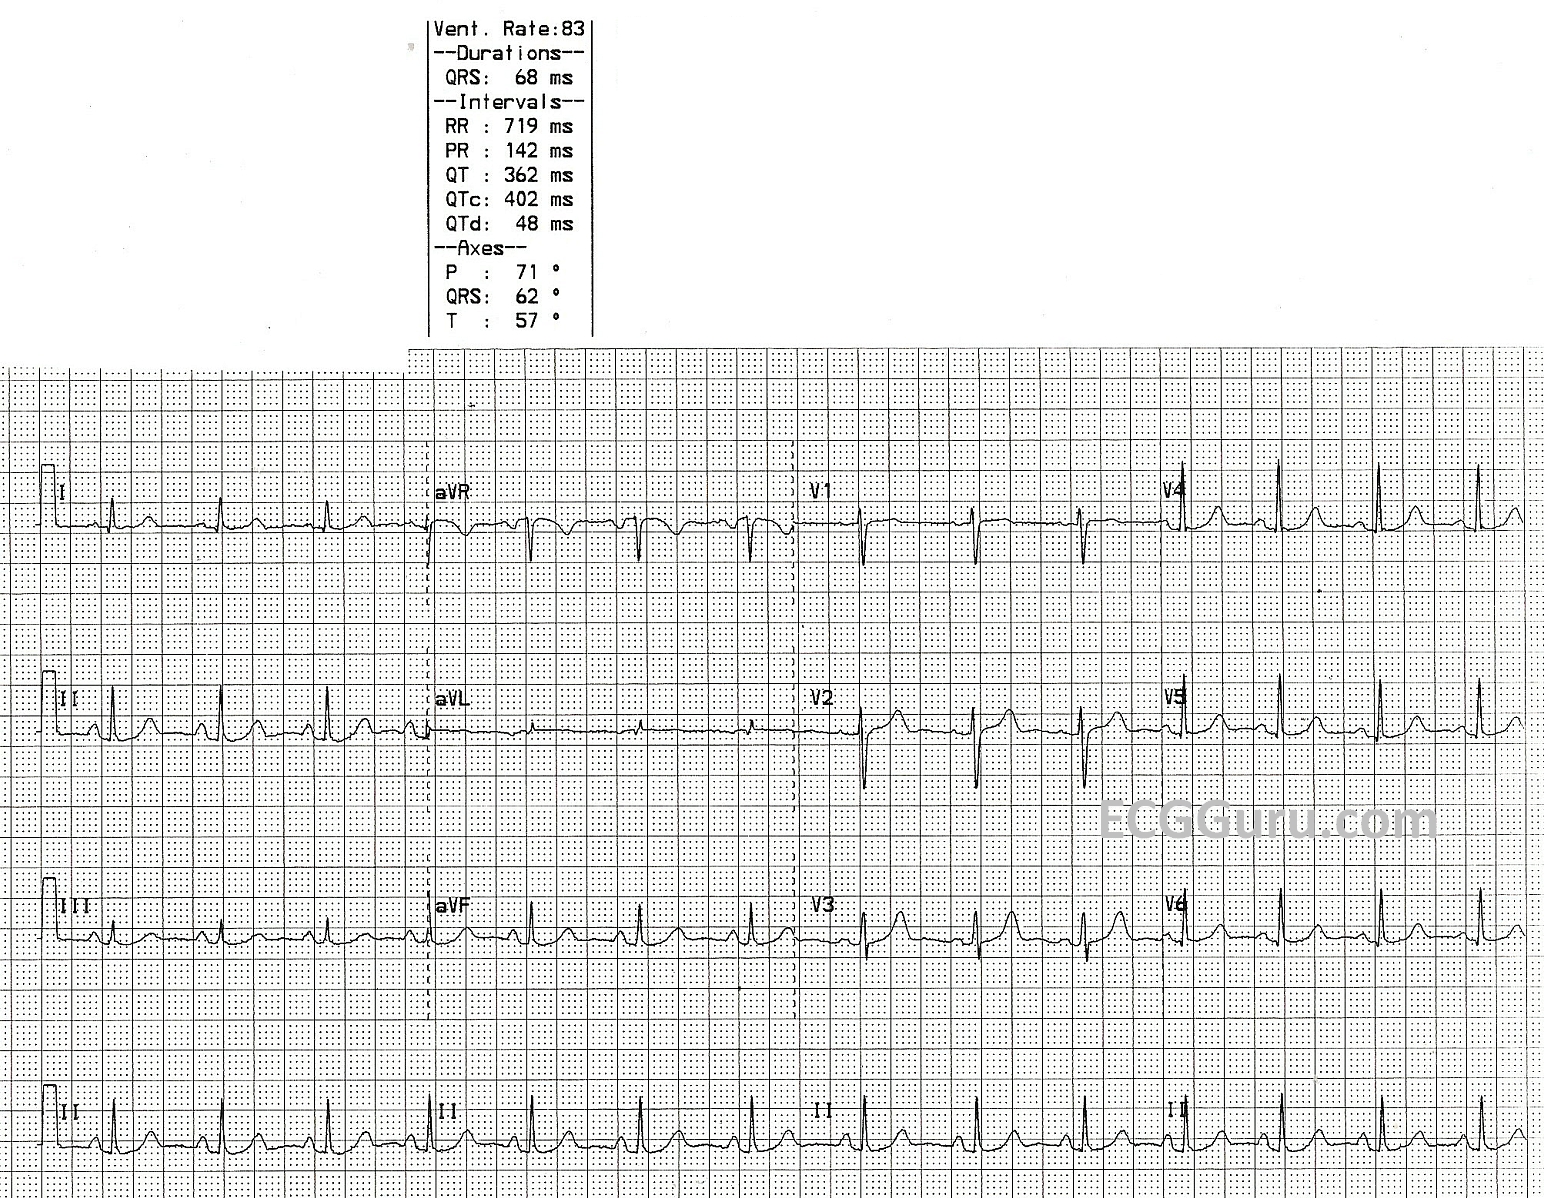
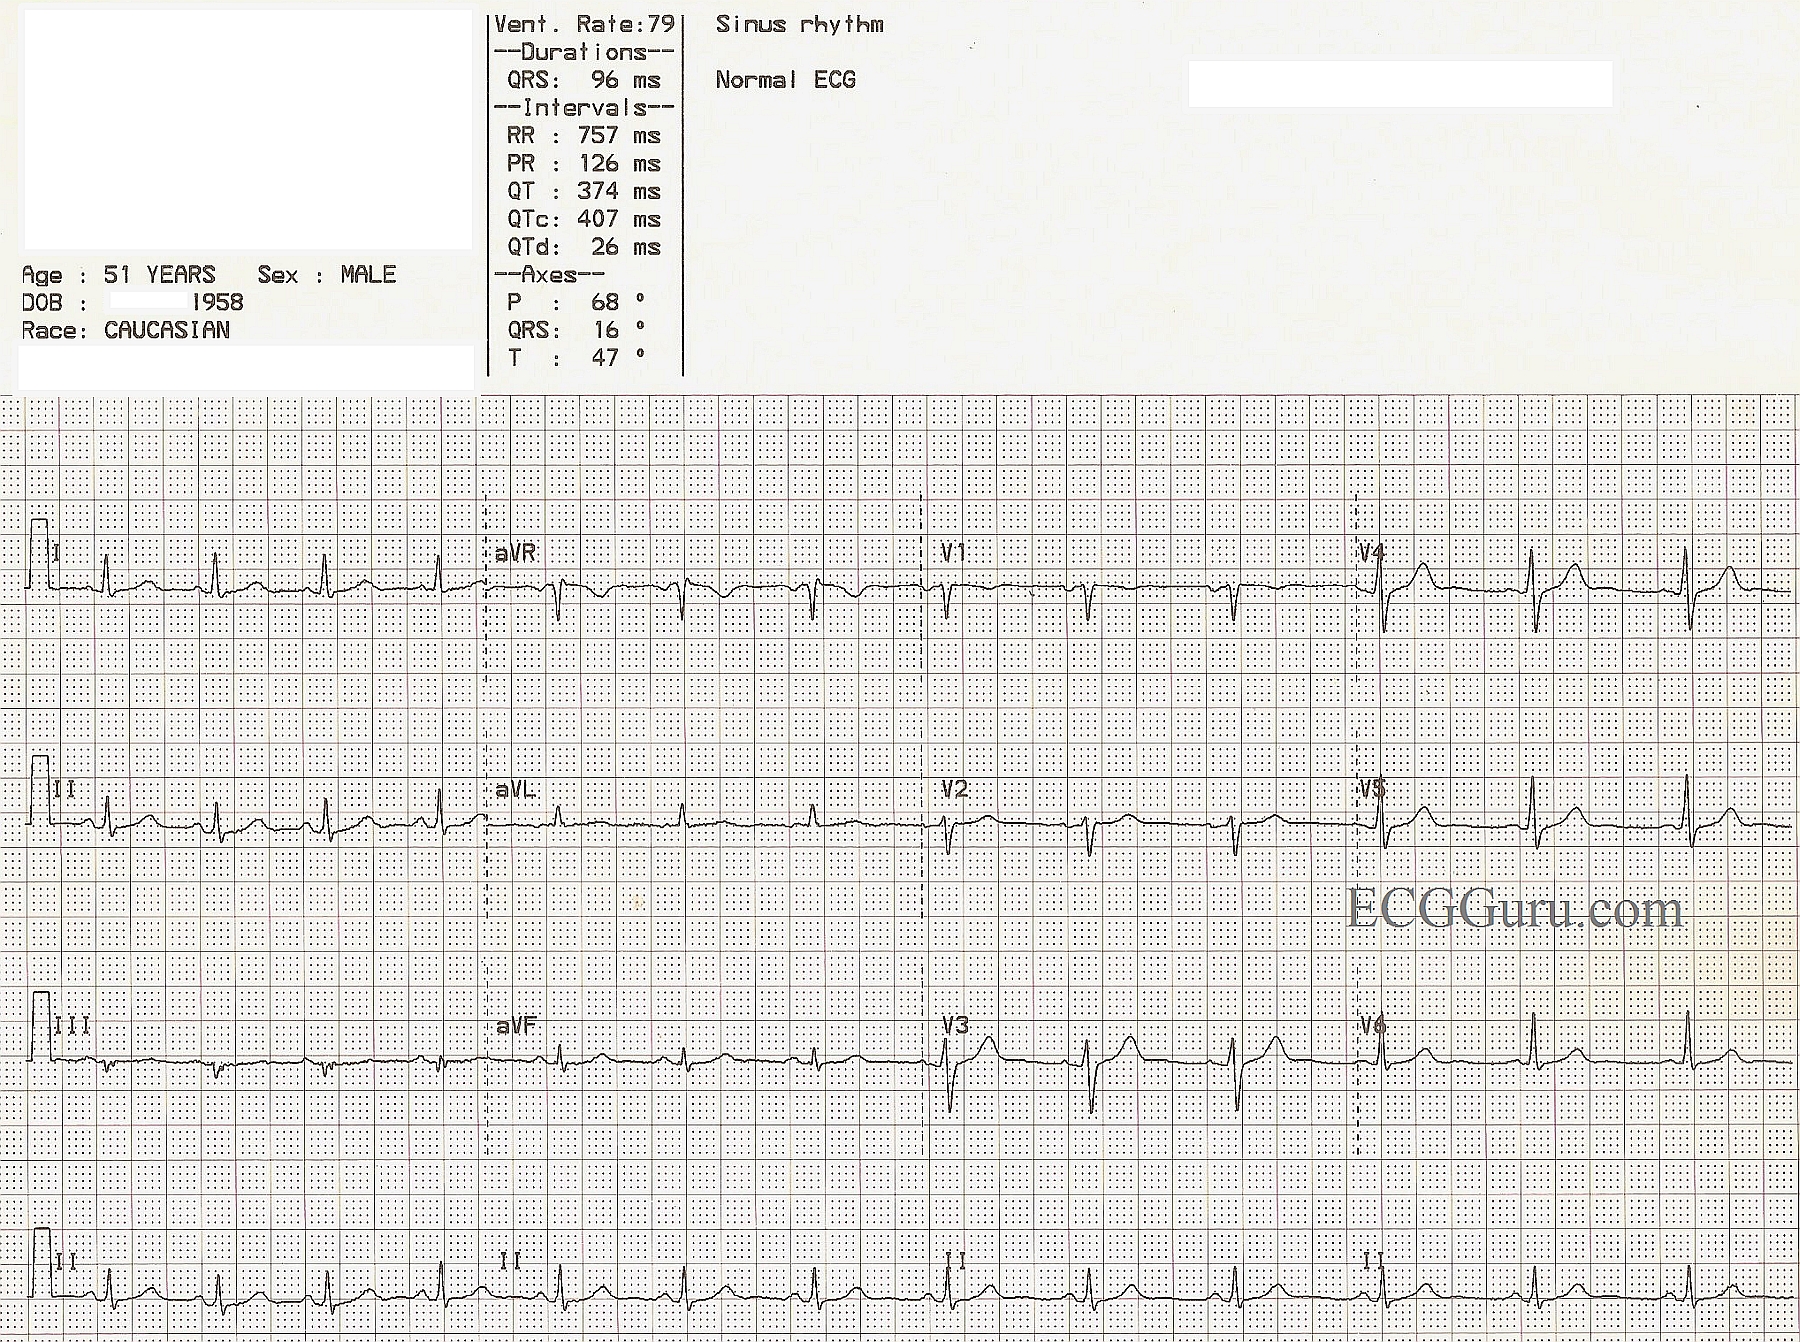
Up until now, we have posted basic rhythm strips in this area of the ECG Guru for those of you who are teachers of beginning students. Today, we offer a "normal" 12-Lead ECG for those desiring to introduce students to the 12-Lead format. It is always best to become familiar with normal before venturing into the realm of "abnormal". Encourage your students to find what they know to be normal, then add to their knowledge. Examples of findings which are within normal limits are: rate, rhythm, P wave morphology, QRS morphology, intervals, axis, R wave progression, ST segments, and T wave direction.
While advanced practitioners can almost always find something that is not "normal", we must remember that that can be said about almost any human body. This ECG was taken from a healthy volunteer with no medical complaints.
A nice, normal ECG for your collection. It always helps to have a normal ECG for your students to compare to the abnormal examples you show them. It pays to teach the characteristics of "normal" to your students so that they might readily recognize "abnormal". One could argue that the voltage in this ECG is rather low, but that can be explained by body habitus. Whether you are teaching basic rhythm interpretation, axis determination, R wave progression, or intervals, this ECG can be of help to you. Remember, if you are teaching students who have not yet learned 12-lead interpretation, the bottom line of a four-channel ECG is usually a rhythm strip - most often Lead II. It is easy to download this image, then crop it using any photo management program to include only the rhythm strip. At the ECG Guru, we use Irfanview for the Instructors' Collection ECGs.