
Submitted by Dawn on Sat, 09/06/2014 - 15:03
Wide-QRS rhythms can be difficult to diagnose from the ECG alone. This difficulty is compounded when the rate is fast, as it can be hard to determine if P waves are present before the QRSs, or dissociated, or absent.
This ECG and rhythm strip were donated to the ECG Guru by Ryan Cihowiak. We don't have clinical information on the patient, unfortunately. It is a great example, however, of how difficult WCT can be to diagnose.
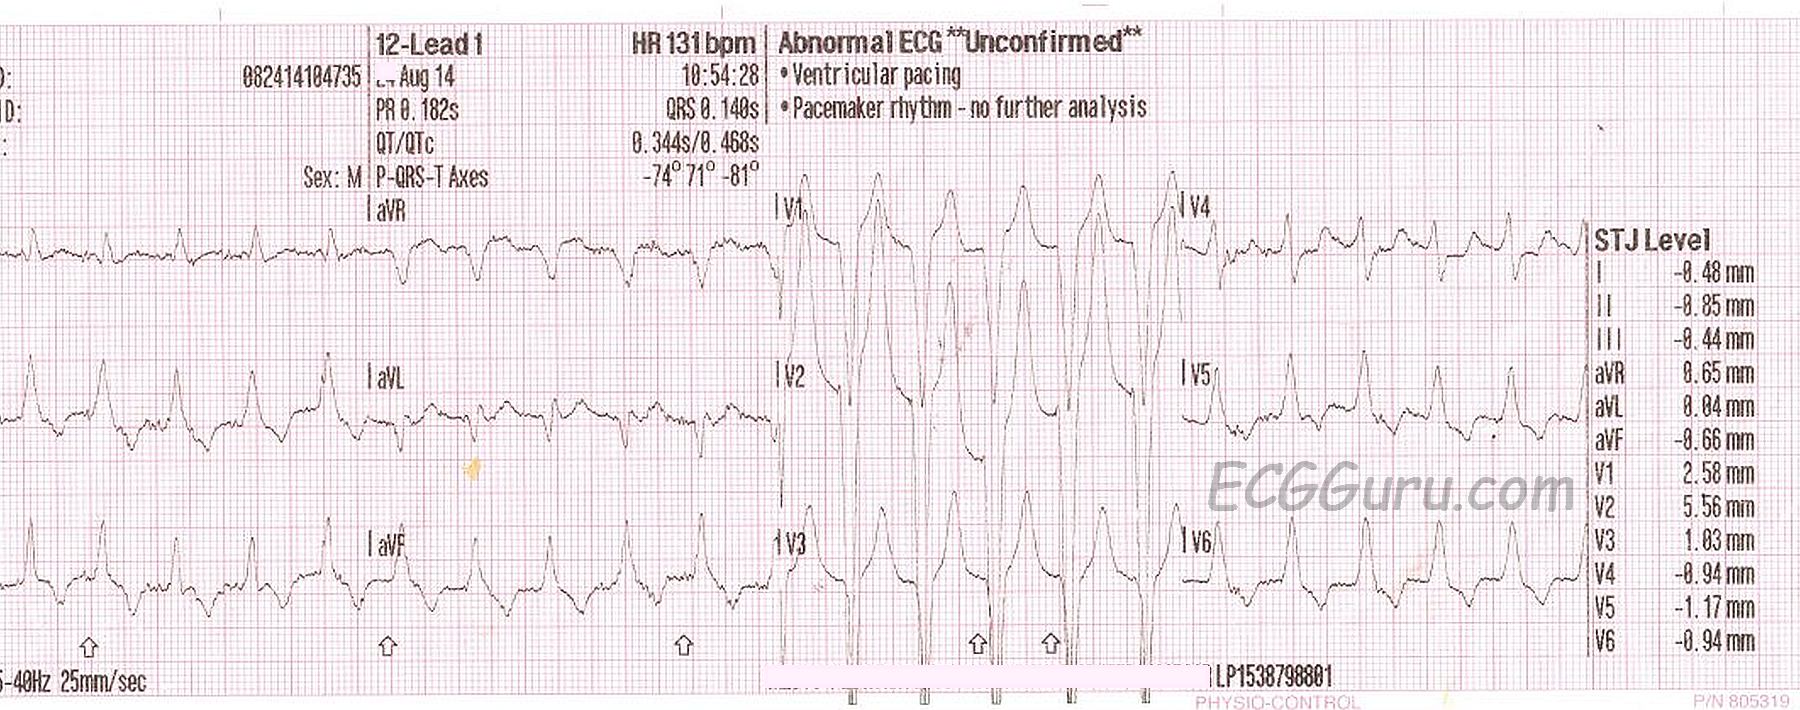
In the 12-Lead ECG, we see wide QRS complexes that are regular at a rate of 131 / minute. There are no obvious P waves before the QRS complexes, and no obvious distortion of the T waves, which would suggest a "hidden" P wave. Unfortunately, there is significant artifact, which makes searching for P waves difficult. The pattern overall suggests left bundle branch block, with the negative QRS in Lead V1 and positive QRS complexes in Leads I and V6. However, one requirement for the diagnosis of LBBB is a supraventricular rhythm, and P waves are the best indicator of that. An irregularly-irregular rhythm, indicating atrial fib, would also have made LBBB more likely. In typical LBBB, the frontal plane axis is usually left-normal or left. In this ECG, Lead III is taller than Lead I, putting the axis within normal range, but slightly rightward.
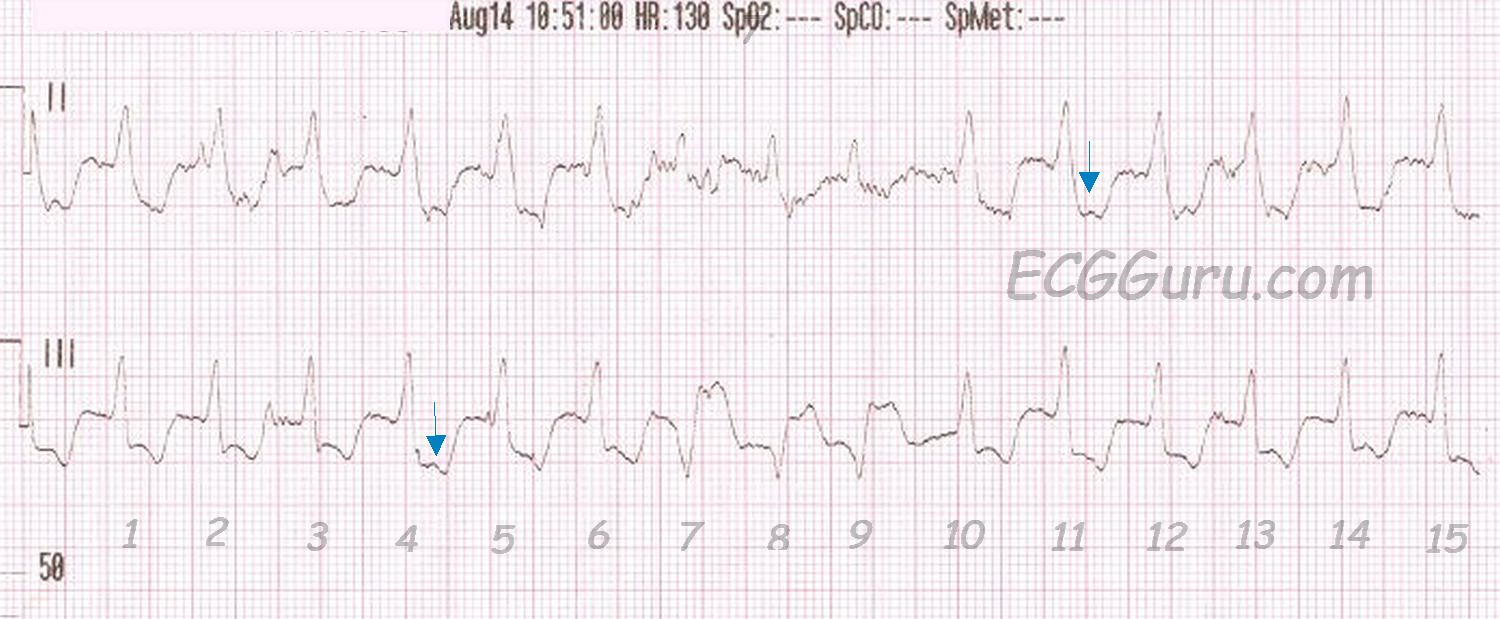
The rhythm strip uncovers something else. Possible P waves are seen in some of the ST segments (arrows). Are these dissociated? Do they represent a first-degree AV block? Are they actually artifact? If this is a supraventricular rhythm, there is LBBB. Then, notice beats #7,8,9. If this rhythm is supraventricular (with LBBB), those must be a salvo of V Tach. But, one of the possible P waves occurs in front of beat #7.
Another possibility is Right Ventricular Outflow Tract Tachycardia. RVOT is a type of V Tach that typically has a LBBB pattern, with a slightly rightward axis. If this is the case, beats #7,8,9 are probably "capture" beats or "fusion" beats. Capture and fusion beats "prove" that the underlying tachycardia is ventricular, since, by definition, capture and fusion represent a return to supraventricular control of the rhythm.
What do you think about this ECG? Remember, when WCT exists, it should be TREATED AS VENTRICULAR TACHYCARDIA until proven otherwise. Emergency treatment of VT (and WCT) is chosen based on the patient's clinical condition. The unstable patient should be immediately electrically cardioverted, as this is effective in VT and in SVT, provides immediate relief of the tachycardia, and has few side effects, if any.
The ECG GURU website thanks Ed Burns of Life In the Fast Lane (http://www.lifeinthefastlane.com ) for providing a SUPERB reference source for all things ECG and more!
Related Terms:
Rate this content:
All our content is FREE & COPYRIGHT FREE for non-commercial use
Please be courteous and leave any watermark or author attribution on content you reproduce.
Comments
Either Supraventricular (with LBBB) or VT - But We Do Not Know
Ken Grauer, MD www.kg-ekgpress.com [email protected]
Comment thread from EKG Club on FaceBook
Because the discussion thread about this ECG on FaceBook's EKG Club was so interesting, I am copying it heree for those who missed it:
· Frank Ay the p waves after #4 and #11 make me want to say AV dissociation. #7,8, and 9 may be fusion beats. Which suggests the whole this is VT. Thoughts?
September 3 at 6:18am · Like · 1
·
Ryan Tee Heng Seong Think those are conducted beats
Arrows showing P waves
Which makes this a VT complicated by inferior MI
September 3 at 6:22am · Edited · Like
·
Ken Grauer I'm not convinced from the 12-lead that this is VT ... Instead - I see a regular WCT (wide-complex tachycardia) with lots of baseline artifact and QRS morphology that may be consistent with complete LBBB. I'd interpret this one as "Regular WCT without sinus P waves of uncertain etiology"
On the other hand - the rhythm strip shows a CHANGE in QRS morphology for beats #7,8,9 in the middle of the tracing in lead III - so that suggests VT until proven otherwise. That said - this would make the NEGATIVE complexes in lead III the VT beats - as the upright complexes in the lead III rhythm strip look identical to what the QRS in the 12 lead looks like - which supports my suspicion that the 12-lead is supraventricuar with LBBB. I am not certain of this - but that would be my working assumption pending clinical circumstances ...
As to the blue arrows - maybe and maybe not. I am not a big advocate of AV dissociation UNLESS you can be certain you see it. When present - AV dissociation is GREAT, as it is diagnostic of VT. But in my experience - too many folks go searching for P waves when there are none. I see far too much baseline noise on this tracing to place much stock in the "bumps" under the blue arrows (just my 2 cents).
Any follow-up?
September 3 at 9:23am · Like
·
Dawn Altman Sorry, no followup as of yet. How about LBBB pattern with slightly rightward axis = RVOT tachycardia?
September 3 at 5:24pm · Like · 2
·
Ken Grauer @ Dawn - My thoughts (as mentioned above) = I wasn't certain what the regular wide tachycardia without normal P waves in the top ECG was ... It is only when I see the bottom strip - that we can say beats #7,8,9 are a salvo ( = VT). We are then able to deduce that the top ECG is probably supraventricular - since QRS morphology in this top 12-lead is similar to the non-VT beats in the lower rhythm strip ...
September 4 at 5:21am · Like
·
David Richley Just to play devil's advocate - is it possible that beats 7,8 & 9 are capture/fusion beats and that the rest of the ECG is RVOT VT? There is a possible p wave before beat 7 but I can't see one before beat 10. Not saying, just asking! It's a pity the tracing isn't of better quality.
September 4 at 5:55am · Like · 2
·
Ken Grauer Sure it is possible- but given the QRS in lead II, the QRS in lead III just didn't look supraventricular to me (esp with that ST segment) - but I admit to not knowing for sure ...
September 4 at 7:56am · Like
Dawn Altman, Admin