
Submitted by jer5150 on Sat, 09/14/2013 - 07:26
Patient's clinical data: 56-year old man.
At Dawn's request, this month's ECG is laying down the foundation for a topic she wanted me to eventually talk about on the ECG Guru. On this ECG, I'm not just looking for the obvious disturbance of rhythm. This type of ECG is literally begging for a laddergram to help reveal the mechanism responsible for a couple of very subtle and rare findings.
Discovering the full interpretation will take careful observations and measurements with calipers.
This ECG would definitely qualify as an "advanced". How do I know this? The only book I've ever seen an example of this mechanism was in Pick & Langendorf's book titled Interpretation of Complex Arrhythmias.
Have fun deciphering the interpretation!
Rate this content:
-

- jer5150's blog
- Log in or register to post comments
All our content is FREE & COPYRIGHT FREE for non-commercial use
Please be courteous and leave any watermark or author attribution on content you reproduce.
Comments
Atrial flutter with ?
Obviously we all know this is atrial flutter without doubt..On careful measuring the RR intervals, i found one peculiar thing - RR intervals are the same every 2 cycles ( RR#1 is the same as RR#3, RR#2 is the same as RR#4 )
Im still learning so I couldnt really postulate the mechanism of this peculiar pattern..My explanation is as follows:
The further flutter wave from QRS gets conducted - lots of concealed conduction prolonging the PRI causing the QRS complex to appear slightly later
In the next cycle, the junctional rhythm fires prematurely causing all the flutter waves are blocked, further prolonging the PR interval, for the next flutter wave in the next cycle to be conducted
So this constitutes AFT with Premature Junctional Bigeminy?
Im sure im wrong but nice to learn !!!!
Ryan
AFlutter with Group Beating
I see Atrial Flutter with Group Beating (repetitive short-long cycles). To me - this has always meant dual block within the AV node with Wenckebach conduction out of the AV node. I think Jason has a much more intriguing mechanism in mind. I can't wait to see his explanation and laddergram for this tracing.
Ken Grauer, MD www.kg-ekgpress.com [email protected]
AFlutter
Interesting EGK. I think the clue of these repetitive short long cycles lie in the AV node, probably with double pathways each one blocked in an alternate form.
INTERPRETATION
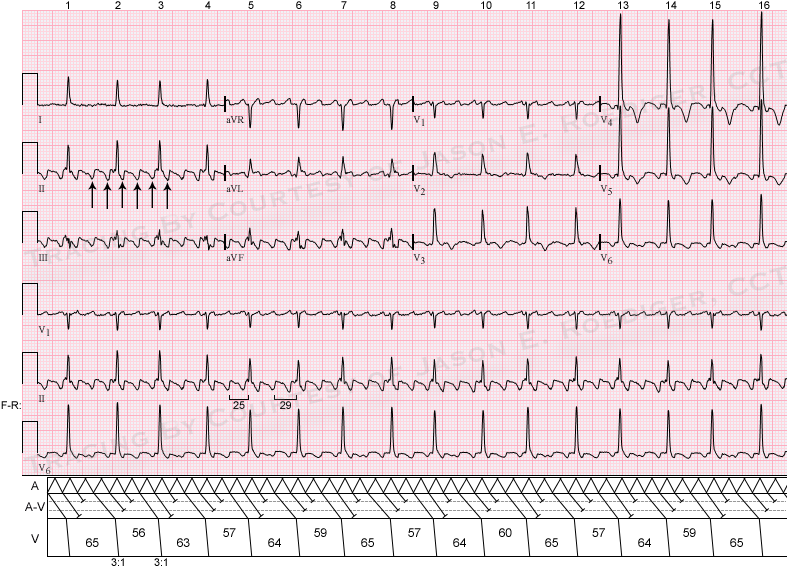
INTERPRETATION:(1.) Atrial flutter (rate = 291/min) with 3:1 A-V conduction reducing the ventricular rate to about 97/min.
(2.) Alternating degrees of concealed conduction (CC) by every 3rd atrial impulse causing a very subtle bigeminal pattern (see laddergram).
COMMENTS:
The atrial flutter itself is typical. Note the sawtooth (i.e., “picket fence”) appearance in the inferior leads. In V1, they appear as little, upright P-like waves and in V6 they appear as inverted P-like waves. As is usually the case, the flutter waves are barely discernible in lead I. A textbook atrial flutter with 3:1 A-V conduction has an atrial rate of 300/min with a resulting ventricular rate of 100/min. Here the respective atrial and ventricular rates are very comparable to those textbooks rates. Quite often I’ve noticed that people interpret 4:1 atrial flutter as being 3:1 atrial flutter because they don’t use their calipers to march out the flutter waves. Invariably, they overlook the flutter wave that is superimposed on the larger QRS complex. Even-numbered ratios (e.g., 2:1, 4:1, 6:1, etc.) are much more common than odd-numbered ratios (e.g., 1:1, 3:1, 5:1, etc.)
The computer of the electrocardiograph simply interpreted this ECG as “Atrial flutter Variable AV block, Abnormal ECG”.
There are many causes of bigeminal patterns but this is one of the most uncommon forms. Usually when atrial flutter with associated with bigeminal patterns, it is a result of alternating 2:1 and 4:1 ratios with 2 anatomic levels of conduction. There is a 2:1 “filtering” at a higher level in the A-V node and a 3:2 Wenckebach conduction at the level below that. The mechanism here involves 3 anatomic levels of conduction as illustrated in the A-V tier. Note the 3 levels separated by the grey horizontal, dashed lines.
Typically in atrial flutter, the F-R interval is between 0.26s and 0.46s. Here the F-R intervals alternate between about 0.25s and 0.29s but fall within an acceptable range. In hundredths of a second, the ventricular cycles alternate between a mean average of 58 and 64.
REFERENCE/SOURCE:
(1.) Pick, A., and Langendorf, R.: Interpretation of Complex Arrhythmias. Philadelphia, Lea & Febiger, 1979, p.402-403
(2.) Marriott HJL., and Conover, M.B.: Advanced Concepts in Arrhythmias. 2nd ed. St. Louis: C.V. Mosby, 1998, p. 313
(3.) Fisch, C.: Electrocardiography of Arrhythmias. Philadelphia, Lea & Febiger, 1989, p. 155-172
(4.) http://int-prop.lf2.cuni.cz/heart_sounds/ekg4/ekg9.jpg
(5.) http://sitemaker.umich.edu/ecgtutorial/files/flutter3.jpg
(6.) http://epfellow.files.wordpress.com/2011/11/flutter-scaled1000.png
Jason E. Roediger - Certified Cardiographic Technician (CCT)
[email protected]