
Submitted by Dawn on Tue, 12/15/2015 - 21:20
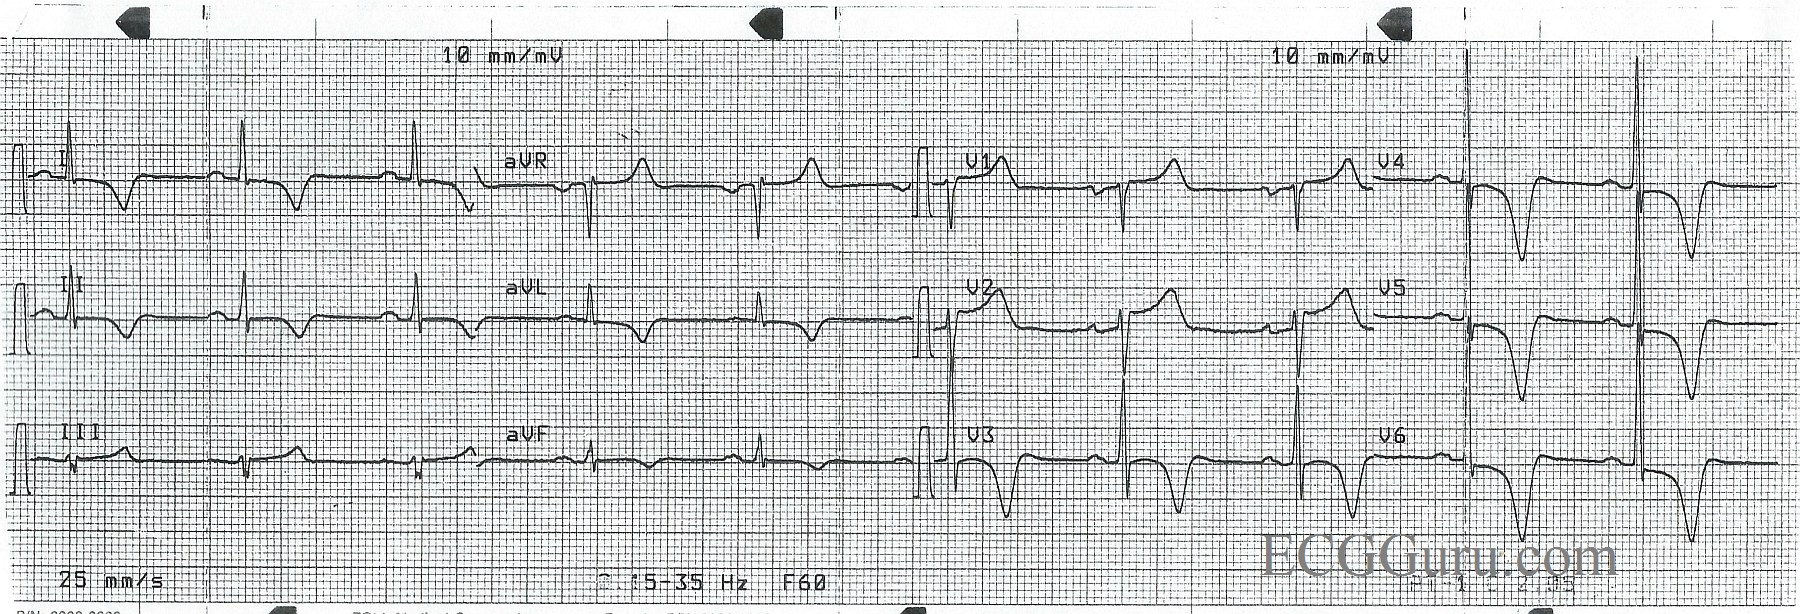
This ECG is from a 50-year-old man with chest pain. Unfortunately, we don’t have any other clinical information. This tracing is a good example of widespread, symmetrical inverted T waves. Inverted T waves are present in Leads I, aVL, II, and V3 through V6. (The anterior-lateral leads). There are ST segment elevations in Leads V1 and V2.
Many conditions can cause inverted T waves, and bedside assessment is necessary to make a certain diagnosis. Some T wave inversions are benign, such as in persistent juvenile T wave pattern. Some can be due to life-threatening problems like pulmonary embolism, CNS injury, and cardiac ischemia. T wave inversions can be secondary to conditions like left ventricular hypertrophy, left bundle branch block, and ventricular rhythms. When T waves are deep and symmetrical as they are here, they may be a sign of acute coronary syndrome, or cardiac ischemia. Since we know this patient had chest pain, and there is some ST elevation, this should be considered as a cause for his T wave changes.
In addition to the dramatic T waves, he also has P waves suggestive of “P mitrale”, or left atrial enlargement. The P waves in Lead II are wide (about 10 or 11 ms) and just over 1 mv tall. This is “borderline” for most LAE criteria. The P waves in Lead V1 are biphasic, with the second portion negatively deflected and over 1 mv deep. Acute myocardial infarction can cause left ventricular dysfunction, which can cause backup pressure to the left atrium.
Inverted T waves, like all ST and T wave changes, should always be assessed in the context of the patient presentation, history, and previous ECGs, if available.
References: Consultantlive.com, Dr. Ken Grauer
Related Terms:
Rate this content:
All our content is FREE & COPYRIGHT FREE for non-commercial use
Please be courteous and leave any watermark or author attribution on content you reproduce.
Comments
Chest Pain and Giant T Wave Inversion
The ECG in the Figure was obtained from a 50-year old man with chest pain. Unfortunately, as Dawn notes — No other clinical information is available. That said, not knowing any more about the clinical scenario actually enhances the discussion value of this tracing.
Descriptive Analysis: The rhythm is sinus at a rate of about 60/minute. The PR and QRS intervals are normal. Despite the remarkable T wave appearance — the QTc (ie, QT interval corrected for rate) does not appear to be long. That is, the QT interval we measure is clearly less than half the R-R interval. We estimate the QTc to be at most 0.44 second. In general, the QT is normal if less than 0.44 second — and clinical concern from QT prolongation is usually minimal with values below 0.50 second. The axis is normal (approximately +20 degrees). Voltage for LVH is clearly present, with overlap between QRS complexes in leads V4, V5 and V6.
Clinical Impression: Clinical correlation is essential for optimal interpretation of this tracing. To summarize the above findings — there is sinus rhythm at ~60/minute with LVH and ST segment coving with deep symmetric T wave inversion in multiple leads. These are “Giant T Waves” — which are said to exist when the depth of T wave inversion clearly exceeds 5 mm in at least several leads. The reason this classification is helpful, is that it focuses our attention to considering the List of clinical entities most commonly associated with this Syndrome. These clinical entities include:
It should be obvious that more history is needed on this patient in order to hone in on the above differential diagnostic list. That said — close scrutiny of the tracing can begin to narrow our diagnostic considerations.
BOTTOM LINE: The ECG shows sinus rhythm, LVH and giant T wave inversion consistent with ischemia and/or LV “strain”. Clinical correlation is needed. An Echocardiogram would be revealing! Comparison with a prior tracing would be invaluable for determining whether or not the ST-T wave changes are new or longstanding. While one cannot rule out the possibility of ischemia that could be acute on the basis of this single ECG — My hunch is that these changes are longstanding and are probably not acute.
P.S. The question arises as to whether or not there is LAA (Left Atrial Abnormality) on this tracing. Having observed numerous cardiologists over the years interpret tracings such as this one for atrial abnormality — there seems to be no consensus among them regarding when to declare the presence of “LAA”. My bias ( = my interpretation of the literature on this subject) — is that both sensitivity and specificity of the ECG for true left atrial chamber enlargement is poor. If one needs to assess atrial chamber dimensions — then an Echocardiogram is needed. As a result, my bias is to undercall LAA on ECG, since positive predictive value of the criteria is so poor. Although others (including some cardiologists) may disagree — I would not interpret P wave morphology in the Figure as demonstrating limb lead P wave duration of ≥0.12 second, nor of fitting a small box within the negative component of the P wave in lead V1. In fact, notching of the P wave seems most pronounced in lateral chest leads — which is a picture more consistent with an intra-atrial conduction defect rather than atrial enlargement. That said — Statistically, this patient with marked LVH is likely to have associated atrial enlargement simply on that basis. Bottom Line: I would not argue with either saying there is or is not LAA. And, because of the marked LVH, a large left atrium may well be present. But from my perspective of ECG interpretation — criteria for LAA are not met. (CLICK HERE for full Review of “My Take” on the ECG Diagnosis of LAA and RAA).
Ken Grauer, MD www.kg-ekgpress.com [email protected]
An Important Lesson
Once again, Dawn, thanks for posting another "difficult call." Actually, the important lesson to be learned here is that it is very unwise to try to make a diagnosis from a 12-lead ECG alone. The 12-lead ECG is an adjunct and often raises more questions than it answers. Clinical history is always very important. However, sometimes we just don't have it.
My appreciation to Dr. Grauer for an excellent discussion of the subject of giant T wave inversion. I think any student of electrocardiography should pay very close attention to Dr. Grauer's analyses of the various ECGs on this site. He is very methodical and meticulous in his approach to ECG interpretation which is absolutely necessary; otherwise, something small - but very important - could be missed. And many extremely important findings can be very small and very, very subtle!
I really don't have too much to add other than to say that - while I don't feel as though I myself undercall LAA - I must agree with Dr. Grauer that the evidence for LAA really doesn't appear to be present. The P terminal force is < 1.0 in Lead V1 and the P wave in Lead II is not quite wide enough for me to call LAA. I'm also not all impressed with the P wave notching. P wave notching in the frontal plane leads is quite common - really a normal variant (when the P wave width is WNL). However, the notching found when P mitrale is present is usually not difficult at all to see.
But I find the T wave inversions rather odd - perhaps a bit atypical for LVH alone. First, LVH doesn't explain the T wave inversions in Leads II and aVF (or, as far as I am concerned, in V3 either). The T wave inversions in precordial leads V3 - V6 are a bit unusual in that all the QRS complexes have terminal S waves. V3 even has a bit of ST elevation with an upward convexity. The inverted T waves are not totally symmetrical either - the return to the baseline takes less time than the descent to the nadir of the T wave. However, the typical T wave inversions of a secondary repolarization abnormality begin at the J point. Now, the J point may itself be depressed - but the downward slope into the T wave begins there and the slope is immediate. These inverted T's in the precordial leads begin their descent after the J point following a short plateau in all cases.
A very complex situation. I would suspect a combination of LVH with pathological T wave inversions (primary repolarization abnormality).
Jerry W. Jones MD FACEP FAAEM
https://www.medicusofhouston.com
Twitter: @jwjmd
An Afterthought
If the patient were not having chest pain at the time the ECG was taken, I supposed he could have an atypical "Wellens' syndrome" involving an occlusion of a Type 3 LAD distal to D1 (with pre-existing LVH). But I'm not sure if any such a phenomenon has been reported. Wellens syndormes typically involve a very proximal LAD occlusion - hence the involvement of Lead V2.
Jerry W. Jones MD FACEP FAAEM
https://www.medicusofhouston.com
Twitter: @jwjmd
Thank You Dr. Jones
Thank you Dr. Jones for your interesting commentary! I believe we are on the same line of the same page regarding the interpretation of this tracing. What I typically write down on my interpretation for ST-T waves such as these in the context of increased QRS amplitude is, “LVH and strain and/or ischemia; Clinical correlation needed” — with the added consideration in this case being the entities most commonly associated with giant T waves. Thanks again for your input!
Ken Grauer, MD www.kg-ekgpress.com [email protected]