Dawn's picture

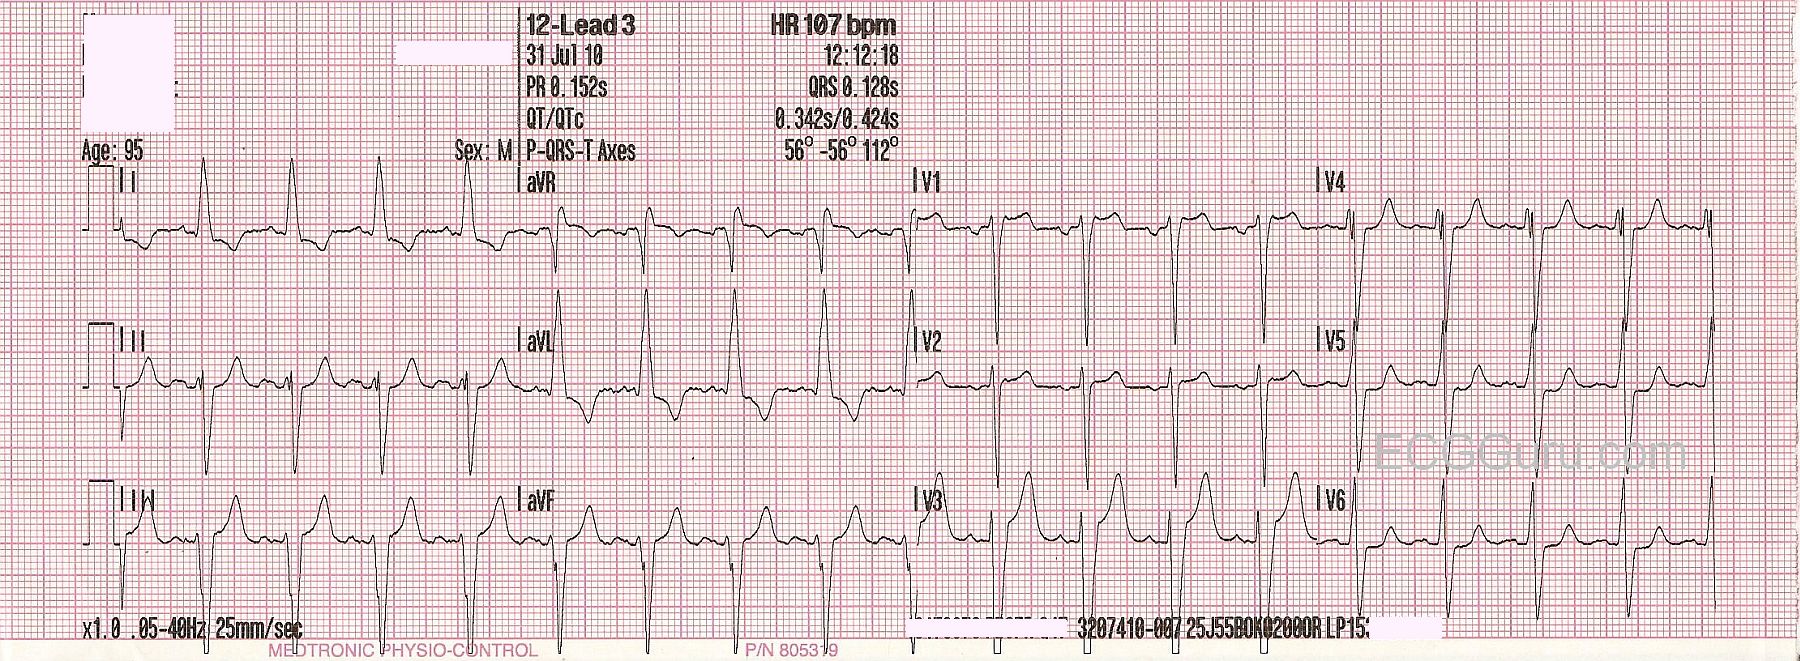
This ECG Challenge is taken from a 95-year-old man.  We do not know his clinical information, except that he called 911 for assistance.  We also do not have information on his past medical history.  The QRS complexes are wide, and there are P waves present.  What do you think the etiology of this rhythm is?

Feb. 22, 2017 UPDATE:  The wide complexes in this ECG indicate an intraventricular conduction defect.  The most likely IVCD at this man's age is left bundle branch block.  However, the morphology of the QRS complexes in V5 and V6 are NOT typical of LBBB.  Usually, there is very little or no S wave in those leads.  We cannot confirm that lead placement is correct, and failing to place the left sided electrodes (V4 through V6) correctly can affect the transition of the R waves in the precordial leads.  It would be SO helpful to know more about this patient, of course, but a lot is possible by age 95.

For a more in-depth look at this ECG, please refer to the Comments below.

Related Terms: 
Rate this content: 
Average: 3.7 (3 votes)

Comments

Jerry W. Jones MD FACEP's picture

Dawn...
 
Once again, a very interesting ECG with lots of intermediate and advanced teaching points:
 
Patient is a 95 y/o male who felt distressed enough to call 911. No other information.
 
Rhythm: Sinus Tachycardia with Wide QRS Complexes
Rate: 107
 
Ventricular rhythm and rate match atrial rhythm and rate. One must always remember that ECGs and rhythm strips are recording TWO entities: atria and ventricles. Whenever anyone gives you a rhythm strip and asks the rate - that's a trick question! When discussing dysrhythmias, there are always two rates to consider: atrial and ventricular.
 
The QTc is unremarkable at 424 msec. I calculate the QRS duration to be between 0.13 and 0.14 seconds. This represents a complete LBBB (cLBBB).
 
There is notching in the descending limbs of the inferior leads which most likely represents an old inferior MI (these do not represent Cabrera or Chapman signs, however).
 
There is J-point elevation in aVR, V1 and V3. Very minimal J-point elevation is present in V2 but it's less than a millimeter. The elevation in aVR has an upward convexity while V1 and V3 have an upward concavity. This is not at all typical of acute ischemia but given the little that we know about this patient we should reserve judgement.
 
The P waves in Leads II and aVF are wide and notched which suggests left atrial abnormality. The P wave in V1 is almost totally negative and the P-terminal force is certainly > 1.0 which also suggests left atrial abnormality.
 
The axis is reported at -56 degrees which appears correct. More on this in just a moment.
 
The R wave in aVL is quite tall. Does that indicate left ventricular hypertrophy (LVH)? Even though the height of the R wave is much greater than 11 mm, we can only say "probably." I say "probably" because there is a left anterior fascicular block (LAFB) present also. LVH is not going to push the mean QRS axis in the frontal plane all the way to -56 degrees but LAFB certainly can. The fact that the transition lead in the horizontal plane is right at lead V6 is also typical of LAFB (but not LVH or cLBBB, for that matter). If leads were recorded well past V6 the typical tall, notched monophasic R wave with repolarization abnormality of cLBBB would eventually appear. The marked left axis deviation due to the LAFB has caused the appearance of the significant S waves in V5 and V6 along with the delayed R wave progression. And, of course, there is always a tall R wave in aVL when LAFB is present.
 
Now the question many would ask is: how can you have a left anterior fascicular block when you already have a cLBBB? The answer is surprisingly simple. In cLBBB, the left ventricle is activated by the right-to-left passage of the activation wave front across the septum. If it enters the posterior fascicle, the posterior fascicle is activated first followed by the anterior fascicle - the same process as in an actual LAFB (assuming, of course, that it has entered distal to the block). If the block is higher up in the common bundle, the activation front may travel up the septum to the portion of the common bundle just distal to the block and then the left ventricle is activated normally - but it's still activated after the right ventricle, so we still have a cLBBB. In such a case, there is a cLBBB but no left axis deviation unless there was a pre-existing LAFB! So, while intuitively, it seems that there should be no fascicular block if there is a cLBBB, it can happen and it isn't that unusual! Since we have no other information on this patient, we don't know if the LAFB was pre-existing or not.
 
But I also said that the tall R wave in aVL "probably" represented LVH. That's based on two things: first, about 90% (or more) of patients with cLBBB have been found at autopsy to have significant LVH. Second, the left atrial abnormality is also very suggestive. But there is always a tall R wave in aVL when LAFB is present, so my impression is that we can definitely make the diagnosis of LAFB based on the ECG findings (which explains the left axis deviation) but we can also surmise with more than a fair degree of confidence that LVH is also present based on the abnormal P waves and statistics (and perhaps some contribution to the remarkable height of the R wave in aVL).
 
Leads I and aVL are tall, large and have repolarization abnormalities. aVL has a minuscule q wave but that happens from time to time in cLBBB. It's a function of the position of the septum relative to the left arm electrode.

Jerry W. Jones MD FACEP FAAEM
https://www.medicusofhouston.com
Twitter: @jwjmd

All our content is FREE & COPYRIGHT FREE for non-commercial use

Please be courteous and leave any watermark or author attribution on content you reproduce.