
Submitted by Dawn on Fri, 01/17/2014 - 21:39
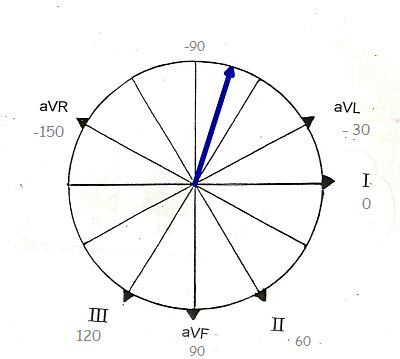
If you are teaching frontal plane axis to your students, you will need to teach them HOW to determine the axis - usually beginning with the QRS axis and then adding the P and T waves. But, you also need to teach them WHY we measure axis, to provide relevance to something that may seem challenging to beginners. There are many ECG interpretations that rely heavily or are dependent upon the determination of the axis.
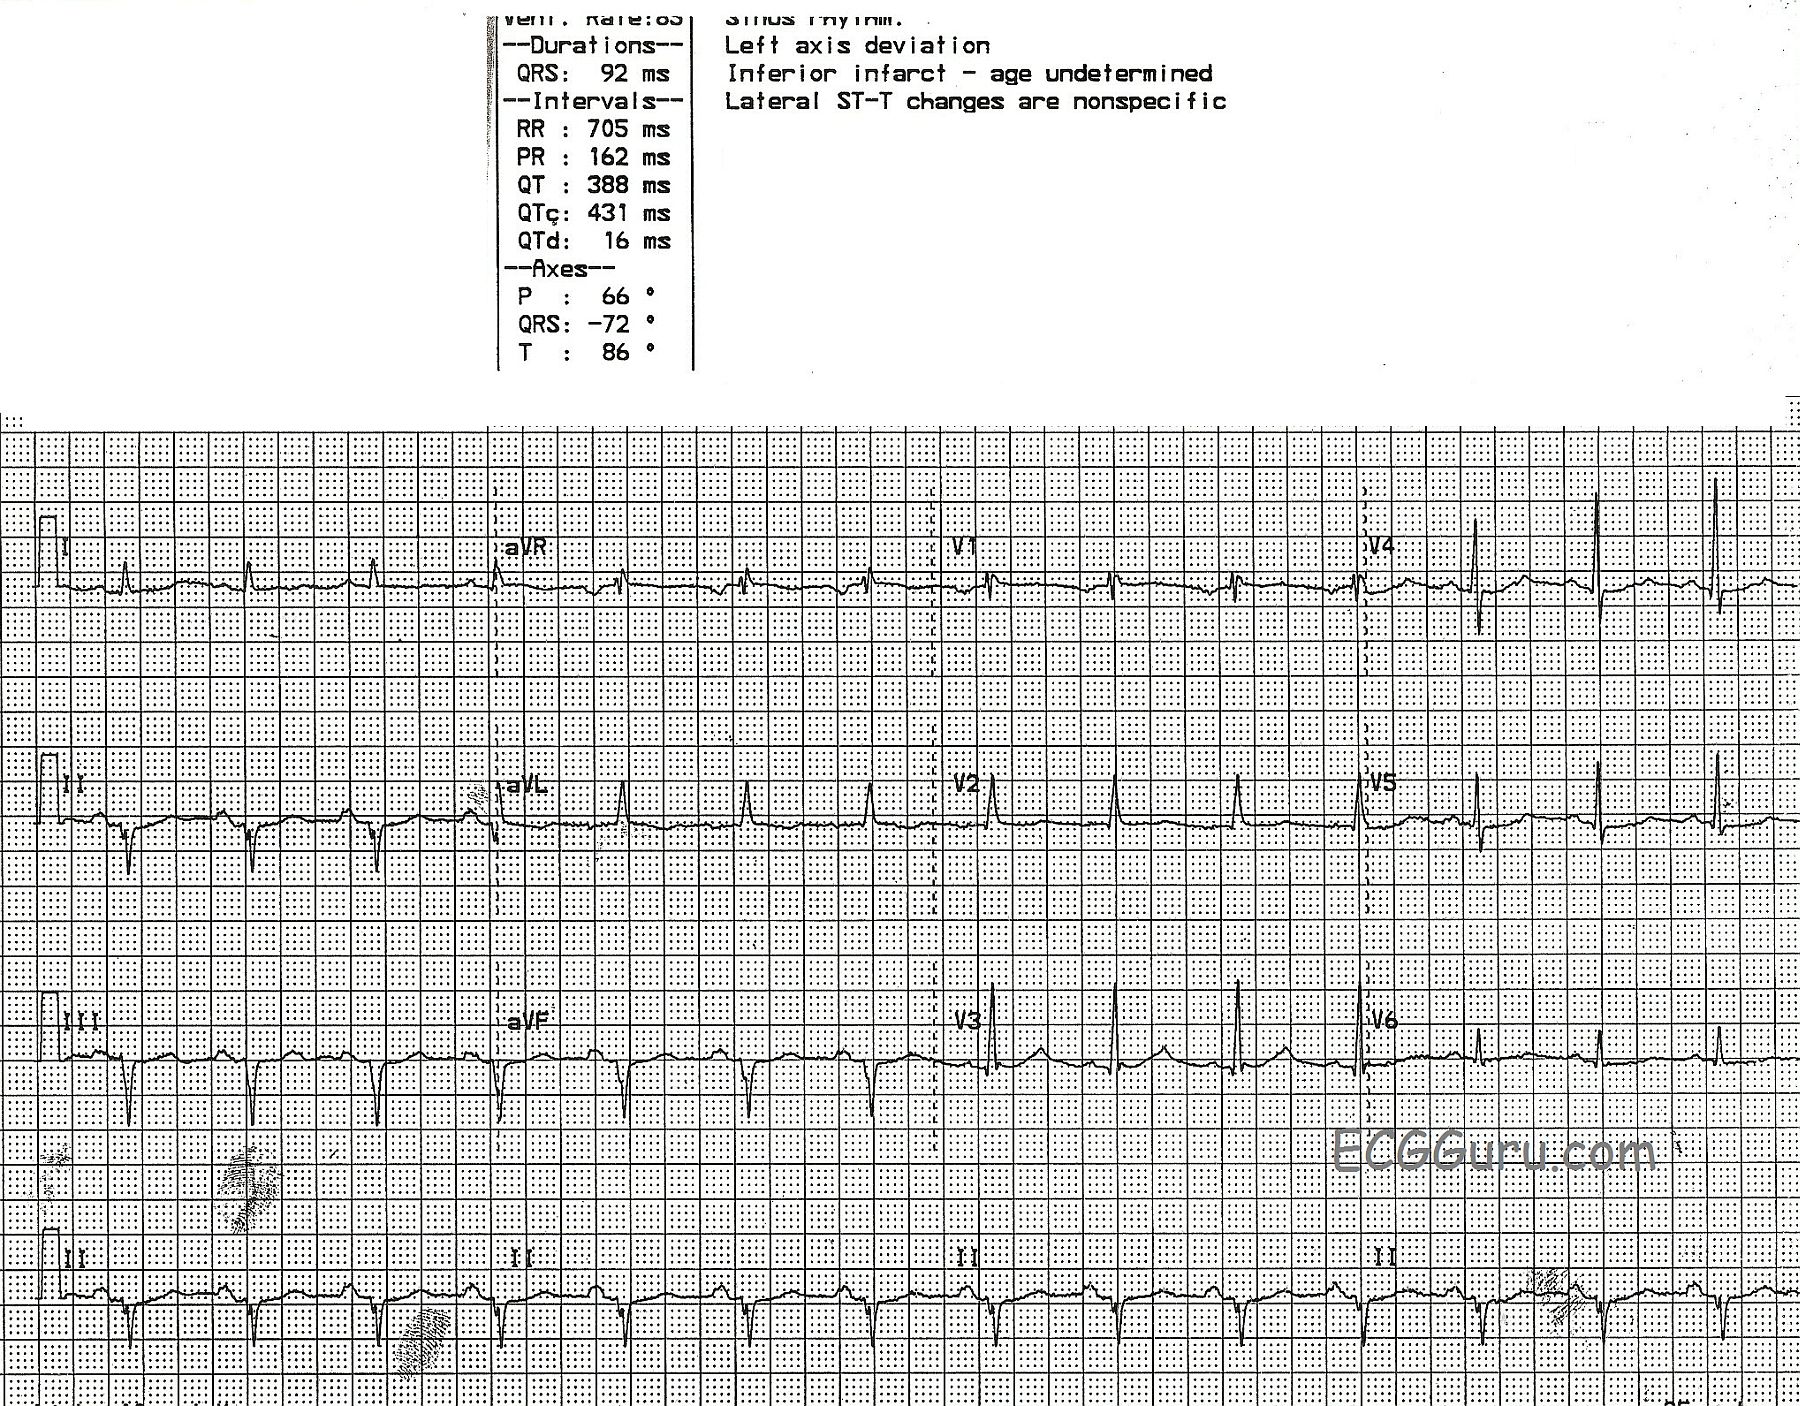
This ECG is a great example of left axis deviation. The cause is readily discernible, if your students know the ECG signs of myocardial infarction. This patient had an inferior wall M.I. in the distant past, and now has pathological Q waves in Leads II, III, and aVF. Pathological Q waves in related leads in a patient with history of M.I. are a sign of necrosis, or permanent damage, in that part of the heart. The inferior wall has lost an extensive amount of tissue, which is now electrically inactive as well as mechanically inactive. (You may also find it helpful to show students videos of ventriculograms showing normal LV function and hypokinesis of the LV due to M.I.) Because of the loss of electrical activity in the inferior wall, the "mean" electrical direction (or axis) is AWAY from the inferior wall. That is, the electricity travels AWAY from II, III, and aVF and TOWARD I and aVL.
Many of the blogs and webpages listed in our "Favorites" address the subject of axis determination. Here is one from Cardio Rhythms Online if you would like a review.
Related Terms:
Rate this content:
All our content is FREE & COPYRIGHT FREE for non-commercial use
Please be courteous and leave any watermark or author attribution on content you reproduce.
Comments
Question
(You may also find it helpful to show students videos of ventriculograms showing normal LV function and hypokinesis of the LV due to M.I.) - See more at: http://ecgguru.com/comment/reply/546#comment-form IS THIS POSSIBLE????
R Wave up V1-2, help poss RVH???
Not sure about your question.
Hi, Marionnurse- the R wave progression IS faulty here. Possibly poor lead placement. Sometimes it is hard to find a tracing that perfectly illustrates one thing without some other, inexplicable flaws creeping in.
If you were asking about the ventriculograms, VERY possible. We have posted several ventriculograms on this site on the "resources" page. Also on the ECG GURU YouTube channel. With a little practice, you will soon realize that ventriculograms are pretty easy to read. Compare the normal VG with the one with a stunned inferior wall. You will readily see what M.I. can do to the myocardium. Echocardiogram (ultrasound) is great for this, too, but I think it is harder to "see" if you are not experienced. My students have always responded well to visual material.
Perhaps some of the other Gurus out there will comment on the R wave progression in the chest leads.
Dawn Altman, Admin
R-waves
Given the old infeior MI I was willing to attribute the tall R-waves in V2 and V3 to concomitant old posterior MI.
Vince D
http://www.medialapproach.com
Agree with Vince
Agreed - and that changes the R wave progression (or the horizontal axis) - a good topic for more advanced students. Thanks, Vince!
Dawn Altman, Admin
Lahb ?
Can u comment on leftward axis beyond -60 ? My understanding is that an inferior MI or other causes are UNlikely to cause an axis beyond -45 and so bundle branch disease (LAHB)would have to exist despite the inferior MI
Marked LAD with Inferior MI
There are some unusual happenings on this ECG. The rhythm is sinus. Intervals are normal. There is marked LAD - with an estimated axis of -70 degrees. There is no chamber enlargement. Regarding QRST Changes:
CLINICAL IMPRESSION: It is difficult to know what to make of this tracing. The QS complexes in the inferior leads are virtually diagnostic of prior inferior MI - especially with the notching in the downslope of the QS in lead II. We suspect associated LAHB (Left Anterior HemiBlock) is present in view of the markedly leftward axis. Added to this is IRBBB (incomplete RBBB) - plus an unusal qR pattern in leads V2,V3 with early transition between V2-to-V3. Whether these anterior precordial lead findings represent prior posterior infarction or scarring from cardiomyopathy is uncertain. Perhaps an Echo, serial tracings and more clinical follow-up will be needed in order to know for certain.
--------------------
Ken Grauer, MD www.kg-ekgpress.com [email protected]