
Submitted by Dawn on Fri, 02/12/2016 - 19:33
This is an interesting teaching ECG on many levels. It is obtained from a man with chest pain. No other history or follow up is available.
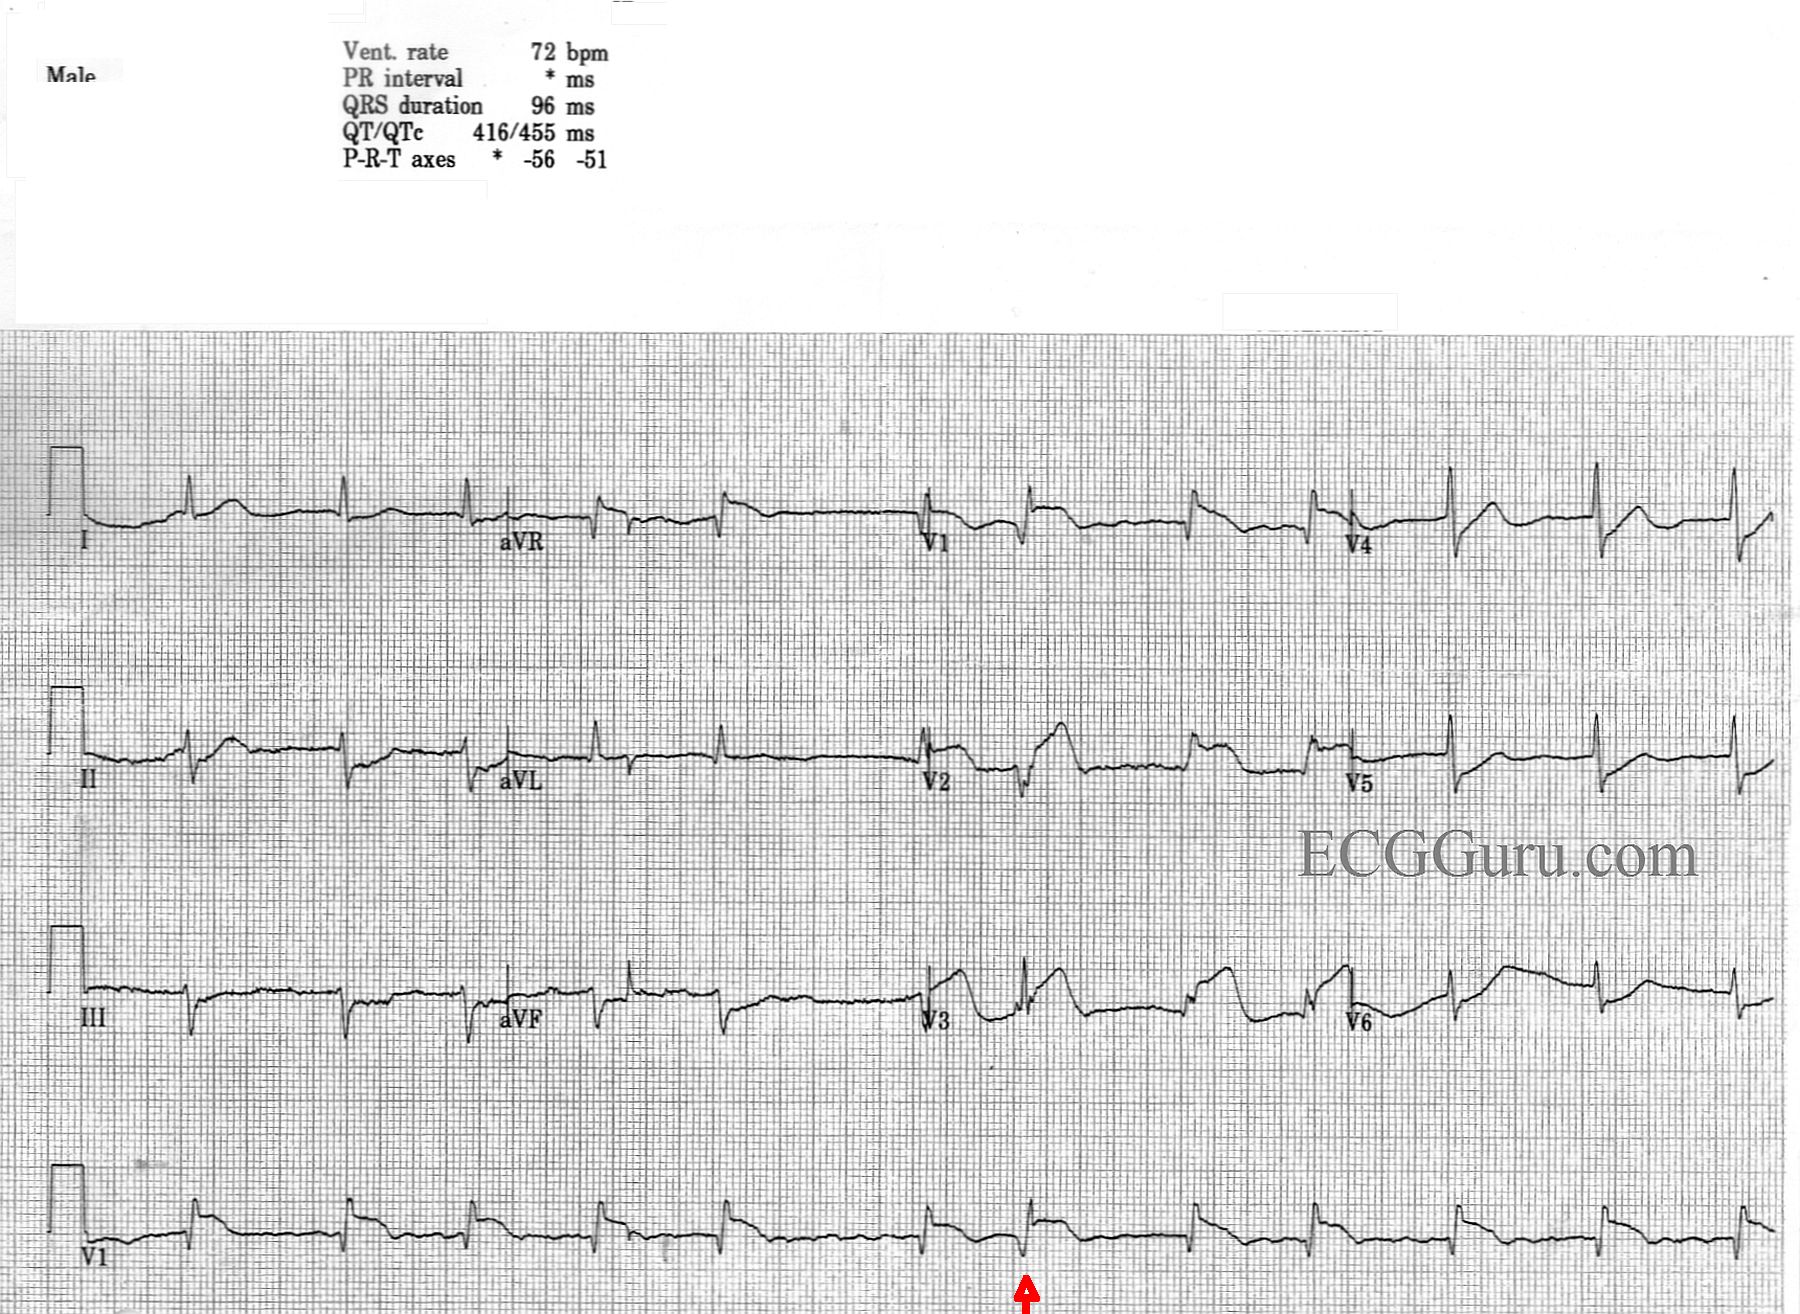
Acute M.I. Most striking is probably the clearly-seen anterior-septal wall M.I. There is ST segment elevation in Leads V1, V2, and V3, with ST depression in the low-lateral leads, V5 and V6. There is also ST depression in the inferior Leads II, III, and aVF. The ST elevations have a coved-upward (frown) shape in V1 and a straight shape in V2 and V3. Both of these ST shapes are abnormal and reflect injury. The depressions are presumed to be due to reciprocal changes, since there is no other ST-depression producing condition apparent. There are abnormal Q waves in V1, which could herald the onset of pathological Q waves, a sign of necrosis, in the anterior-septal wall.
Atrial Fibrillation Another very noticeable feature of this ECG is the irregularly-irregular rhythm, with an absence of P waves. This is atrial fibrillation with a controlled ventricular response. This rate of 72 bpm suggests that the rate has been controlled with medication or that the M.I. has slowed the conduction through the AV node. A fib is significant for this patient because the absence of P waves lowers cardiac output. It is more important than ever to keep this patient’s rate controlled, as a fast rate would combine with loss of atrial kick to lower cardiac output and increase myocardial demand – not a good situation for an M.I. patient.
Incomplete Right Bundle Branch Block The shape of the QRS in V1 and V2 is not typical. Those leads should have an rS pattern. The qR in V1 and rSR’ in V2 remind one of the right bundle branch block pattern, but the QRS is not wide. Leads I and V6 have narrow s waves, as well. This is called “incomplete right bundle branch block”.
FLB (Funny-looking Beat) The seventh beat in the strip, marked with an arrow, is different in appearance from all the others. This probably represents aberrant conduction. Usually aberrantly-conducted beats have wide QRS complexes, and this one does not. This different beat ends a short R-to-R cycle which followed a long R-to-R cycle. The refractory period is proportional to the R-to-R interval, becoming longer after a long cycle and shorter after a short cycle. When a long R-to-R interval occurs, the refractory period is lengthened in the next cycle. If that cycle has a short R-to-R, the beat ending the short cycle is more likely to fall into the refractory or relative refractory period. It is interesting, but probably not clinically significant.
Related Terms:
Rate this content:
All our content is FREE & COPYRIGHT FREE for non-commercial use
Please be courteous and leave any watermark or author attribution on content you reproduce.
Comments
AFib and Antero-Septal STEMI with an Early Beat
As per Dawn — the case is of a man with chest pain, with this being the only history known. I’d interpret this ECG as follows:
Interpretation: AFib with a controlled ventricular response — normal QRS and QT intervals — marked left axis (consistent with LAHB = Left Anterior HemiBlock) — incomplete RBBB — no chamber enlargement — and, findings consistent with acute anteroseptal STEMI from probable acute (or at least recent) proximal LAD (Left Anterior Descending artery) occlusion.
To this I’d add the following comments:
Although the QRS complex is not wide — there nevertheless are 2 forms of conduction abnormality present. LAHB is seen, as evident by a more-negative-than-positive QRS complex in lead II (indicating a leftward axis more negative than -30 degrees). The predominantly positive deflection in lead V1 in association with terminal s waves in leads I and V6 suggests RBBB. However, given a QRS complex that is definitely not widened — this is incomplete RBBB. If these conduction abnormalities are new and a result of the acute infarction — this could be a harbinger of the need for cardiac pacing.
As opposed to the typical triphasic (ie, rSR’) complex that is usually seen in lead V1 with complete or incomplete RBBB — there is a QR pattern seen here. This loss of initial r wave is consistent with septal involvement (and perhaps explains the conduction defects described above).
There is marked ST elevation in leads V1,V2,V3 — but no ST elevation in other chest leads. This is consistent with “antero-septal” location of the infarct. Proximal LAD occlusion is suggested by: i) the large amount of ST elevation in lead V1; ii) reciprocal ST depression in each of the inferior leads; and iii) significant ST elevation in lead aVR. The one unusual feature is lack of ST elevation in lead aVL, which is typically seen with LAD occlusion proximal to the 1st diagonal branch. However, the other features are highly suggestive of proximal LAD occlusion as the “culprit” artery.
Finally — The 7th beat in the long lead rhythm strip looks different (RED arrow). This difference is most marked in simultaneously-recorded leads V2, V3. The question arises as to whether this 7th beat is a PVC or an aberrantly conducted complex. Clinically, it won’t really matter — since management will not be altered regardless of the etiology of this beat. But discussion of the pros and cons for deciding between ventricular beat vs aberrant conduction may be insightful. The Ashman phenomenon is often evoked as definitive evidence that a wide beat following a relative pause is aberrantly conducted. The theory relates to the fact that with sinus rhythm, the duration of the relative refractory period (RRP) is directly related to the preceding R-R interval. This makes it more likely that an early beat following a relative pause will be more likely to occur during the RRP, and therefore conduct with aberration. However, the Ashman phenomenon is less reliable in the setting of AFib — so that it should not be used alone as sole criteria for determining aberration when the rhythm is AFib. In this tracing — note how much wider the Q wave is in lead V1 for the 7th beat compared to all other beats in the long lead rhythm strip. Not only is this Q wave wider — but the initial downslope of the Q wave is clearly slower than the very steep initial downslope for the other beats in V1. In addition — simultaneously-occurring leads V2,V3 show a very different looking complex for this 7th beat in a pattern not suggestive of any conduction defect. I therefore suspect beat #7 is ventricular in etiology, despite the long-short pattern we see. Perhaps the reason for beat #7 not being as wide as one usually expects is fusion with a supraventricular impulse … though this clearly is not a theory I can prove. Unfortunately, we’ll never know, because we don’t have follow-up — but the important point to appreciate is that we should not automatically conclude this 7th beat is aberrant simply because of the long-short sequence we see.
BOTTOM LINE: Regardless of the etiology of beat #7 — this tracing shows AFib with a controlled ventricular response, incomplete RBBB/LAHB — and, an acute anteroseptal STEMI most likely due to acute proximal LAD occlusion.
-------------------------------------------------
Additional Reading — on the Ashman Phenomenon:
Ashman explained — ECG Blog #70
Ashman in AFib — ECG Blog #71
Ken Grauer, MD www.kg-ekgpress.com [email protected]
Dear Sir:
Dear Sir:
Iwould like to be a member in your website
Alot of thanks
Reciprocal Changes
Dawn...
I have some EASY 12-lead ECGs I could send you ;-)!! Thank you for publishing an ECG that does bring up a controversial and often misunderstood topic: reciprocal changes. What appears to be a reciprocal change at times can be true ischemia at other times. This particular ECG raises a lot of possibilities. I would certainly appreciate hearing Dr. Grauer's thoughts and anyone else's opinion on this forum.
The main issue has already been pointed out by Dr. Grauer: there is very obvious ST depression in the inferior leads but absolutely no ST deviation in aVL. Here is the controversial issue:
When there are reciprocal changes in the inferior leads, which lead(s) are they reciprocal to? (Pardon my grammar!) I am a very firm believer that reciprocal changes must appear in leads that are in the same plane. In other words, the inferior leads cannot be reciprocal to V1 - V3. The frontal and horizontal planes are perpendicular to each other. They are, however, reciprocal to Leads I and aVL with most of the reciprocity being between leads III and aVL.
Let's talk about the mirror-image reciprocity: the kind you see when there is ST elevation in aVL and ST depression in lead III. These leads are not quite 180 degrees apart but they are close enough to produce some reciprocal change. If there were a high lateral infarction, the positive electrode for aVL would be sitting right over the affected area of the heart which now cannot conduct an impulse toward the electrode - either because the myocardium in that area is dead or because the cells, though still alive, are too ischemic to conduct. What the positive electrode for aVL sees is the impulse on the opposite side of the heart traveling in opposite directions and it will inscribe a mirror-image on the ECG paper. If you want to see a perfect mirror image, run a Lead I then switch the right and left arm electrodes and run it again. Both lead I's will be exact reciprocal images of each other.
However, there still remain those that feel that ST elevation in leads V1 - V3 can cause the same reciprocal changes in the inferior leads. I find that concept completely untenable because the two lead systems are perpendicular to each other. Hold a hand mirror in front of your face. The reflection you see is your reciprocal image (R is L, L is R). Now turn the mirror so that it is perpendicular to you, facing either straight up or straight down. Your image is not in that mirror any more because the mirror is no longer in the same plane as your face.
There is usually another explanation why an anterior MI may present with ST depression in the inferior leads but without changes in lead I or aVL. The RCA is usually dominant and supplies a good bit of the inferior surface of the heart. But let's say the RCA is significantly diseased itself and receives considerable collateral circulation from the LAD. Suddenly, the LAD itself becomes occluded. (In this case, it would be occluded proximal to the first septal perforator but distal to the first diagonal branch.) Not only does it show signs of a STEMI in its own distribution, but now the RCA has lost a good bit of its collateral circulation and it develops subendocardial ischemia in its distribution. If the LAD were occluded above the first septal perforator, one would now have an anteroapical STEMI (STE in V1 through perhaps V4) and ST depression in the inferior leads. But the ST depression in the inferior leads would not really be a reciprocal change, but rather something called "ischemia at a distance." That could even be the mechanism for this particular ECG. There is ST depression in leads V5 and V6 which could be due to two things (neither of which - I think - can be differentiated on this ECG): if there is right-sided dominance with a loss of collateral circulation to the RCA, then there could be ischemia caused by a reduction in circulation from the posterolateral branch of the RCA (which serves the area covered by leads V5 and V6) or the ST depression in V5 and V6 could actually be a reciprocal change to the ST elevation in V1 and V2 (V1/V2 and V5/V6 are supposed to be in the same plane and can show reciprocal change).
The lack of ST deviation in aVL remains puzzling, but we also mustn't forget that vascular anomalies are not rare.
Thanks again, Dawn, for a very informative teaching site.
Jerry W. Jones MD FACEP FAAEM
https://www.medicusofhouston.com
Twitter: @jwjmd