
Submitted by Dawn on Sat, 09/07/2013 - 00:09
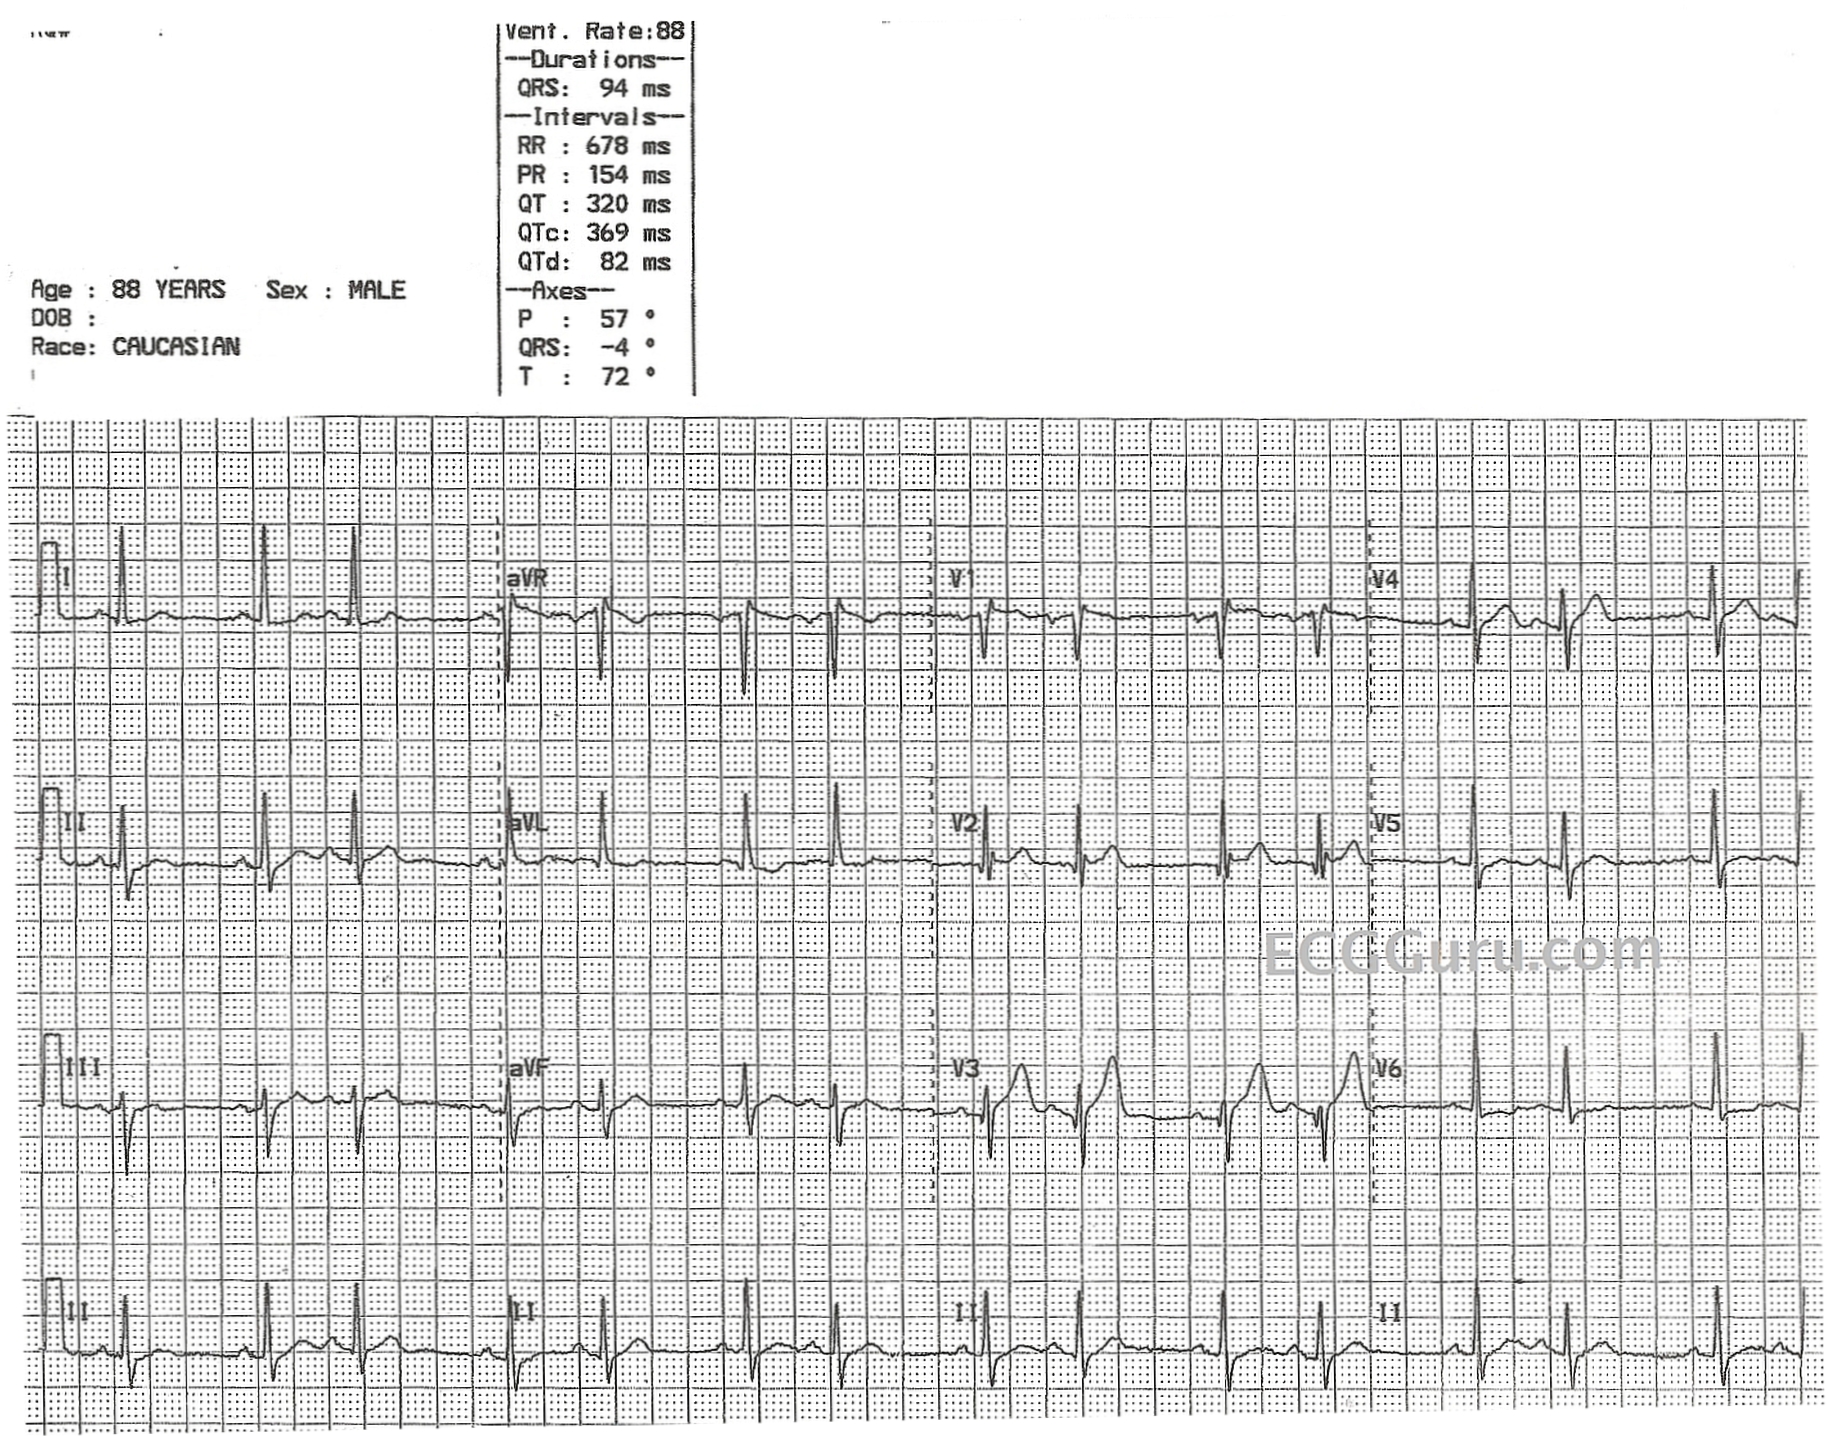
To continue a recent theme, we offer this ECG, which appears on quick glance to be an atrial bigeminy. On closer inspection, we do not see ectopic P' waves in the second conducted beats of each pair. In fact, the P waves look the same in both the first and second beats. However, if you look very closely (we enlarged the screen), you may notice that the second T wave of each pair is slightly larger with a slightly different morphology than the first T wave. If this distortion of the second T waves represents a PAC, the PAC is non-conducted and concealed in the T wave. If that concealed P wave is able to penetrate and depolarize the sinus node, we might expect the sinus node to be reset, and the next P wave and QRS combination is right on time.
So, what looks like an "atrial bigeminy" might actually be an "atrial trigeminy" - albeit with non-conducted PACs.
Also notable is the subtle ST elevation in V1, V2, and V3, which should be evaluated with clinical data. Unfortunately, we do not have information about the patient. Also, V2 and V3 do not represent normal or expected R wave progression. The chest leads should have rS patterns, and they should progress from small r waves and deep S waves in V1 with gradually taller R waves and shorter S waves across the chest wall. V6 should be, finally, all upright. We suspect lead reversal between V2 and V3, or misplacement of the electrodes in general. Also, the q waves in those leads seem misplaced, without the usual configuration of pathological Q waves in those leads.
We would love to hear your opinions about this interesting rhythm.
Related Terms:
Rate this content:
All our content is FREE & COPYRIGHT FREE for non-commercial use
Please be courteous and leave any watermark or author attribution on content you reproduce.
Comments
Lots to Speculate On ...
As per my Comment Title - there is LOTS to speculate on for this interesting tracing. Unfortunately - due to no history - no additional tracings on the patient - and baseline artifact - we'll never know for certain.
Ken Grauer, MD www.kg-ekgpress.com [email protected]
Mind you.... I'm JUST eyeballing this....
This looks like a 2˚ HB Mobitz II, because... I'm not seeing multiple underlying P-waves. I don't see a marching of P's and a firing of QRS's or Aberantly conducted QRS... its dropping a beat, without a increase in the P-R interval... so that's why I go with a 2˚ Mobitz II
Atrial bigeminy
I strongly suspect that his is atrial bigeminy. Admittedly the T wave of the 2nd beat of each pair is different from that of the first, but the QRS is different too. Slightly different depolarisation = slightly different repolaristaion. I think if there were a P wave on this T wave it would be more apparent, particularly in V1. With reference to Scott's comments, it can't be Mobitz II because we don't see non-conducted sinus P waves before the pauses. It's interesting how an apparently straightfroward ECG can generate so much discussion!
Dave R
Combined Voltage vs T Wave Alternans etc.
What a great 12-Lead...everyone has already covered the questions about lead placment etc. and bigeminy vs trigeminy. I can only report what I see and am left wondering about the alternating voltage in the T waves...Could it be T wave Alternans? The fact they are probably having an MI could be an indicator. I might be splitting hairs, but it also appears as though V4 is about 1 mm elevated...one more thing some type of incomplete BBB...V1 - V4 ST elevation and a BBB...not a good day for this patient.
P mitrale
Also appears to fit criteria for P mitrale.
A Late Comment
It's unfortunate that we don't have two consecutively conducted sinus beats. I certainly don't think that we are seeing a Mobitz II block because there are no obvious non-conducted P waves in areas where one would expect them to conduct. Also, I would expect the QRS complexes to be a bit wider. The precordial leads, I suspect, have not only been switched (V2 and V3) but probably placed an interspace or two too high on the chest wall (hence the r' in V1). I agree with Dr. Grauer that there are just too many unknowns here to make a definitive diagnosis. However, in trying to avoid sounding like a radiologist, I would call this an atrial bigeminy and thus also agree with Dr. Richley.
Jerry W. Jones MD FACEP FAAEM
https://www.medicusofhouston.com
Twitter: @jwjmd