
Submitted by Dr A Röschl on Wed, 01/17/2024 - 10:24
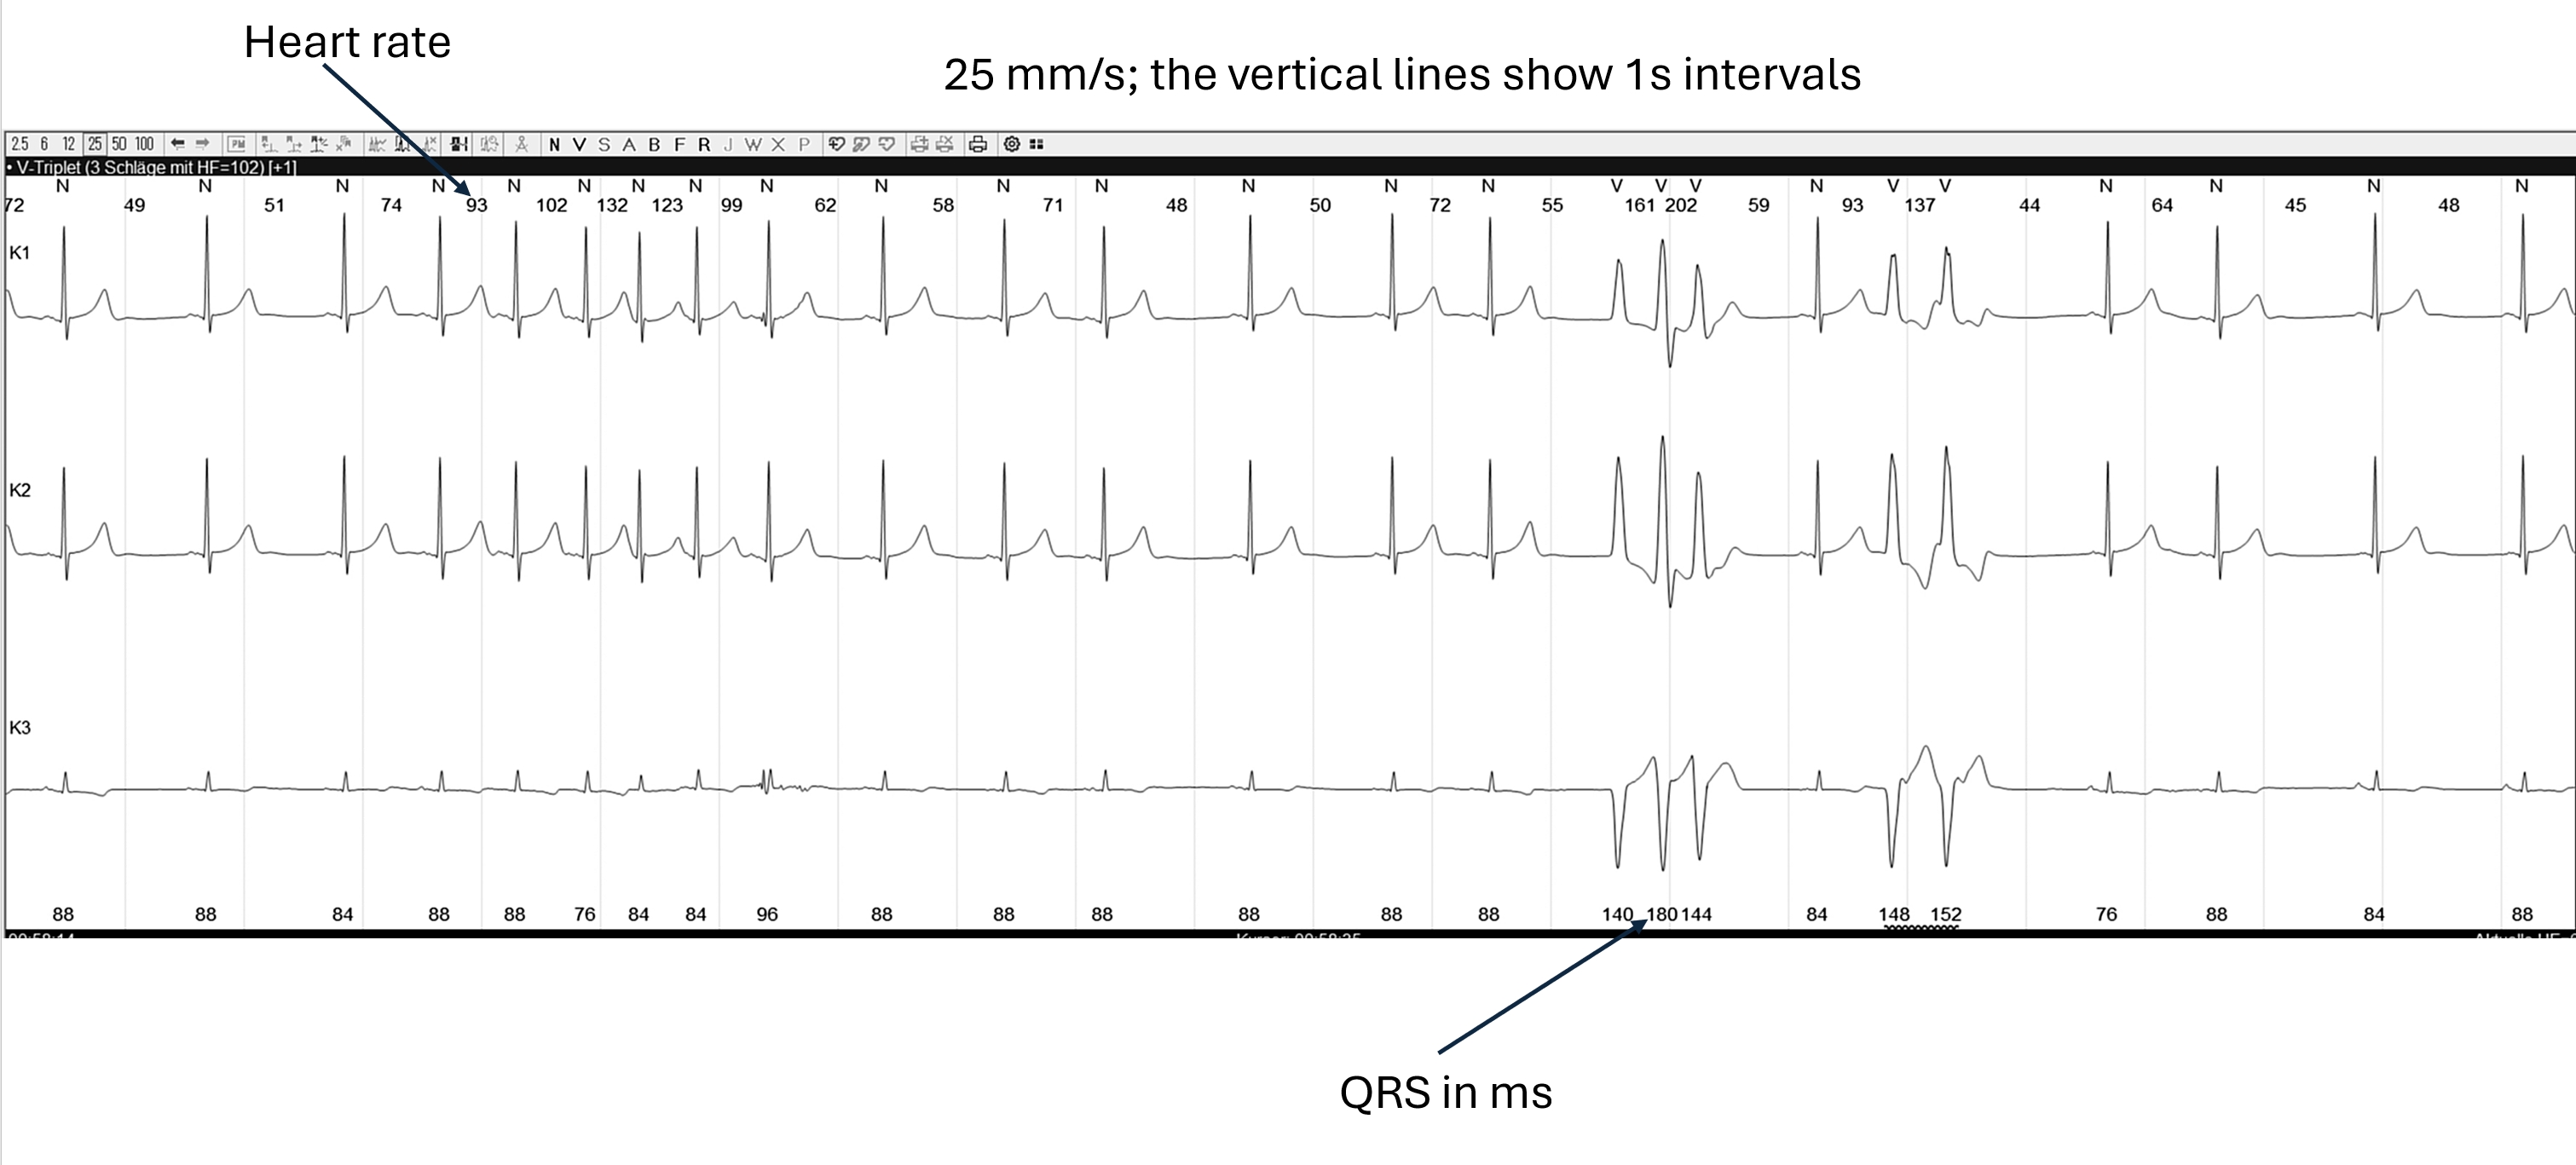
Here you can see a long rhythm strip from a Holter ECG, written at 25 mm/s. On the left, a sinus bradyarrhythmia can be seen first, followed by an atrial tachycardia. After a few beats this changes back into a sinus bradyarrhythmia. Then follows a short VT over 3 beats, after 1 sinus node beat then a ventricular couplet. Sinus bradyarrhythmia again at the end.
Rate this content:
-

- Dr A Röschl's blog
- Log in or register to post comments
All our content is FREE & COPYRIGHT FREE for non-commercial use
Please be courteous and leave any watermark or author attribution on content you reproduce.