
Submitted by Dawn on Sun, 08/16/2015 - 10:13
This ECG is nearly completely normal. We say "nearly" because there are VERY subtle changes which may or may not be chronic. Unfortunately, we know nothing about this patient's history or circumstances except age, gender, and race, and the fact that she was an Emergency Department patient. If she presented with chest pain, the ECG might be viewed completely differently than if she presented with a fever.
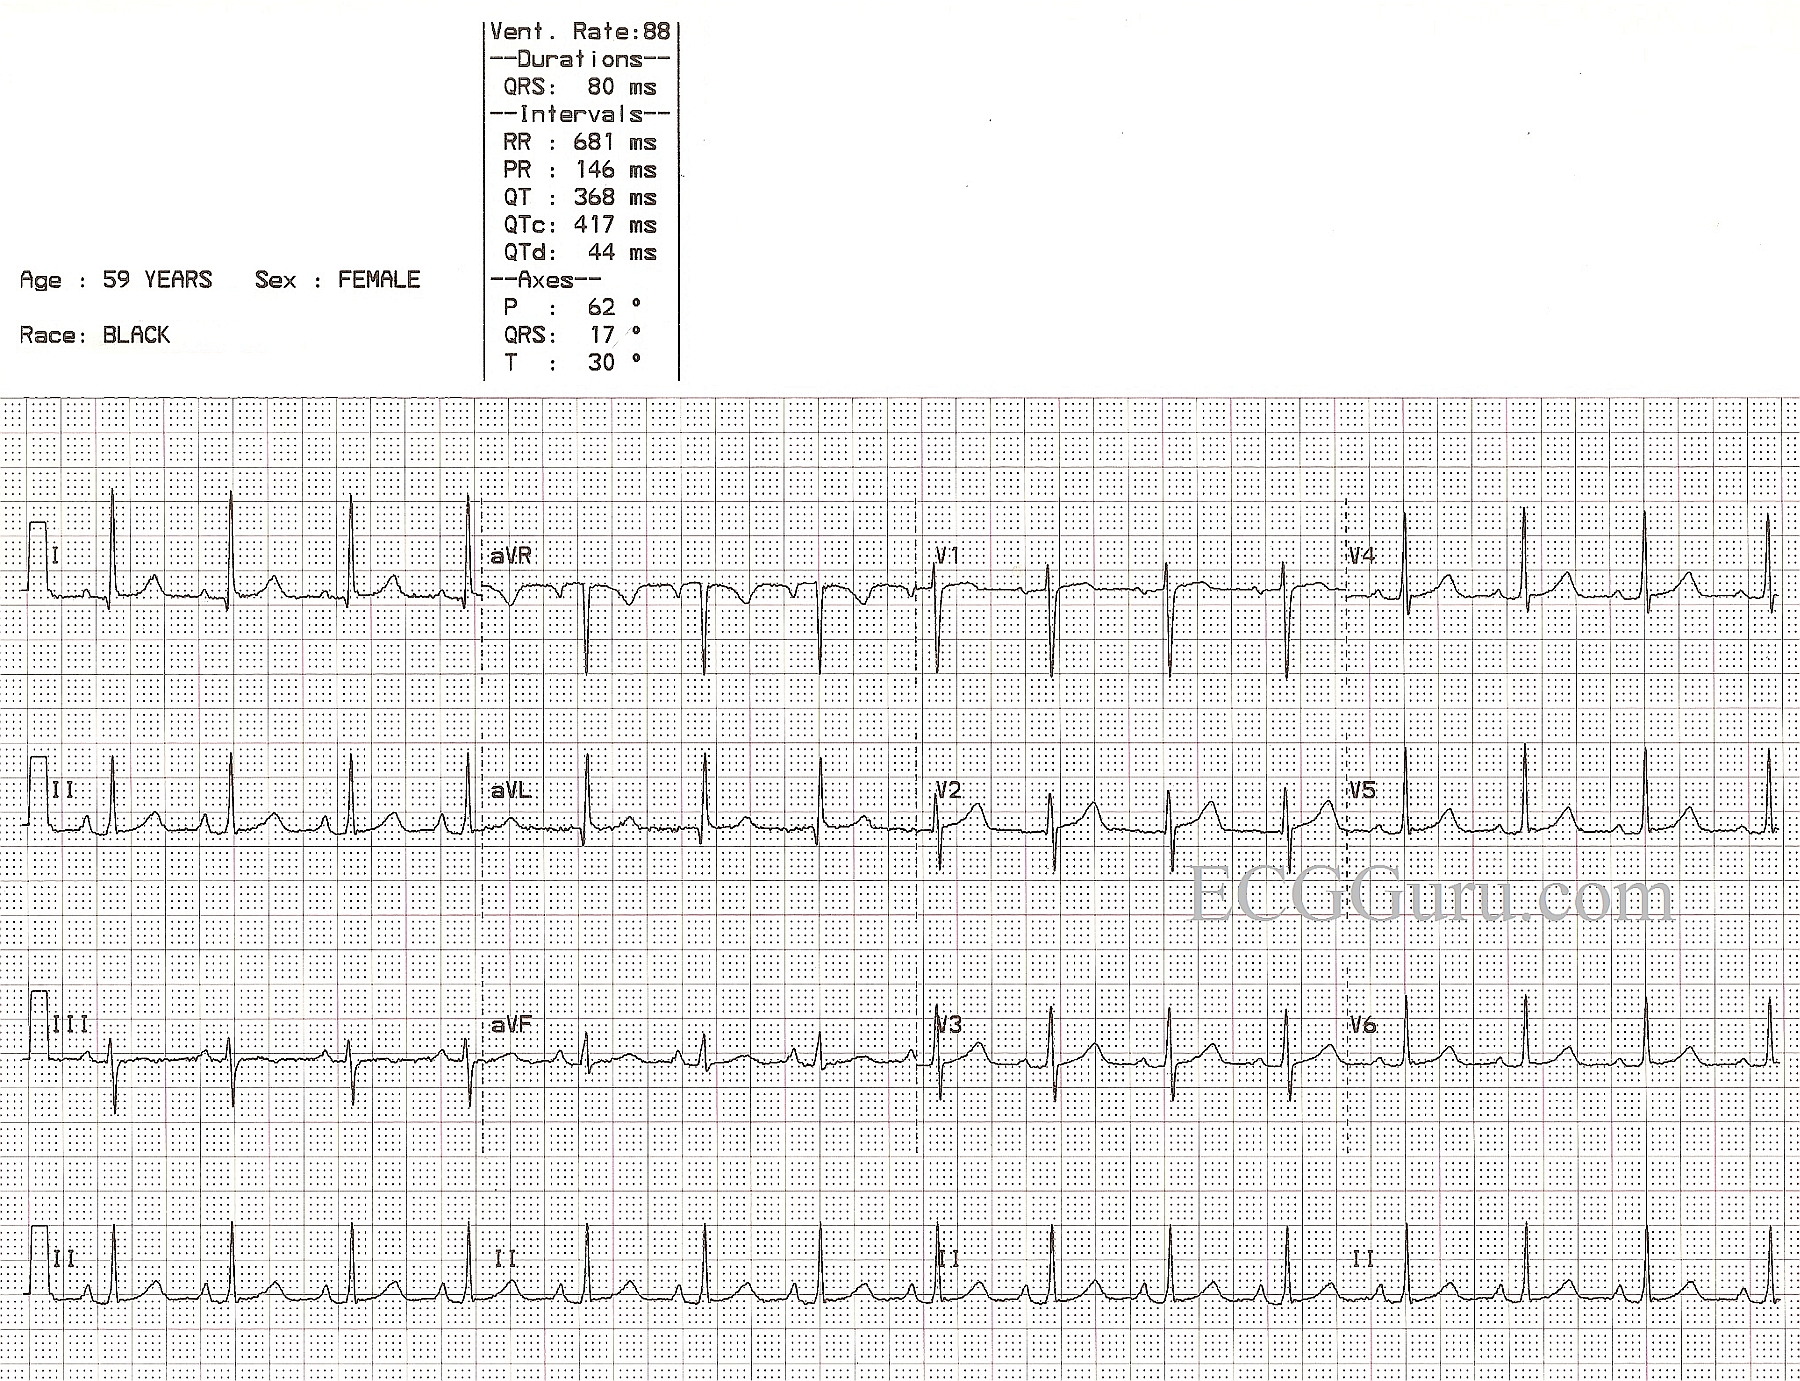
So, first, let's look at what is within NORMAL range. Most of these characteristics will be readily seen by your BASIC LEVEL students. The rate and intervals are within normal ranges. The rhythm is normal sinus rhythm. There is good R wave progression in the precordial leads. That is, V1 is primarily negatively-deflected and V6 is positive, with Leads V2 through V5 gradually becoming more and more positive. The frontal plane axis is within normal range - Leads I and II are positive. This would be a suitable ECG to use when introducing beginning students to the 12-lead ECG.
As for what is NOT NORMAL, there are several subtle characteristics. First, the P waves are slightly tall and have a pointed appearance. The P wave in V1 is biphasic. This can represent P PULMONALE, a sign of right atrial strain. This is often seen with pulmonary disease. One might also expect to see a shift of the frontal plane axis to the right if there is right ventricular hypertrophy as a result of increased strain on the right heart, but here we see a subtle shift to the left. The axis is still within normal limits, but at 17 degrees, it is closer to the left than the right.
The ST segments here are not perfect. One could argue that there is VERY slight elevation in Leads I and aVL, and the shape of the ST in V1 is coved upward. Lead III's ST segment is flat, and the T wave is inverted. Without clinical corelation, it is impossible to determine the importance of these changes. It is a good discussion to have with your more advanced students.
As said, it would be MUCH easier to ascribe meaning to these changes if we knew something of the patient's chief complaint, symptoms, and history.
Related Terms:
Rate this content:
All our content is FREE & COPYRIGHT FREE for non-commercial use
Please be courteous and leave any watermark or author attribution on content you reproduce.
Comments
"Normal" is always a good place to start!
Dawn...
Thanks for posting ECGs that are helpful to those who are just starting to learn about ECGs. Even in my advanced classes I begin with "normal" ECGs. Throughout my residency in internal medicine, I was never up at 3 am wondering if an ECG was ABnormal... I was always trying to decide if a finding was really NORMAL instead.
Here are a few of my thoughts...
A biphasic P wave in V1 is basically the norm. Even when there is only a monophasic deflection, it's usually because the other half of the biphasic deflection is isoelectric.
In my advanced courses we always begin with a normal tracing and I have all the participants measure the R-R intervals with ECG calipers to demonstrate that there is often considerable variation in the rhythm and that there is very rarely a perfectly regular sinus rhythm (and when there is - it's only for a few moments!). This comes in handy occasionally in deciding whether a tachycardia is sinus or not.
I often find that beginners have the impression that the R waves in the precordial leads increase in size from V1 through V6 - and that should never be the case in a "normal" ECG. Typically the tallest R wave peaks at V4 or V5. Because the V6 electrode is the furthest of all the regular precordial leads from the surface of the heart, it actually diminishes in amplitude. When the R wave in V6 is the tallest across the precordium, it means that the heart has enlarged enough to extend its surface a lot closer to the V6 electrode. That alone is a very good indication of cardiac enlargement.
One other thing I would really emphasize to a newbie is that the ST segment should rise gently into the upslope of the T wave and that there should never be a perceptible angle indicating where the ST ends and the T wave begins - it should be smooth and without a discernible margin. And the T wave should always be asymmetrical - NOT symmetrical. However, when the downslope of the T wave returns to the baseline it CAN create a noticeable angle.
I hope some of these comments help those of your readers who are just beginning to read ECGs.
Thanks again...
Jerry W. Jones MD FACEP FAAEM
https://www.medicusofhouston.com
Twitter: @jwjmd
Thank You Dr. Jones!
Thank you Dr. Jones for your insightful comments. As you emphasize — an essential step in learning to recognize the "abnormal" — is complete appreciation of what constitutes "normal". Our comments "crossed" (as I had written mine thoughts prior to seeing your comment) — but hopefully the consistency of our remarks serves to emphasize "normality" that much more. THANKS again for taking the time to contribute to the ECG Guru!
Ken Grauer, MD www.kg-ekgpress.com [email protected]
A “Nearly Normal” ECG
Ken Grauer, MD www.kg-ekgpress.com [email protected]
Thank you both
I have spent my teaching career emphasizing the importance of "fluency", which comes only from being very familiar with what "normal" looks like. I am still learning, myself, and really appreciate the well-written comments that both Dr. Jones and Dr. Grauer have contributed above. If you are an instructor, those comments above will be a great help to you. So many instructors immediately dive right into the "abnormal" findings on ECG because they feel it is more interesting. Meanwhile, the students are struggling to visualize the abnormal in the context of what it should have looked like.
Beginners and experienced ECG interpreters alike - spend some time becoming familiar with all the variations of "normal". You won't regret the time spent.
Thanks again, Drs. Grauer and Jones!
Dawn Altman, Admin