
Submitted by Dawn on Tue, 11/10/2015 - 20:45
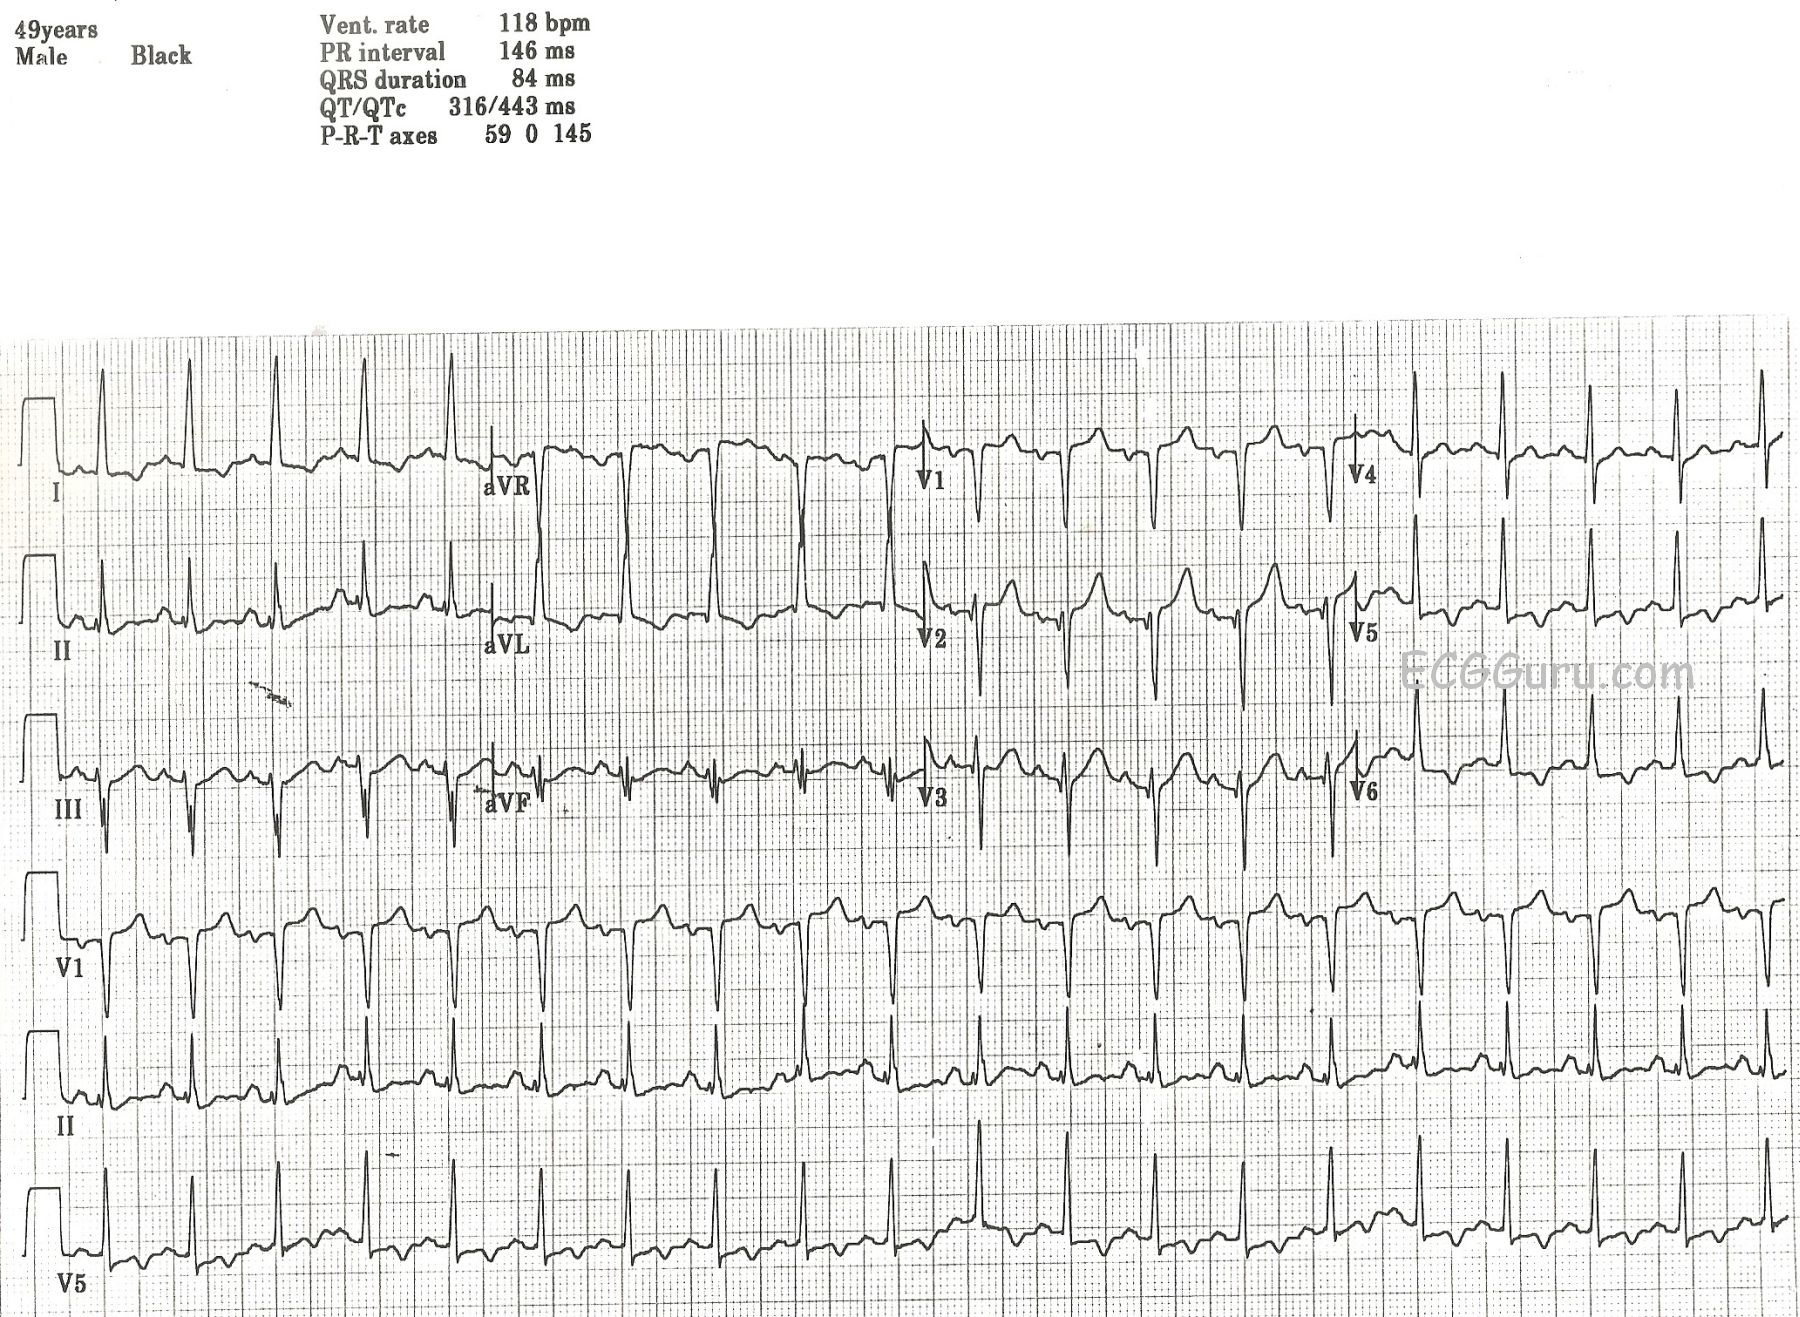
This ECG was obtained from a 49-year-old man who was a patient in an Emergency Dept. We do not know his presenting complaint, only that he had a history of insulin-dependent diabetes mellitus (IDDM). It was noted by the donor of the ECG that the patient had no chest pain, no shortness of breath, and no other cardiac symptoms. We do not know his hydration or electrolyte status. There are quite a few interesting abnormalities on this ECG, and the exact interpretation would, of course, depend upon the patient's clinical status. It would definitely help to be there!
First, we note a sinus tachycardia at a rate of 118 bpm. This could be due to very many causes, including but not limited to: dehydration, pain, anxiety, high or low blood glucose, fever, or CHF. The PR and QT intervals are within normal limits. The QRS complexes are narrow. The axis is normal at 0 degrees. The QRS voltage in the lateral leads is on the high side of normal, but we do not know this patient's body type. Voltage as read by the ECG can be influenced by a thin chest (making voltage look larger) or a large chest (making voltage lower).
There are T wave abnormalities in the lateral leads: I, aVL, V5 and V6. The T waves are inverted, which can have many meanings. However, when inverted T waves are in the lateral leads, as opposed to the inferior or right chest leads, it is often a sign of ischemia. The flat, horizontal ST segments can also signify coronary artery disease (CAD). This patient denied cardiac symptoms, but his age and history of IDDM make it probably that CAD is a factor. The leads with T wave inversion also have a small amount of ST segment depression. The right precordial leads, V1 and V2, have a small amount of ST elevation, This possibly represents a reciprocal change to the ST depression in V5 and V6.
Because we are not at the bedside of this patient, there are many details we do not know. But these inverted T waves could be ischemic T waves, and this requires that the patient be further evaluated.
As always, we welcome comments, as this ECG probably has more to say!
REFERENCES: Dr. Ken Grauer, Life In The Fast Lane, World Journal of Cardiology
Related Terms:
Rate this content:
All our content is FREE & COPYRIGHT FREE for non-commercial use
Please be courteous and leave any watermark or author attribution on content you reproduce.
Comments
Very, Very Abnormal ECG
Dawn...
One of the things that make ECGs so interesting is because they are so much like a two-tiered puzzle: first, we have to understand what we're seeing on the paper and second, we have to understand what the ECG is telling us - the past problems (old infarcts), the present (new ischemia, blocks etc.) and the future (what should be expected based on what we see).
This man certainly has problems, many related to his diabetes but perhaps some based on other familial history as well. I viewed the downloaded ECG on your site and was able to examine it much more thoroughly.
First, there is biatrial enlargement. This is evident by the increased terminal P force in V1 (the negative portion of the P wave in that lead is at least one small box wide and one small box deep). This is also supported by the P wave in Lead II which is wide and notched. P waves in Lead II are not abnormal if they are just notched (that is actually not unusual at all) - they must be wide and notched to be abnormal. But the P waves in Lead II are also at least 2.5 mm tall which indicates a right atrial abnormality - most likely enlargement. Let's put this 2.5 mm height requirement for the P waves in Lead II as an indicator of abnormality in perspective. In theory, a P wave is "normal" in Lead II until it reaches a height of 2.5 mm. But bear in mind that only about 5% of the "normal" population have P waves that are greater than 2.0 mm in height! Sinus rhythm is strongly suggested by the fact that the P waves are upright in both Leads I and II and the P wave axis is right at +60 degrees.
There is left ventricular hypertrophy (LVH) based on an R wave > 11 mm in height in aVL. There is no voltage in the precordial leads suggestive of LVH - but that certainly doesn't mean that it's not there! Note that whenever you have voltage criteria for LVH in Lead aVL, Lead III is going to have a deep S wave. It has to because its positive pole is almost directly opposed to the positive pole of aVL.
Let's look at the ST-T changes in Leads I and aVL versus the ST-T changes in V5 and V6. The changes in I and aVL are indicative of a repolarization abnormality that often (but not always) accompanies LVH (and is always a bad sign in LVH!); specifically, the ST segment starts its downward course at the J point. This is one of the things so characteristic about repolarization abnormalities - the ST slopes down beginning at the J point. Now, it is not too unusual for the J point itself to be slightly depressed, but the major point is that the downward slope of the ST segment begins at the J point whether it is level with the baseline or slightly below it.
Now let's look at the changes in V5 and V6. There is no downward sloping of the ST segments. Both these leads have an expanse of baseline between the J point and the inverted T waves. Remember: a repolarization abnormality has a gradual downward slope of the ST segment into an inverted T wave followed by a rather abrupt return to the baseline. That certainly isn't the case in V5 and V6 - those changes represent ischemic heart disease.
The vast, vast majority of Q waves are normal and quite benign. That's because the vast majority of Q waves are septal Q waves. And where do we see septal Q waves? In Leads I, aVL, V5 and V6 - and, in Leads II, III and aVF (it's usually one group or the other, but on rare occasions in almost all of them). We distinguish septal Q waves from pathological Q waves by their width - septal Q's are always less than 0.04 seconds (usually around 0.02 seconds) in width while pathological Q waves are at least 0.04 seconds in width. It would seem from that bit of knowledge that we could assume that any Q wave that is less than 0.04 seconds in width is benign - but we can't. There are a few leads in which a Q wave that is less than 0.04 seconds in width (or duration) is still quite abnormal - the precordial leads to the right of the transition lead. And that is what we have here in this ECG. A QS in V1 is very unusual in a normal ECG, but it can occasionally happen. No Q wave is ever normal in V2 or V3 - no matter what its width is. In this ECG, the transition is between V3 and V4, so it fits our criteria. If a small Q wave (or q wave) appears after the transition, then it is most likely reflecting septal depolarization (i.e., it is a septal Q wave). It looks like this man has had a previous anteroseptal MI.
I think that's enough for now. Thanks for posting this ECG, Dawn.
Jerry W. Jones MD FACEP FAAEM
https://www.medicusofhouston.com
Twitter: @jwjmd
LVH with Fragmentation plus Strain and/or Ischemia
Very interesting tracing from a 49-yo man with diabetes who was being seen in the ED (Emergency Department) for a medical concern other than chest pain. I’d make the following comments:
The Rate & Rhythm — is sinus tachycardia at just under 120/minute. Although the PR and QRS intervals are normal — the QT interval is at the least of borderline duration — although assessment of QT duration becomes quite difficult at faster rates (especially when over 110/minute). The axis is about 0 degrees (lead aVF looks equiphasic).
Chamber Enlagement — P waves are prominent in many leads. They appear notched in leads III and aVF — and there is an approximately 1mm deep and wide negative component to the P wave in lead V1. Whether this reflects LAA (Left Atrial Abnormality) vs an intra-atrial conduction defect is difficult to say. I suspect both, given the presence of both LVH (next paragraph) and persistence of surprising large amplitude P waves on virtually every lead in this tracing.
Criteria for LVH are met — as QRS amplitude in lead aVL is ≥12mm. Although difficult to see — there appears to be overlap between the S wave in aVR with the R wave in aVL. The finding of a relatively tall R in lead I + deep S in lead III of ≥25mm supports that what we are seeing IS overlap, and that the R wave in aVL is 14-15mm, which is quite tall. ST-T wave morphology in high lateral leads I,aVL is typical for LV “strain”.
QRST Changes — The QRS complex is fragmented! (especially noted in each of the inferior leads). In support of this finding are unanticipated small-but-definite q waves in leads V2,V3 — suggesting scarring and probable prior infarction. Transition occurs normally (between V3-to-V4). ST-T wave appearance is remarkable. As previously noted — ST-T waves in leads I,aVL is typical for LV “strain”. The T wave is peaked in V2, and rounder (fatter) than expected in V3. Given QRS appearance in lead V2 — amplitude to the peaked T in V2 is taller than expected. Finally, there is T wave inversion in V5,V6 with 1-2mm of flat J-point ST depression in those leads. This suggests more than just “strain”.
CLINICAL IMPRESSION: Putting the above together — I’d interpret this tracing as showing sinus tachycardia — LAA (vs intra-atrial conduction defect) — LVH and “strain" and/or ischemia — with need for clinical correlation. Prior infarction is suspected by the QRS fragmentation (in inferior leads) + unanticipated q waves in V2,V3 (vs possibility of scarring from cardiomyopathy). I don’t get the "sense" of an acute evolving process — but at-the-least, abnormal ST-T waves in the chest leads suggests associated ischemia. Finding a prior tracing on this patient would help. My concern about acute ischemia would clearly be increased if there were symptoms. Without a history of chest pain — I’d probably follow this patient closely and repeat the ECG as his medical condition improves (or if at anytime he developed chest discomfort). Slowing of the rate will likely result in improvement of many of the above interesting ST-T wave findings.
===============================================
Additional Material — I’ve added the following links where I review ECG assessment of Atrial Abnormality and LVH.
Ken Grauer, MD www.kg-ekgpress.com [email protected]
Thanks, Drs. Jones and Grauer
I knew this ECG would be a good teaching opportunity, and enjoyed reading your comments. It is very enlightening to walk through the organized approach you both have. I'm sure our readers gained a great deal of insight from your comments.
Dawn Altman, Admin