
Submitted by Dawn on Sat, 08/13/2016 - 23:33
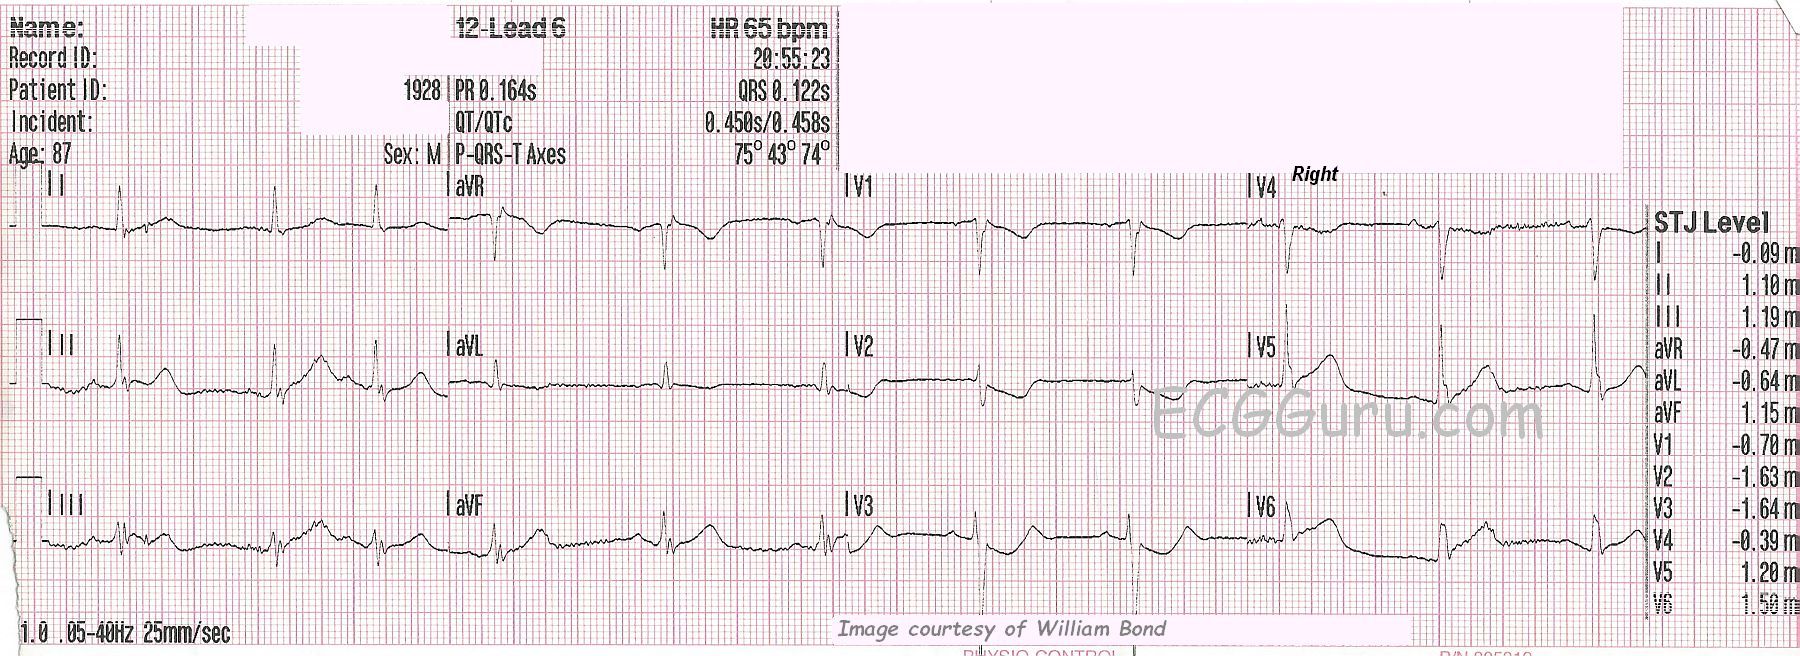
SUBTLE ST CHANGES This ECG was obtained from an 87-year-old man who was experiencing chest pain. Due to the subtle ST elevation in Leads II, III, aVF, V5, and V6, (inferior- lateral walls) the ECG was transmitted to the hospital by the EMS crew, and the cath lab was activated. The patient denied previous cardiac history.
In addition to the subtle ST elevation, there is ST depression in V1 through V4, which represents a reciprocal view of the injury in the inferior-posterior-lateral wall. Because the anterior wall is superior in its position in the chest, it is opposite the inferior/posterior wall, and can show ST depression when the inferior-posterior area has ST elevation. This ECG was the 6th one done during this EMS call. Prior to this one, the ST segments were elevated less than 1 mm. This is a good example of the value of repeat ECGs during an acute event.
RIGHT VENTRICULAR M.I.? This ECG was done with V4 placed on the right side, to check for right ventricular M.I., which is a protocol for this EMS agency. When the right coronary artery is the culprit artery (about 80% of IWMIs), RVMI is likely. In RVMI, we would usually see reciprocal ST depression in Leads I and aVL, but the STE is very subtle here, so the depression would likely be also. When the culprit artery is the left circumflex artery (<20%), lateral lead ST elevation is more likely, as we see here in V5 and V6.
WHAT ABOUT RHYTHM? The rhythm is sinus with PACs. PACs are considered to be benign in most situations, but in a patient with acute M.I., any dysrhythmia can be concerning. The QT interval, measured as QTc (corrected to a heart rate of 60 bpm), is slightly prolonged at .458 seconds (458 ms). Over .440 seconds is considered prolonged in men, and over .500 sec. places the patient at increased risk of developing torsades de pointes. CAD and myocardial ischemia can lead to this modest increase in QTc.
WHY DO SOME OF THE QRS COMPLEXES HAVE “NOTCHES”? Of greater importance is the fragmentation of the QRS complexes (fQRS) we see here. Notice the extra notches after the R waves in Leads II and aVF, the notch after the S wave in Lead III, V5 and V6. This “fragmentation” is a sign of a myocardial scar, and is similar to finding a pathological Q wave on the ECG. In a patient with a history of coronary artery disease, fQRS is often associated with ventricular dysfunction and congestive heart failure. It can indicate that conditions are favorable for the formation of re-entrant ventricular tachycardia. Fragmented QRS is more likely to appear in the setting of STEMI and NSTEMI, and less likely in unstable angina.
The patient survived post-angioplasty, and we do not know his eventual outcome. Our thanks to William Bond for providing this ECG.
Related Terms:
Rate this content:
All our content is FREE & COPYRIGHT FREE for non-commercial use
Please be courteous and leave any watermark or author attribution on content you reproduce.
Comments
The 6th ECG in a Series in a Patient with Chest Pain
VERY interesting case and tracing for a number of reasons. Our thanks to William Bond. I’ll play, “Devil’s Advocate” in my dissection of a number of fine points.
FIRST — One cannot overstate the importance of history and the clinical setting. EMS was activated because of a history of new-onset chest pain in this 87-year old man who up until now had apparently not had chest pain. So even BEFORE we look at this ECG — pre-ECG odds that this patient is having an acute event are high.
We are told that this is the 6th ECG done during the EMS call — and that it was because of the changes noted on THIS tracing that the cath lab was activated. The fact that so many tracings were done strongly suggests that significant abnormality was recognized by the EMS team from the start — but that serial ECGs were repeated primarily to "document" the "need" for cath lab activation. This raises the question if so many tracings in the field are truly necessary? Realizing that specific criteria for a certain amount of ST elevation are sometimes written into EMS protocols — one has to wonder IF this is truly the best policy for cases in which the clinical scenario is highly suggestive, and some acute ECG abnormality is clearly evident (even if this abnormality doesn't quite satisfy the amount of "required" ST elevation). At the least, a "middle path" in which the emergency physician immediately evaluates such patients on arrival at the hospital would seem warranted.
That said, the benefit of SERIAL tracings cannot be overemphasized. For example — The increased subtle suggestion of fatter-than-they-should-be T waves in the inferior leads here, along with the minimal ST-T depression we see in lead aVL might be far more diagnostic IF prior tracings showed lower amplitude inferior T waves and an upright T wave in lead aVL. Most of the time, 2 (or at most 3) ECGs in the field should prove to be more than enough to document an acute evolving event, even when "the required amount" of ST elevation is not quite attained ...
The reason I strongly suspect prior tracings would also have been diagnostic is based on the appearance of the ST-T waves in leads V2 and V3. This clearly provides a positive “mirror test” (ie, if you flip these negative ST-T waves upright — they clearly would show hyperacute ST segments). Note in addition the terminal T wave positivity in lead V3. This is clearly abnormal, and contributes to making lead V3 the one lead on this tracing that is the most diagnostic!
There is a LOT of artifact on this tracing! Note how each of the complexes in leads II and III differ from one another. That said, despite this artifact — the consistent abnormality (ie, a T wave in leads II and III that looks a bit taller and fatter-than-it-should-be compared to the QRS in these leads) can still be seen.
The 3rd beat is a PAC. Although there may be variation in both QRS and ST-T wave morphology with some PACs — there is little variation here. As a result, we are able to consider QRS and ST-T wave morphology of this 3rd beat. This is important, since we otherwise would only have 2 beats that are marred by artifact to assess ST-T wave changes in leads II and III with.
There is subtle-but-real hyperacute ST-T wave changes in lead V6. This finding further supports our impression that changes on this ECG are real and acute. That said, the slight ST elevation we see in lead V6 is not helpful in predicting whether the “culprit artery” is the RCA (Right Coronary Artery) or the LCx (Left Circumflex) — because relatively larger Postero-Lateral Branches may arise from the PDA (Posterior Descending Artery) with either a right or left dominant circulation.
Statistically — 80% of patients have a right-dominant system. Given the relatively minimal changes (except for lead V3) that we see here — I wouldn’t favor one or the other system, other than statistical likelihood that the RCA is the culprit.
Assuming the 1-to-2 minutes it may take to obtain right-sided leads is not critical in a given case — it is never wrong to obtain right-sided leads in patients with acute inferior infarction. That said — lack of ST segment flattening or elevation in lead V1 (which is a right-sided lead) — plus minimal ST-T depression in aVL and no depression in lead I suggest that acute significant RV involvement is less likely. That’s because the acute right-sided ST elevation typically caused by acute RV infarction will generally attenuate the anterior ST depression we typically see from acute posterior involvement. This in no way rules out the possibility of acute RCA occlusion — but only suggests that it is more likely that a proximal RCA occlusion is not occurring here.
There is a subtle r’ in lead V1. In addition, the slope of the decline from this subtle r’ looks slow. There is no ST elevation — so this is not a Brugada pattern — but the relatively slower decline (ß-angle) from the r’ peak otherwise resembles the shape that is seen with Brugada patterns. That said, it is not uncommon for Brugada “phenocopy” to be seen with other acute conditions, with this transient ECG abnormality passing once the other condition resolves. I mention this merely to indicate that on subsequent tracings I’d keep an eye on lead V1 to ensure that a frank Brugada pattern did not develop.
Finally, as Dawn mentioned — there appears to be some fragmentation of the QRS complex in the inferior leads beyond what might be due to artifact. While true that this fragmented appearance in an 87-year old man may indicate scarring — recognition of fragmentation does not provide information as to whether any of what we see is acute.
Our THANKS again to William Bond for sending us this case!
--------------------------
NOTE: For more on ECG recognition and the clinical significance of Brugada Syndrome — Please check out my ECG Video at — www.ecgbrugada.com —
Ken Grauer, MD www.kg-ekgpress.com [email protected]
Additional Information
Thanks, Dr. Grauer, as always for the systematic look at this ECG.
For clarification, I did want to mention that William Bond did send the series of ECGs, and I decided the post would be very lengthy if I added them. The earliest ECGs on this patient, taken about 15 min before the one shown here, show subtle "straightening" of the inferior ST segments, not different than the ones on ECG 6. Also, there is the significant ST depression in the right-sided chest leads. The mentioned T waves were broad, and there was QRS fragmentation. The main difference between ECG 1 and ECG 6 was that the machine recorded STE in the inferior leads greater than 1 mm in ECG 6. The paramedic recognized the signs of inferior STEMI, and routed to an interventional catch lab hospital. He recognized that it would be helpful to have an ECG which met "STEMI Alert" criteria, which he got with ECG 6. However, he transmitted the 12-Lead ECG 4 to the hospital, and they recognized the situation, even without the full mm of STE.
As for repeat ECGs, he was seeking some insight into whether the ST segments and T waves were changing during the call. The LifePak 15 ECG machine they were using has a feature that causes it to automatically repeat the ECG when there is any significant change, including an increase in ST elevation or depression. So, some calls result in quite a collection of strips during transport. The fire/EMS department who handled this call has an advanced STEMI protocol, which allows for "STEMI Alert" whenever there is 1 mm of STE in leads other than V2 and V3, which require 2 mm. They also can make the STEMI Alert determination if the STEs have a "frowning" shape. They transmit nearly all of their abnormal ECGs to the receiving hospital for another opinion.
Thanks again to William Bond for this very instructive ECG, and to Dr. Grauer for his detailed evaluation of the ECG.
Dawn Altman, Admin
A Challenging ECG for Anyone To Interpret
Dawn...
Thanks for posting this ECG. We so often use very clear and typical ECGs for teaching purposes when, in actuality, this is often the quality ECG that we must deal with. There is baseline artifact in Leads II and III that makes it difficult to interpret: each ST-T sgment is different in those leads leading to the question "Which - if any - of the complexes really represents that lead?"
Of course the first thing that catches my eye is the ST depression in Leads V1 through V3. The T waves are inverted in V1 and V2 but they are upright after that (I'm assuming that the real V4 continues the trend). This is a posterolateral infarction in which reperfusion changes are starting to take place. V3 certainly has 1 mm of ST depression at the J-point but V2 does not. I don't know how much ST depression was present in the real V4 since it has been replaced with V4R. There is definite STE in V6 and probably in V5 as well, although there is significant artifact there. STE in Leads V5 and V6 unfortunately - in this case - do not help us distinguish between RCA or LCx. Also, comparing STE in Leads II and III also doesn't help a lot due to artifact. In my mind, there is no question of an acute posterolateral (or simply "lateral") ischemic episode occurring. The subtle ST depression in aVL certainly points to an inferior MI and the lack of ST depression in Lead I makes RV involvement very, very unlikely. As far as the r' in V1, that could simply be due to an electrode that is placed a bit too high on the chest wall or perhaps a ptotic heart due to emphysema. However, I notice a small s wave in Lead I that pretty much corresponds to the r' in V1, so we are probably just seeing a bit of terminal delay due to terminal depolarization forces going up the RV outflow tract - what we used to call a "cristal" pattern.
I'm not totally current with paramedic protocols and procedures since I retired, but would it have been too impractical to get posterior leads on this patient? STE of at least 0.5 mm in V7, V8 or V9 might have been helpful if present. If not present, I would certainly not change my opinion about the posterolateral infarction. STE in the posterior leads will validate a posterolateral MI when present, but the lack of STE in those leads does not R/O a posterolateral MI.
I agree with Dr. Grauer that statistically RCA occlusion is the likely culprit here.
Jerry W. Jones MD FACEP FAAEM
https://www.medicusofhouston.com
Twitter: @jwjmd
Thanks Dr Jones
you are right, we don't always have "perfect" quality ECGs to interpret, especially in the field. The ECG machine produces automatic repeats, and patient care and transport is ongoing. In the area where this crew works, the hospital is very close, and it is often very impractical to get additional leads. Posterior leads are especially problematic because the crew has very little time to determine hemodynamics stability, and can't always reposition the patient for them. By the time they do any initial assessment, load the patient into a stretcher, apply O2, start an IV, they are often pulling into the ambulance bay. In addition, most of the care they render is in a moving vehicle.
Except for V4 Rt, they generally must leave the ECG details to the controlled environment of the hospital, or risk adding valuable minutes to the 911 - to - balloon time.
As always, thanks so much for your instructive comments!
Dawn Altman, Admin
One more thought to consider when obtaining right-sided leads...
Dawn...
There's one more thing that I would like to point out about obtaining right-sided leads: V3R and V4R especially. This is for those who are a bit more advanced in their ECG interpretation skills.
Due to the location of the heart in the chest, there is very little chance that any of the left-sided leads (V3 - V9) are going to "miss their mark," so to speak. All of them are aimed directly at the left ventricle which is what we want them to view.
Although the heart is in the center of the chest, it is more of a left- than right-sided structure. And it normally isn't very large - about the size of your hands clasped tightly together. Therefore, it is occasionally possible for the right-sided chest leads to be aimed eccentrically and not really manifest everything correctly that is happening in the right ventricle, whether due to a slight lead malposition, the patient's positioning or the location of the heart in the chest due to other factors (primarily emphysema).
There is a way, however, to be fairly certain that the lead is actually running through the right ventricle and thus placed exactly where you want it. We check for this NOT by inspecting the QRS as one would reasonably think, but instead by looking at the P waves in each right-sided lead.
If the P wave in V3R or V4R is BIPHASIC, and especially if the downslope from positive to negative is sharp and steep, the electrode is over the RIGHT ATRIUM - NOT the right ventricle.
If the P wave in V3R or V4R is NEGATIVE, the electrode is lateral to the right atrium, missing both the atrium and the ventricle entirely.
If the P wave in V3R or V4R is POSITIVE, then the electrode is indeed correctly placed so that it is viewing the right ventricle.
As you can see, the P waves in Lead V4R in this ECG are all POSITIVE, so the lead is correctly placed.
Now, please don't misunderstand what I am saying: if you can see a QRS you are looking at ventricular depolarization -and every lead is going to manifest a QRS no matter where it is placed. But an improper lead placement can cause the QRS to be deceptively recorded and could possibly result in a misinterpretation.
Jerry W. Jones MD FACEP FAAEM
https://www.medicusofhouston.com
Twitter: @jwjmd