
Submitted by Dawn on Mon, 12/06/2021 - 17:59

At the ECG Guru website, our main goal is to provide quality teaching materials to those who teach ECG interpretation and other cardiac topics. This ECG offers teaching opportunities for those who teach any level of student.
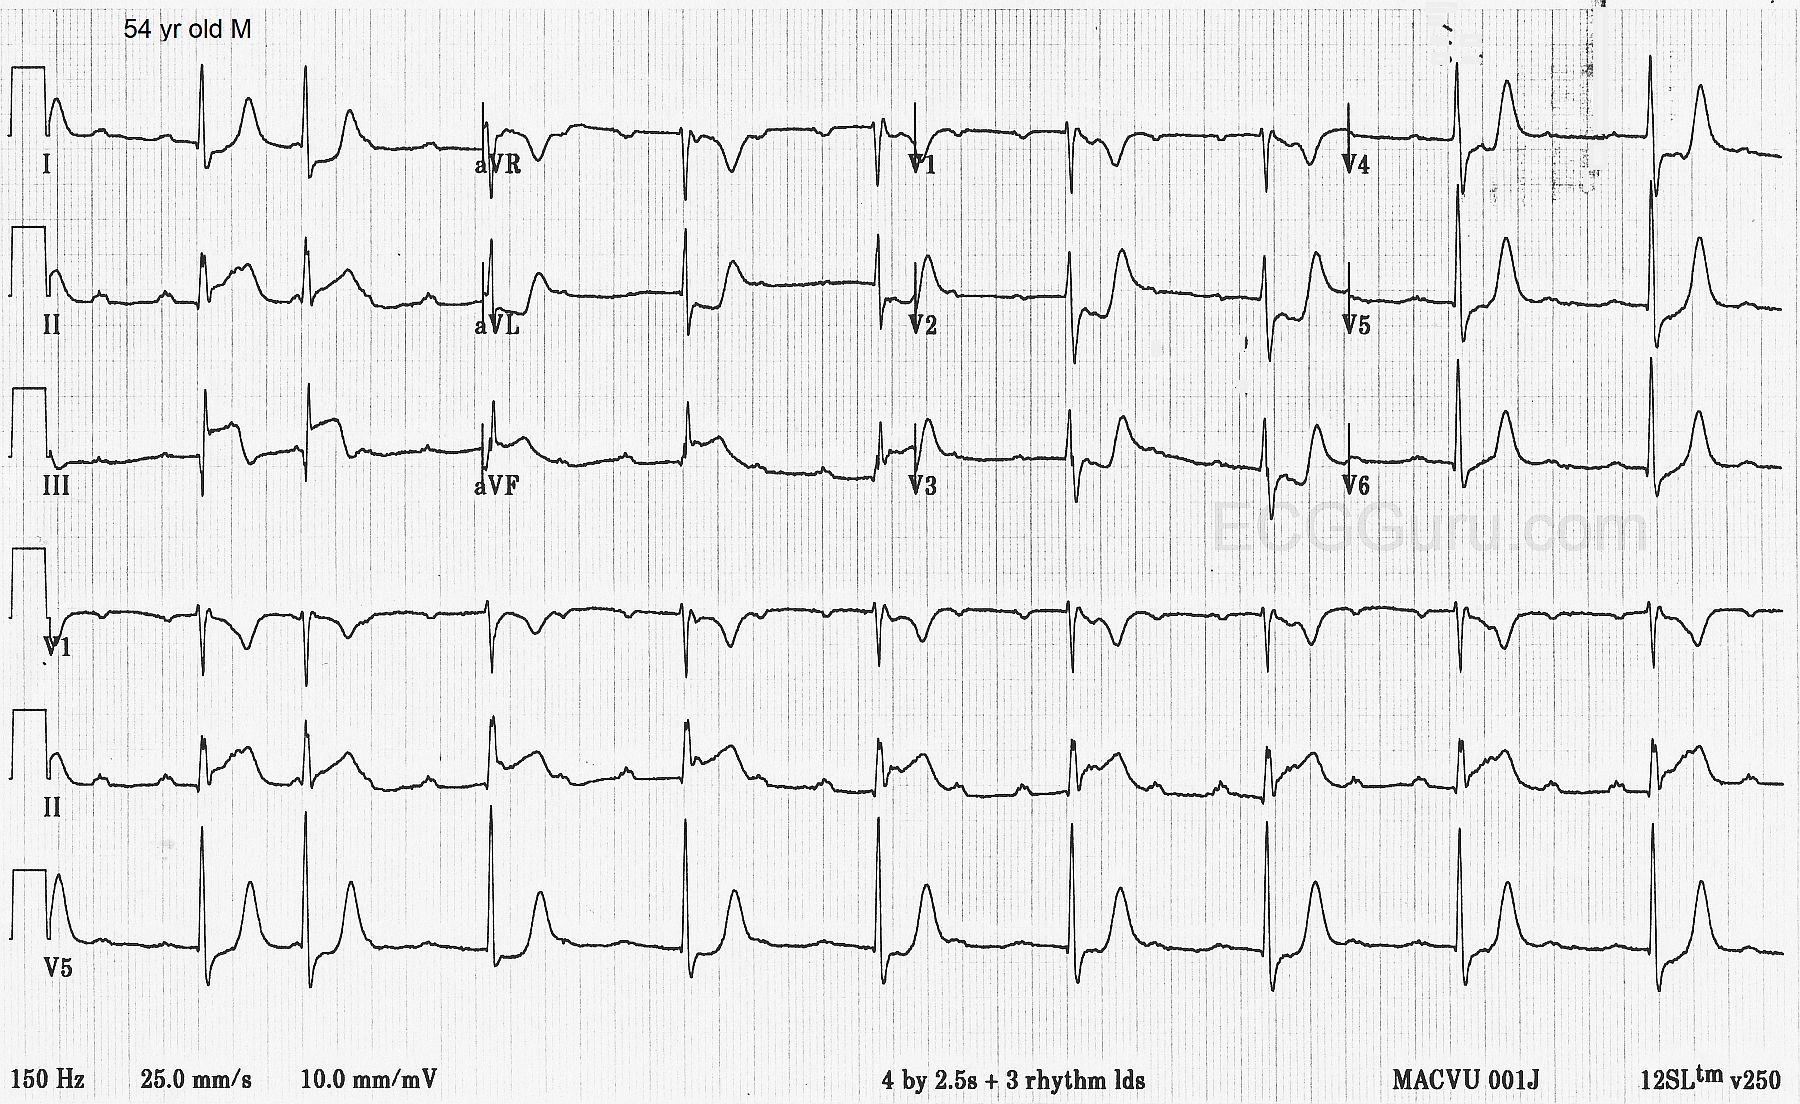
The patient: This ECG was obtained in the Emergency Department from a 54-year-old man who was complaining of severe chest pain and nausea. His BP was 130/68.
The ECG: The rhythm is interesting and not uncommon in the setting of inferior wall M.I. The atrial rate is about 158 bpm and the P waves are regular. (Marked in red on accompanying rhythm strip). Some P waves are hidden in T waves or ST segments, but we can see fragments of them. The QRS complexes are narrow and mostly regular at a rate of about 56 bpm. The second QRS on the strip is early, but from the third QRS on, they are regular. The PR intervals are not consistent. Careful measurements will show that they get shorter and shorter as the recording progresses. There are more P waves than QRS complexes and there is NO association between the P waves and the QRS complexes, so there is AV DISSOCIATION. One might argue that the first two QRS complexes are conducted from the P waves, with a shorter PR interval with beat #1 and a longer one with beat #2. This would be a short episode of Wenckebach conduction if that is what is happening. Since we don’t have a strip preceding this one, we can’t be sure. Clinically, it is smart to address where the patient is now, and that is SINUS TACHYCARDIA WITH AV DISSOCIATION AND A JUNCTIONAL RHYTHM. Or, it would be fine, after the first two beats, to say the patient is now in COMPLETE AV BLOCK WITH JUNCTIONAL ESCAPE or THIRD-DEGREE AV BLOCK WITH JUNCTIONAL ESCAPE. We know that this conduction failure is occurring at the level of the AV node because the escape rhythm is junctional. Blocks at the AV node level are often temporary. A block lower than this, from the His Bundle through the common branch of the bundle branches, would produce a ventricular escape rhythm. The important thing, if you are the patient’s health care provider, is that you assess this rate for adequate perfusion. A heart rate of 57 is almost always sufficient for good perfusion, and is actually preferable for a patient with an ongoing M.I. Which would you rather have if you were having an M.I., a heart rate of 57 or 158 bpm? Could we say that this AV block has actually HELPED this particular patient? I will happily leave more advanced discussions of this arrhythmia to our commenters.
The ST segments are noticeably elevated in Leads II, III, and aVF. There is reciprocal ST depression in Leads I and aVL, and also in the anterior leads. Lead III has a deep, but not wide Q wave. This pushes the frontal axis a bit to the left (I and aVL are taller than II). The T waves in many leads are “hyperacute”. That is, they are taller than expected, which is a sign of ischemia. This patient was confirmed to have a INFERIOR WALL M.I. Since the RCA supplies the inferior wall and the AV node in the majority of people, it is not surprising that there is an AV block at the level of the AV node. Also, the posterior wall is supplied by the RCA in most people, and the ST depression in the anterior wall with prominent R waves in the septal leads point to posterior M.I. The much less prominent ST depression in V1, as compared to V2, indicates that the right ventricle is sending a signal to V1 to "elevate", while the posterior wall tells V1 to "depress". This results in an ST segment that is cancelled by opposing forces. This would be a good patient to perform V4Right, V7, V8, and V9 on (16-lead ECG).
This is a good ECG to demonstrate what ST segment elevation looks like in acute M.I., as opposed to other causes of STE. In M.I., we see certain characteristics:
· The STE is found localized in related leads
· The ST segments tend to be straight or curved upward, rather than the normal convex shape
· There is ST depression is leads that are opposite the elevation (See III and aVL)
· There are accompanying signs of M.I., such as T wave inversion, hyperacute T waves, and pathological Q waves.
This ECG can also serve to start a conversation with students about when it is appropriate to treat bradycardia, and when it is best left alone.
EDIT: Dr. Ken Grauer has written a very informative and thought-provoking comment below. If you would like to hear his thoughts on this ECG in more depth, go to his blog at https://ecg-interpretation.blogspot.com/2021/12/ecg-blog-268-76-mobitz-i-vs-complete-av.html?m=1
Related Terms:
Rate this content:
All our content is FREE & COPYRIGHT FREE for non-commercial use
Please be courteous and leave any watermark or author attribution on content you reproduce.
Comments
Mobitz I vs Complete AV Block vs "Supernormal" Conduction?
Today's case offers a fascinating ECG in all regards — obtained from a 54-year old man with chest pain. As per Dawn — there is obvious acute inferior MI and AV block — but from a teaching perspective — there is so much more!
Beginning with the 12-lead ECG — I'd make the following points:
— Clearly there is acute inferior MI, with obvious ST elevation in each of the inferior leads. But what is the AGE of this inferior infarction? (See Blog #258). There are small-but-present q waves in leads II and aVF — with already a large Q wave in lead III. Not only is there ST elevation in lead III — but there is beginning T wave inversion, signaling the likely onset of reperfusion T waves.
— The ST-T wave in lead aVL is almost the mirror-image reciprocal picture of the ST-T wave in lead III — and this confirms that the MI is at least "recent" (See Blog #184) — but the unexpectedly tall T wave in lead aVL (which in its "mirror-image" corresponds to T wave inversion) confirms the presence of reperfusion T waves. Spontaneous reperfusion (without thrombolytics or angioplasty) is common during the course of acute MI — and this is undoubtedly ongoing in today's case.
— There is also associated acute posterior infarction — as signaled by the positive "Mirror Test" picture for the ST-T waves in anterior leads (See Blog #246), which is maximal in leads V2,V3. Further support of associated posterior MI is forthcoming from the taller-than-expected R waves in leads V2 and V3 (which in its "mirror-image" corresponds to increasingly deep Q waves).
— There is almost certainly also acute RV (Right Ventricular) infarction — as signaled minimal ST depression in lead V1 in the face of maximal downsloping ST depression in leads V2,V3 (See Blog #190). Lead V1 is in effect, a "right-sided" lead — and in the setting of acute proximal RCA (Right Coronary Artery) occlusion — there will often be infero-postero and RV infarction, as a result of anatomic areas supplied by the RCA. On ECG — the effect of simultaneous ST elevation in lead V1 (from acute RV MI) — together with the ST depression in lead V1 from acute posterior MI — will often yield a "net effect" of a nearly flat ST segment in lead V1. In neighboring leads V2, V3 (which are not "right-sided") — we don't see any effect from the ongoing acute RV MI, and as a result there will be disproportionately greater ST depression in other anterior leads. In contrast, with acute infero-postero MI but in the absence of acute RV MI — signficant ST depression will usually also be seen in lead V1, as well as other anterior leads.
— Note that there is much less ST depression in lateral chest leads (ie, leads V4, V5, V6) — but that marked T wave peaking persists. Although I would check serum K+ — I suspect this is not due to hyperkalemia — but rather extension of marked "mirror-image opposite" reperfusion T waves. Note that the History we were given did not specify the time symptoms began. Given the large Q in lead III, the taller-than-expected R waves in leads V2,V3 — and especially given diffuse and marked suggestion of reperfusion T waves — I'd suspect that although this extensive MI is "recent" — it is less likely to have just begun in the past couple hours (More history will probably help answer this question!).
— NOTE: Although chest lead T waves are tall and peaked — this is most probably not a manifestion of deWinter T waves from acute LAD (Left Anterior Descending) coronary artery occlusion because: i) There are very prominent changes of acute inferior MI in the limb leads; ii) I'd expect a different ST-T wave appearance in lead V1; and, iii) The duration of the depressed ST segments in the chest leads is relatively long (whereas with deWinter T waves, the slightly depressed J-point ST depression much more rapidly rises to form giant T waves than what we see in today's tracing — See Blog #266).
Regarding the Rhythm in Today's Case — I'd make the following points:
— I do not think definitive interpretation of the rhythm is possible from the single long-lead rhythm strip that we have been given. Additional monitoring would clearly be needed. That said — I believe we can define the principal rhythm abnormality, and speculate on the fascinating possibilities of a few unique findings.
— I have drawn a laddergram in the attached Figure to this post that presents 2 possible explanations for the ECG findings we see (For more on Laddergrams — See Blog #188). Panel A illustrates findings described by Dawn — in which there is a 2 beat grouping at the beginning of the tracing that suggests Mobitz I, 2nd-degree AV block with 3:2 AV conduction for beats #1 and 2 (PURPLE lines within the AV nodal tier in my Figure).
— Continuing with Panel A — There appears to be complete (3rd-degree) AV block, beginning with beat #3. ARROWS in the lead II rhythm strip show the occurrence of a regular atrial rhythm at the extremely fast rate of 155/minute. Whether this represents marked sinus tachycardia vs an ectopic atrial tachycardia is unknown from this single single tracing.
— As per Dawn, after beat #3 in Panel A — None of the P waves conduct. The way we know this — is that although the narrow-QRS ventricular rhythm is perfectly regular after beat #3 (at a rate of ~55/minute) — the PR interval continually changes (If you focus on each PINK arrow P wave before the QRS of beats #4, 5, 6, 7, 8 and 9 — you'll note a small-but-definitely-present continual change in the PR interval). This means that there is complete AV dissociation — because after beat #3, none of the P waves conduct! I suspect this represents complete AV block — although additional monitoring would be needed to confirm this. As an advanced Point — it is difficult to guarantee that all P waves fail to conduct despite adequate opportunity to conduct, because the ventricular rate is faster than 50/minute and because the atrial rate is so fast (See Blog #202).
— This raises the question of HOW can you have Mobitz I just 1 beat before you develop complete AV block? While hard to say that this is "impossible" — this rapid transition from 2nd-degree to 3rd-degree AV block in the space of a single beat seems highly improbable! As a result — I do not think Panel A represents a plausible mechanism for today's rhythm.
What about Panel B?
— The reason I do not think beats #1 and #2 represent a 3:2 Mobitz I grouping — is that the PINK arrow P wave just before beat #9 appears to have the same PR interval as for the P wave before beat #1 — yet we know that the P wave before beat #9 is not conducting.
— The "good news" about this 2nd laddergram that I propose in Panel B — is that instead of having to explain the path of several P waves (as per the several PURPLE lines in Panel A) — I only have to explain the path of 1 P wave ( = the RED arrow in the ST segment of beat #1). I suspect that the reason this 1 P wave in Panel B is able to conduct to the ventricles — is a result of "supernormal" conduction! This theoretical phenomenon is defined as, "better-than-expected conduction in the setting of depressed conduction during a short interval in the ventricular cycle" (See Friedman & Schweitzer).
— I fully acknowledge that the concept of "supernormal" conduction in humans remains controversial. Despite me being aware of this described phenomena for several decades — I count on the fingers of one hand the number of times that I thought I truly detected it. But for today's case, in which there is extensive recent inferior MI with what appears to be complete AV block with a junctional escape rhythm — I find theorizing "supernormal" conduction the BEST way to explain the early occurrence of beat #2. The P wave in the ST segment of beat #1 is appropriately located at a point where it would seem most likely to encounter that "magic point" in the cardiac cycle when depressed conduction might be transiently alleviated.
— P.S. — What I especially like about postulating the occurrence of "supernormal" conduction as the mechanism explaining why early beat #2 conducts — is that it supports my contention that it is all-but-impossible for a short grouping of Mobitz I to coincidentally interrupt complete AV block.
=================================================
For Additional Material on Subjects Covered Above:
ECG Blog #202 — How to quickly tell if there is Complete AV Block (Also check out the Audio Pearl in this post!).
ECG Blog #246 — What is the "Mirror Test" for Posterior MI (Also check out the Audio Pearl in this post!).
ECG Blog #258 — How to "Date" an MI? (Also check out the Audio Pearl in this post!).
ECG Blog #184 — The "magic" mirror-image opposite relationship between lead III and lead aVF with acuteMI.
ECG Blog #190 — How to Recognize RV MI (Also check out the Audio Pearl in this post!).
ECG Blog #188 — How to Read (and/or Draw) Laddergrams!
ECG Blog #266 — deWinter T waves or Posterior MI?
Friedman M and Schweitzer P: Transient Unexpected Improvement of AV Conduction: What is the Mechanism? (ie, Supernormal conduction?).
Ken Grauer, MD www.kg-ekgpress.com [email protected]