
Submitted by Dawn on Sat, 02/04/2023 - 10:22
Usually, instructors of basic ECG classes look for examples of the most common conditions that are likely to be encountered by the learners. But, sometimes, it is advantageous to show students more unusual presentations to remind them of the infinite possibilities when we care for living beings. This series is a very good example of what can and does happen to some people with cardiovascular disease. It will give your students an opportunity to think about possible interpretations, and also about anticipating clinical implications and emergencies that may arise.
The Patient: This patient is a man in his 80s who has been active his whole life. He considers himself to be healthy, giving no medical history and denying medication use. He states that he has had a yearly health exam. Today, he felt “tired and dizzy” while raking leaves. As he walked to his house to rest, he had a syncopal episode and fell, hitting his head. He was unconscious for a few minutes. A family member called for Emergency Medical Services (EMS). Paramedics found him awake and complaining of bilateral “shoulder and wrist” pain. He had no obvious trauma to his extremities, but had some bruising on his head and face. He denied recent illness and substance abuse. He was oriented x3. He was pale and diaphoretic, and complained of nausea. He denied chest or back pain. He denied shortness of breath. BP 100/60. Heart rate bradycardic. SPO2 above 95%. He was given aspirin and ondasetron, and transported to a hospital.
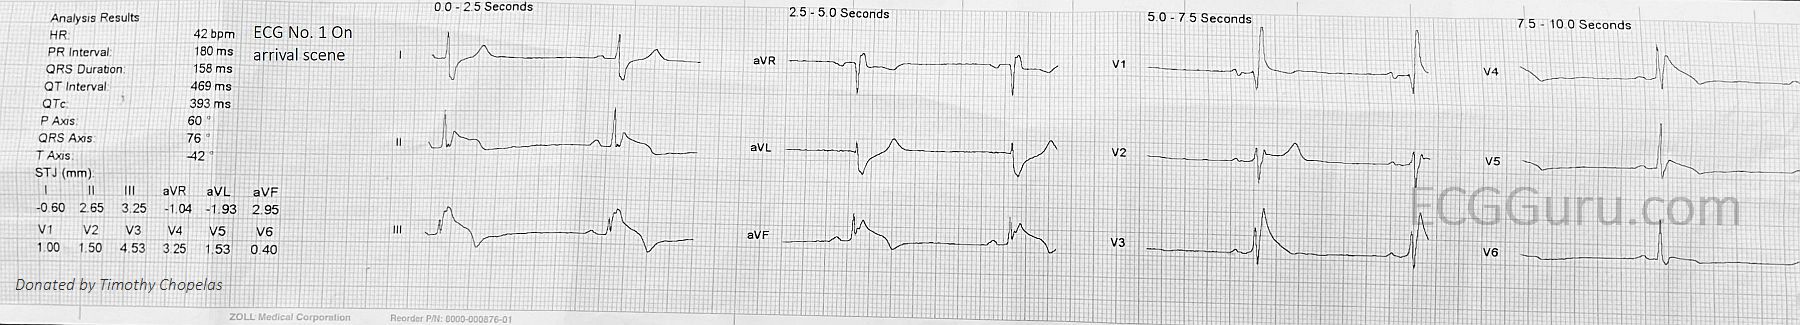
The first ECGwas taken on arrival of the paramedics. We see: sinus bradycardia at 42 bpm. The PR interval is normal at 180 ms. The QRS duration is 158 ms and there is right bundle branch block. The frontal plane axis is normal. The inferior wall leads, II, III, and aVF have marked ST elevation, along with T wave inversion. The ST elevation is due to transmural ischemia (STEMI). This finding is backed up by the ST depression in I and aVL. Reciprocal ST depression confirms that the STE in the inferior leads is due to M.I.
Another unwelcome finding is in the precordial leads. V1 has a small ST elevation, plus a straight ST segment and flat T wave. V2 through V5 have very pronounced ST elevation with a straight shape, and V6 has a more subtle version of the same thing. So, this looks like an acute coronary event happening simultaneously in the inferior and anterior walls!
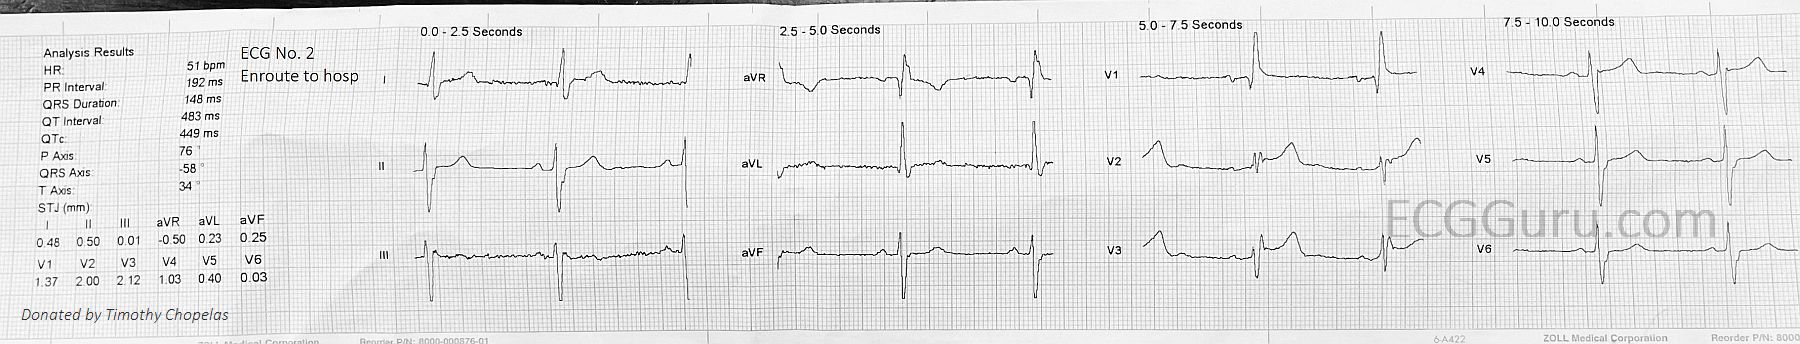
The second ECGwas taken enroute to the hospital. According to the paramedics, the electrodes were not changed, and the patient’s position was not changed drastically. Now, we see a heartrate of 51 bpm. Still slow, but slightly better. The inferior leads now have no STE, although the shape of the ST segment is flat and straight (not good). We also do not see reciprocal STD in I and aVL. Could this be a return of blood flow to the inferior wall? Or an electrode position or patient position issue? The frontal plane axis has shifted to the left. Again, position, or onset of left anterior hemiblock? There is still STE in V1, V2, and V3, although the lateral chest leads look improved.
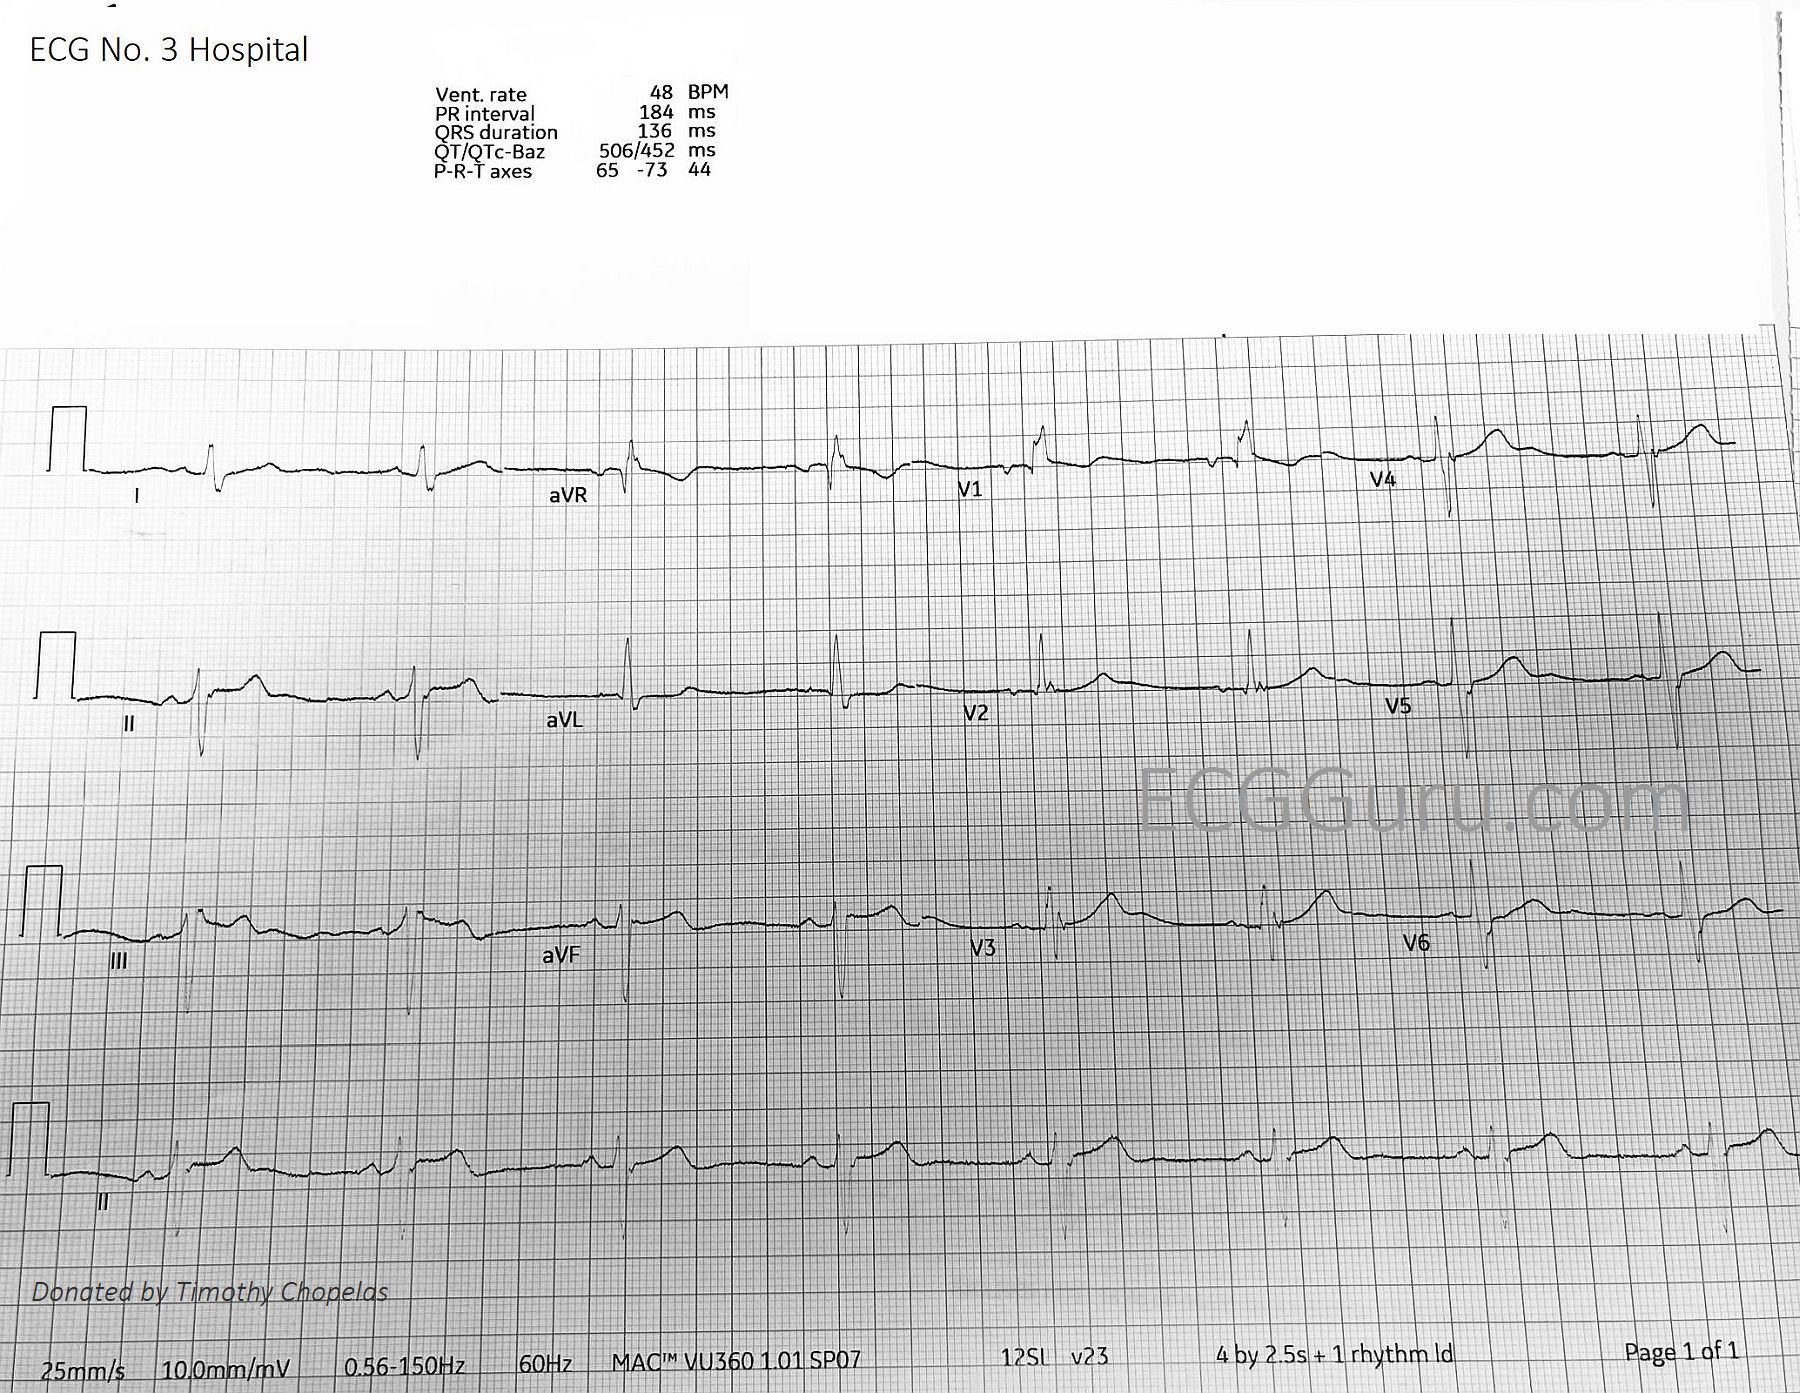
The third ECGwas taken in the hospital, upon arrival of the patient. The rate is 48 bpm, and we still see sinus bradycardia with RBBB. This ECG looks very similar to the second field ECG.
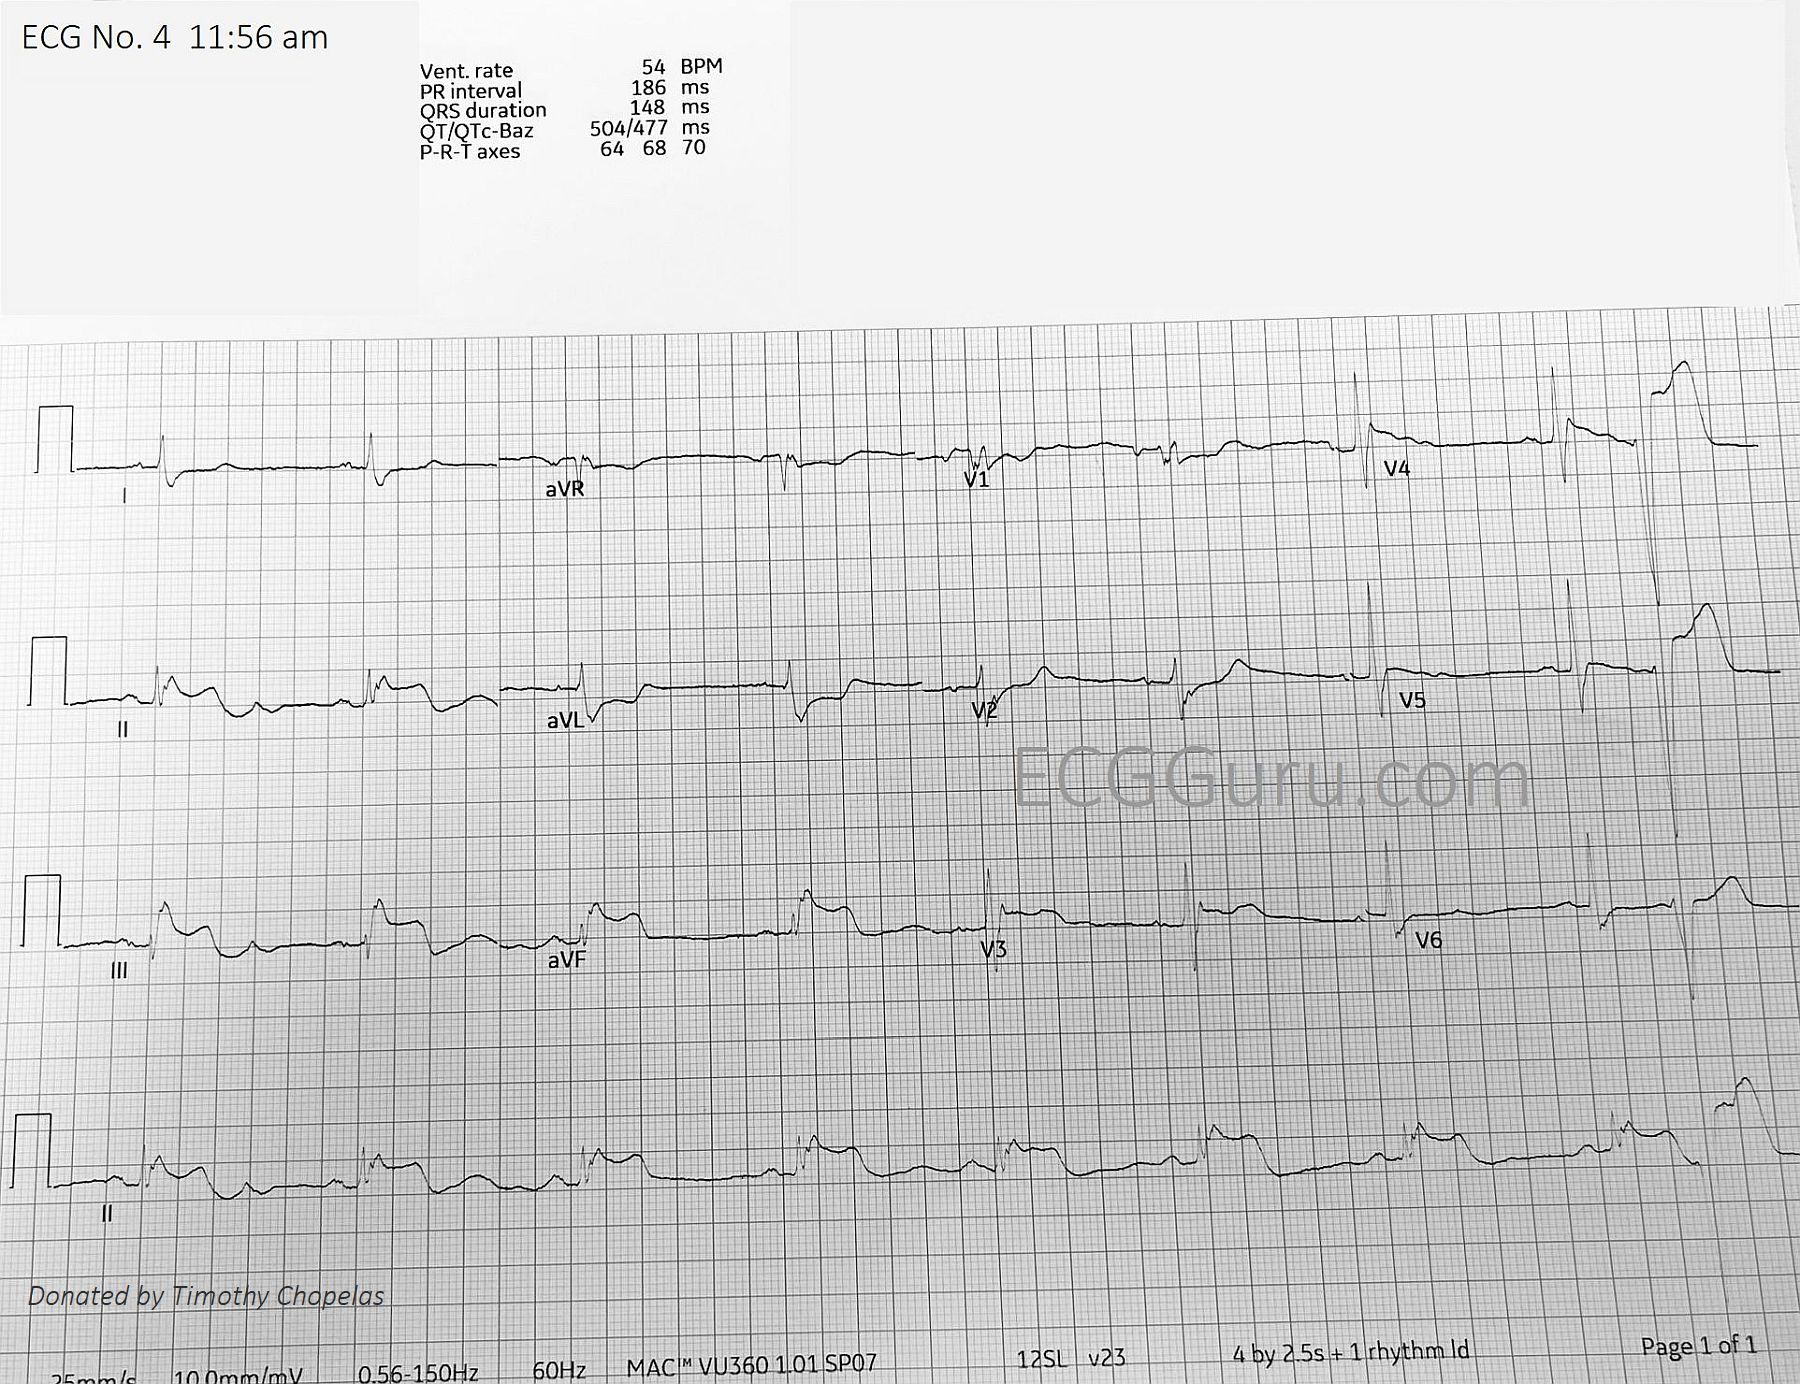
The fourth ECGwas taken ten minutes after the third. Now, we see a return to STEMI patterns in both inferior and anterior walls. Leads II, III, and aVF show us blatant STE, with corroborating reciprocal ST depression in I and aVL. There is even reciprocal depression in V1 and V2, a common finding in inferior wall MI, indicating extension of the transmural injury up the posterior wall. In the first field ECG, this sign was obliterated by the STE in those leads. There is STE in V3- V5, with ST flattening in V6.
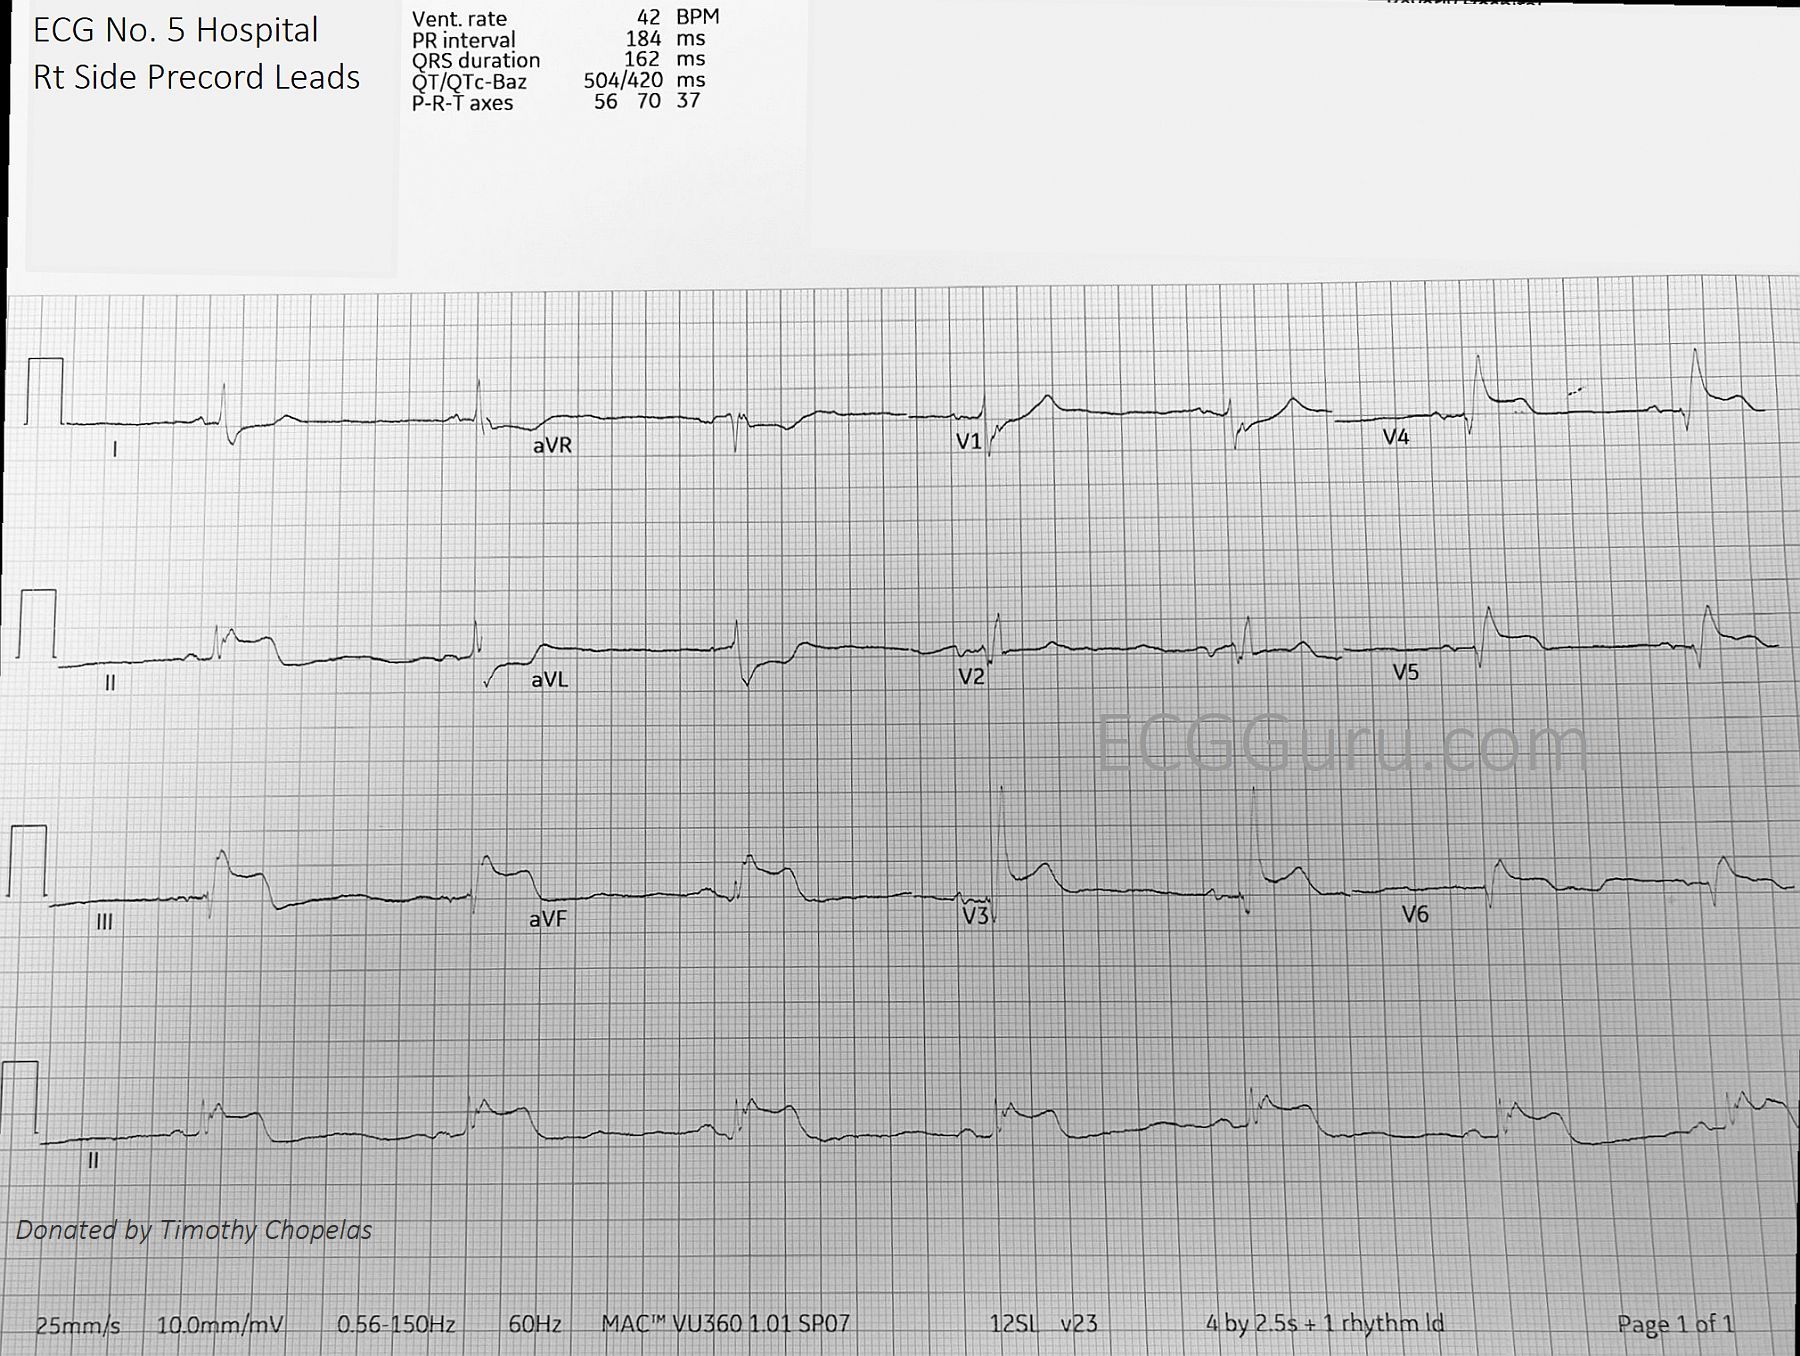
The fifth ECGwas taken with the chest leads placed on the right side of the chest. That is, V1 and V2 wires were switched, and V3 through V6 are in the usual anatomical positions, except on the patient’s right chest. We now see marked STE in V3Rt through V6Rt. Right ventricular MI.
What do you make of all of this? There are several options, even after ruling out electrode placement issues. The patient has remained awake and alert, although bradycardic and symptomatic. The answers will lie in the findings in the cath lab. If the patient has typical coronary artery anatomy and distribution, I would guess that these ECGs represent severe triple vessel disease, with some lesions that are not 100% occlusive. That is, as the arteries dilate, blood flow would improve – when they constrict, blood flow would be affected, and the ECG would reflect this perfusion change. There are many possibilities other than this to consider: “Type 2 M.I”, which is ischemia due to an overall perfusion drop due to a medical or trauma condition; coronary artery spasm; or unusual configuration of the coronary arteries. Occasionally, angiograms reveal an extremely dominant artery that is responsible for most of the heart. There may be a “wrap around” LAD, which wraps around the apex of the left ventricle, perfusing the inferior wall along with the anterior wall. There are even instances of only one coronary artery arising from the aorta, with the other being a branch of the first. So there might be only one branch from the aorta. For example, the LCA might be the only coronary artery branching off the aorta, with the RCA being a branch off the LCA. A proximal lesion would affect all parts of the heart.
Patient follow up: The patient had a cardiac cath. He was found to have severe multi-vessle disease with the following lesions: Right coronary artery, 99% occlusive lesion. Proximal left coronary artery, 40% lesion. Left anterior descending coronary artery, 75% lesion. He was successfully cardioverted from ventricular tachycardia once, and was placed on a balloon pump (we do not know his EF at the time of the cath). He declined CABG surgery, and was evaluated for possible percutaneous intervention. We do not have further information.
Our thanks to Timothy Chopelas for donating this case.
Rate this content:
All our content is FREE & COPYRIGHT FREE for non-commercial use
Please be courteous and leave any watermark or author attribution on content you reproduce.
Comments
Serial Tracings from an Ongoing STEMI
— — — —
Today’s case provides superb illustration of sequential tracings over the course of a large acute STEMI.
As per Dawn — ECG #1 is indicative of acute inferior STEMI, in association with marked sinus bradycardia and RBBB. The RCA (Right Coronary Artery) is suggested as the “culprit” artery — because of significantly greater ST elevation in lead III compared to lead II.
In addition (as per Dawn) — there is equally worrisome ST elevation in chest leads V2-thru-V6 (most marked in leads V2,V3). I was not initially sure of the reason for this — with the most likely possibility being the one stated by Dawn, namely severe multivessel disease with compromised collateral circulation.
P.S. Of note — is the QR pattern in lead V1 of ECG #1 — which in association with RBBB, suggests anteroseptal infarction has occurred at some point in time.
==================
In ECG #2 (as per Dawn) — the heart rate is faster, and ST elevation has almost resolved in the inferior leads, as well as being less in the chest leads. That said — the marked left axis deviation is new! (predominant negativity of QRS complexes in all inferior leads). This is consistent with new LAHB — which also accounts for increased R wave amplitude in leads I and aVL — as well as for the deeper S waves in lateral chest leads V5,V6. Thus, there now is bifascicular block ( = RBBB/LAHB).
As per Dawn — there is no significant change between ECG #3 and ECG #2.
==================
ECG #4 reveals a dramatic change — in the form of a return to marked ST elevation in the inferior leads, with reciprocal ST-T wave changes in leads I and aVL. Although resolution of this ECG is suboptimal — I believe the RBBB persists. However, the LAHB has resolved. Of note in the chest leads — new, shelf-like ST depression in leads V1,V2 suggests (for the 1st time) associated acute posterior infarction. There is 1 PVC. Finally — there is ST-T wave flattening in lateral chest leads V4-V6, which is a definite change from the hypervoluminous T waves seen in the chest leads of the previous tracing.
ECG #5 (with right-sided chest leads) — shows an impressive amount of ST elevation in right-sided leads V3-thru-V6 — consistent with acute RV MI.
===================
IMPRESSION: These serial ECGs show clear evidence of acute Infero-postero STEMI — with acute RV involvement. This is associated with marked bradycardia — RBBB — and transient LAHB. That said — the sequence and nature of some of the ST-T wave serial changes in the chest leads are more difficult to explain UNLESS one postulates (as per Dawn) — that this patient has severe multi-system disease with compromised collateral circulation.
KEY POINT: Although the specific timings of all serial ECGs in this case IS meticulously noted in the text — we were not informed of correlation between symptoms (presence and severity of chest pain) AT THE TIME that each ECG was recorded. Failure to do so results in loss of significant clinical information. For example — resolution of most ST elevation between ECG #1 and ECG #2 could be consistent with spontaneous reperfusion IF this was associated with reduction (or resolution) of chest pain. Similarly — recurrence of inferior lead ST elevation in ECG #4 presumably signals RCA reocclusion — BUT — without clinical correlation (Did chest pain return as ECG #4 was recorded?) — without this clinical correlation, we are GUESSING!
P.S. The impressive amount of ST elevation in right-sided chest leads indicates the proximal RCA as at least one of the “culprit” vessels in today’s case. These serial ECGs provide a superb example of how acute RV MI was ONLY diagnosed by getting right-sided leads!
— — — —
Ken Grauer, MD www.kg-ekgpress.com [email protected]