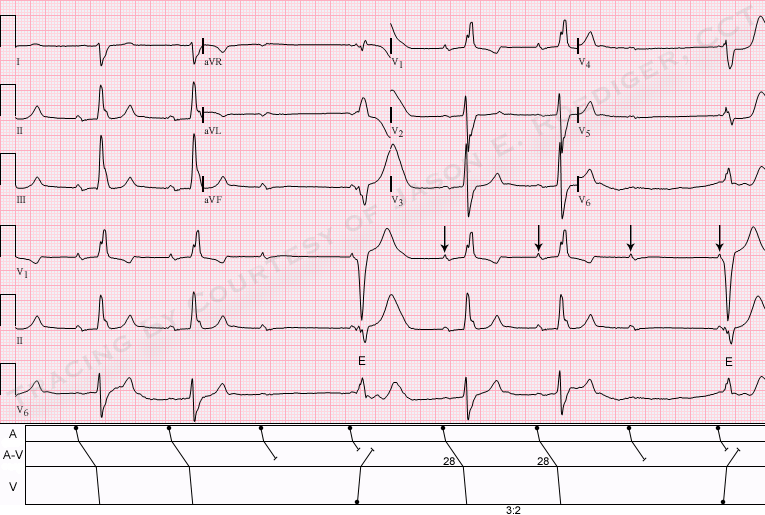
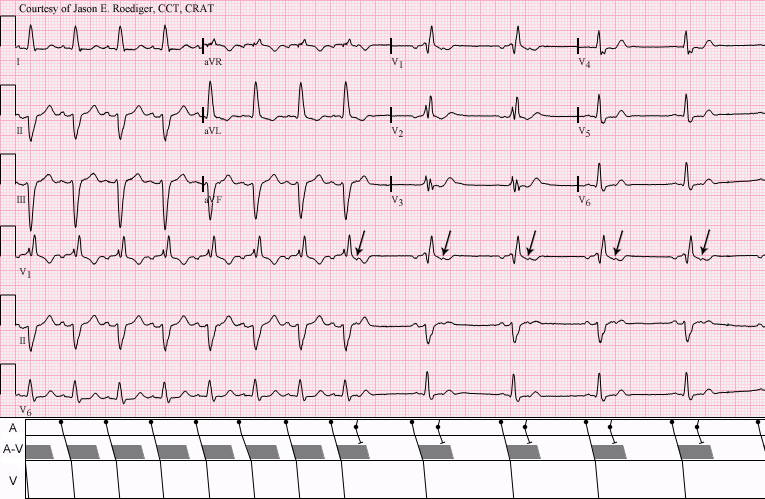
This is a good clear example of right bundle branch block with left posterior fascicular block. The RBBB is diagnosed by the following criteria: wide QRS (.12 sec), supraventricular rhythm (NSR), an rsR' pattern in V1, and wide little s waves in I and V6. The LPFB is inferred by the right axis deviation (Lead III QRS is a bit taller than Lead II and Leads I and aVL are negative), and the fact that there is no other obvious cause for right axis shift noted in this patient. This constitutes a BIFASCICULAR BLOCK. The ventricles are being depolarized by way of the anterior fascicle. In addition, there are slight ST elevations in many leads, with an upward coving in the anterior-septal leads (V1, V2, V3). Depending upon the patient's history and presentation, this could represent a recent M.I. or pending issues. The borderline first-degree AV block may be of concern in this patient, since first-degree AVB is associated with progression of bifascicular block to complete heart block. Reference: Ann Card Anaest, 2010 Jan-Apr;13(1):7-15. doi: 10.4103/0971-9784.58828
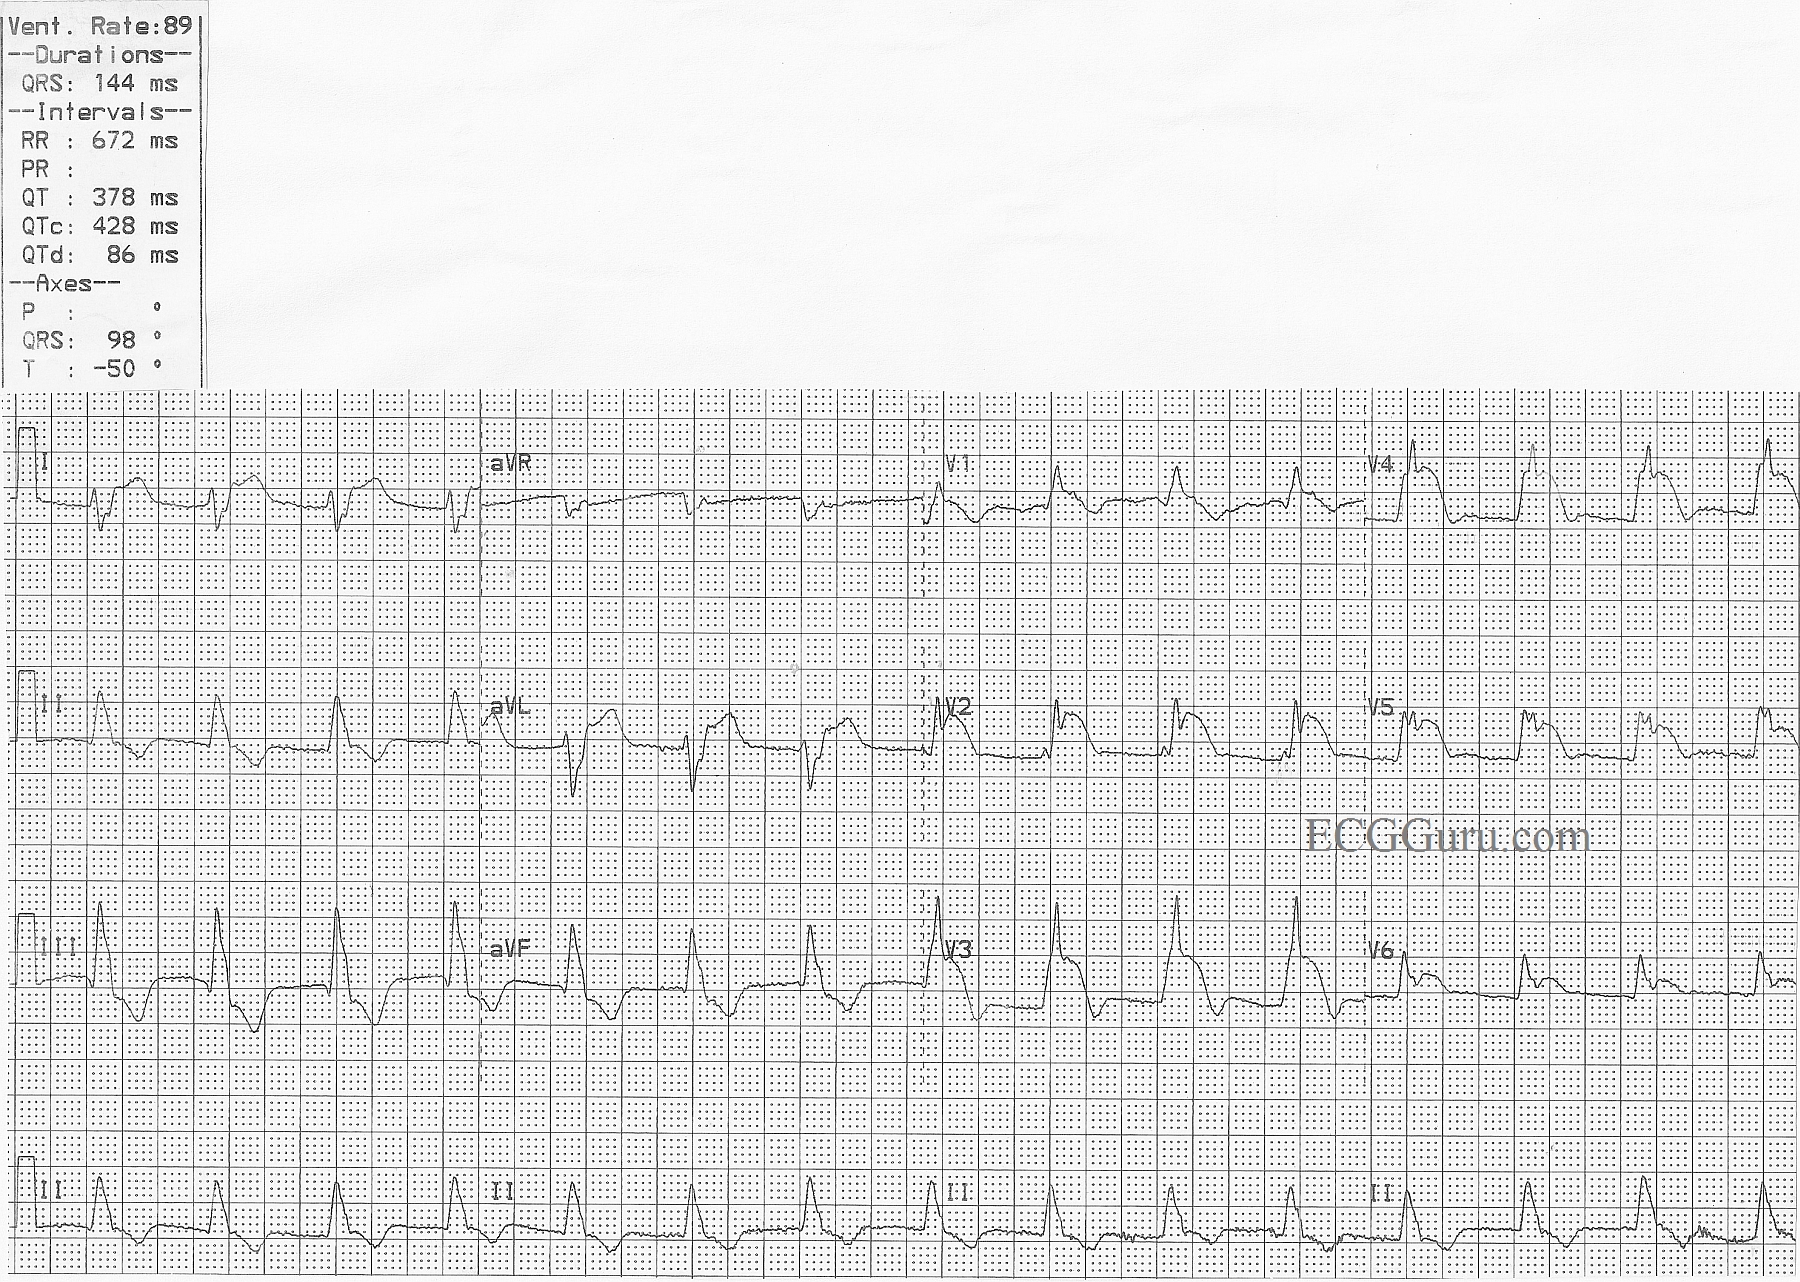
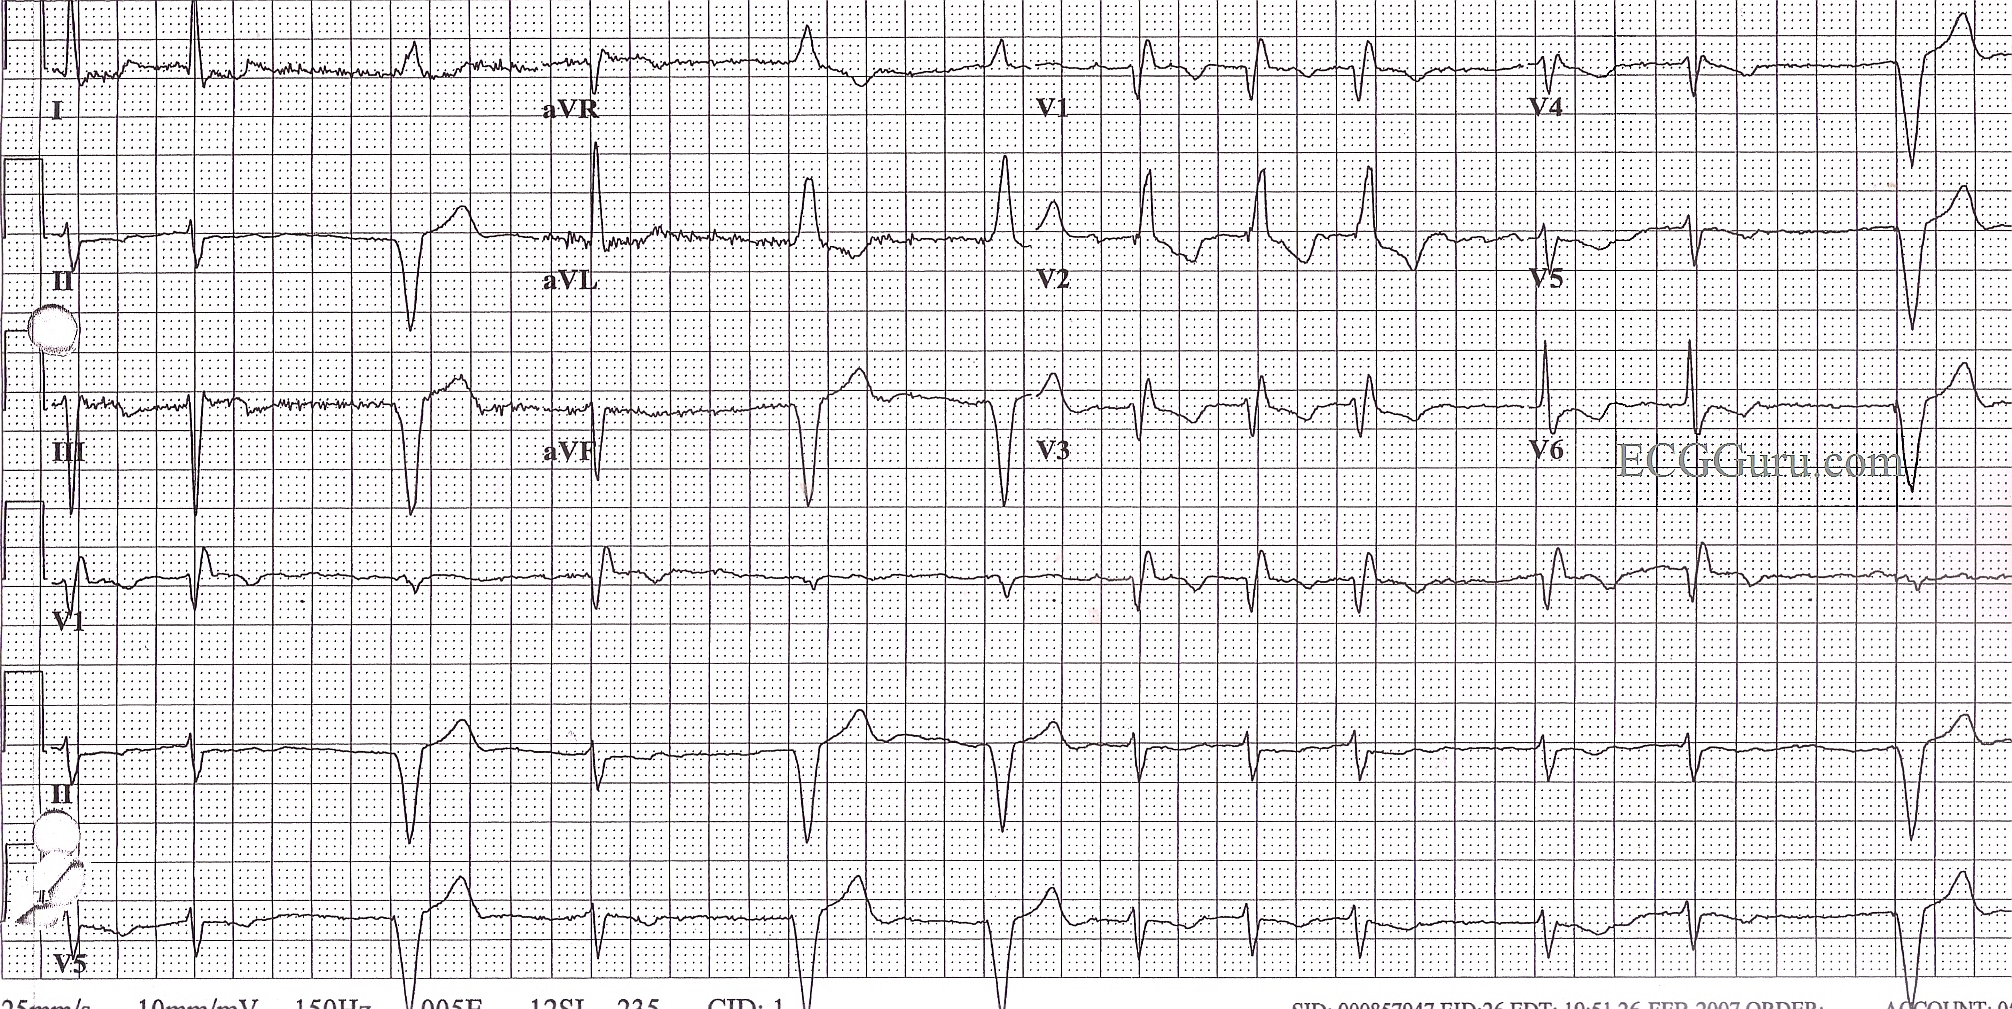
This is a good example of acute anterior wall M.I., with ST elevation in V1 through V6, as well as in Leads I and aVL. The extensive distribution of ST segment elevations across the anterior and high lateral walls indicates a proximal LAD artery occlusion. In addition, this ECG shows right bundle branch block, with a QRS width of 144 ms (.14 sec.) and an rsR' pattern in V1. There is also a wide s wave in Lead I which is partly obscurred in V6 by the ST elevation. The right axis deviation (98 degrees) suggests a left posterior fascicular block which, when coupled with the RBBB, is a bi-fascicular block. P waves are difficult to see. Do you think they are found at the end of the QRS complexes, representing a long first-degree AVB? Look at leads V3 through V6 for clues.
Please feel free to add your comments below. The more "gurus" the better.
A good ECG to teach your students that a patient facing a life-threatening emergency may have a "normal" rate and regular rhythm. There is something in this ECG for beginners through advanced students.
From June 10, 2012: As is the case with all practical blogs, I’m encouraging ECG Guru members to engage in active group participation. Share your thoughts, observations, impressions, findings, and interpretations. Feel free to compare notes with one another and pick each other’s brains.
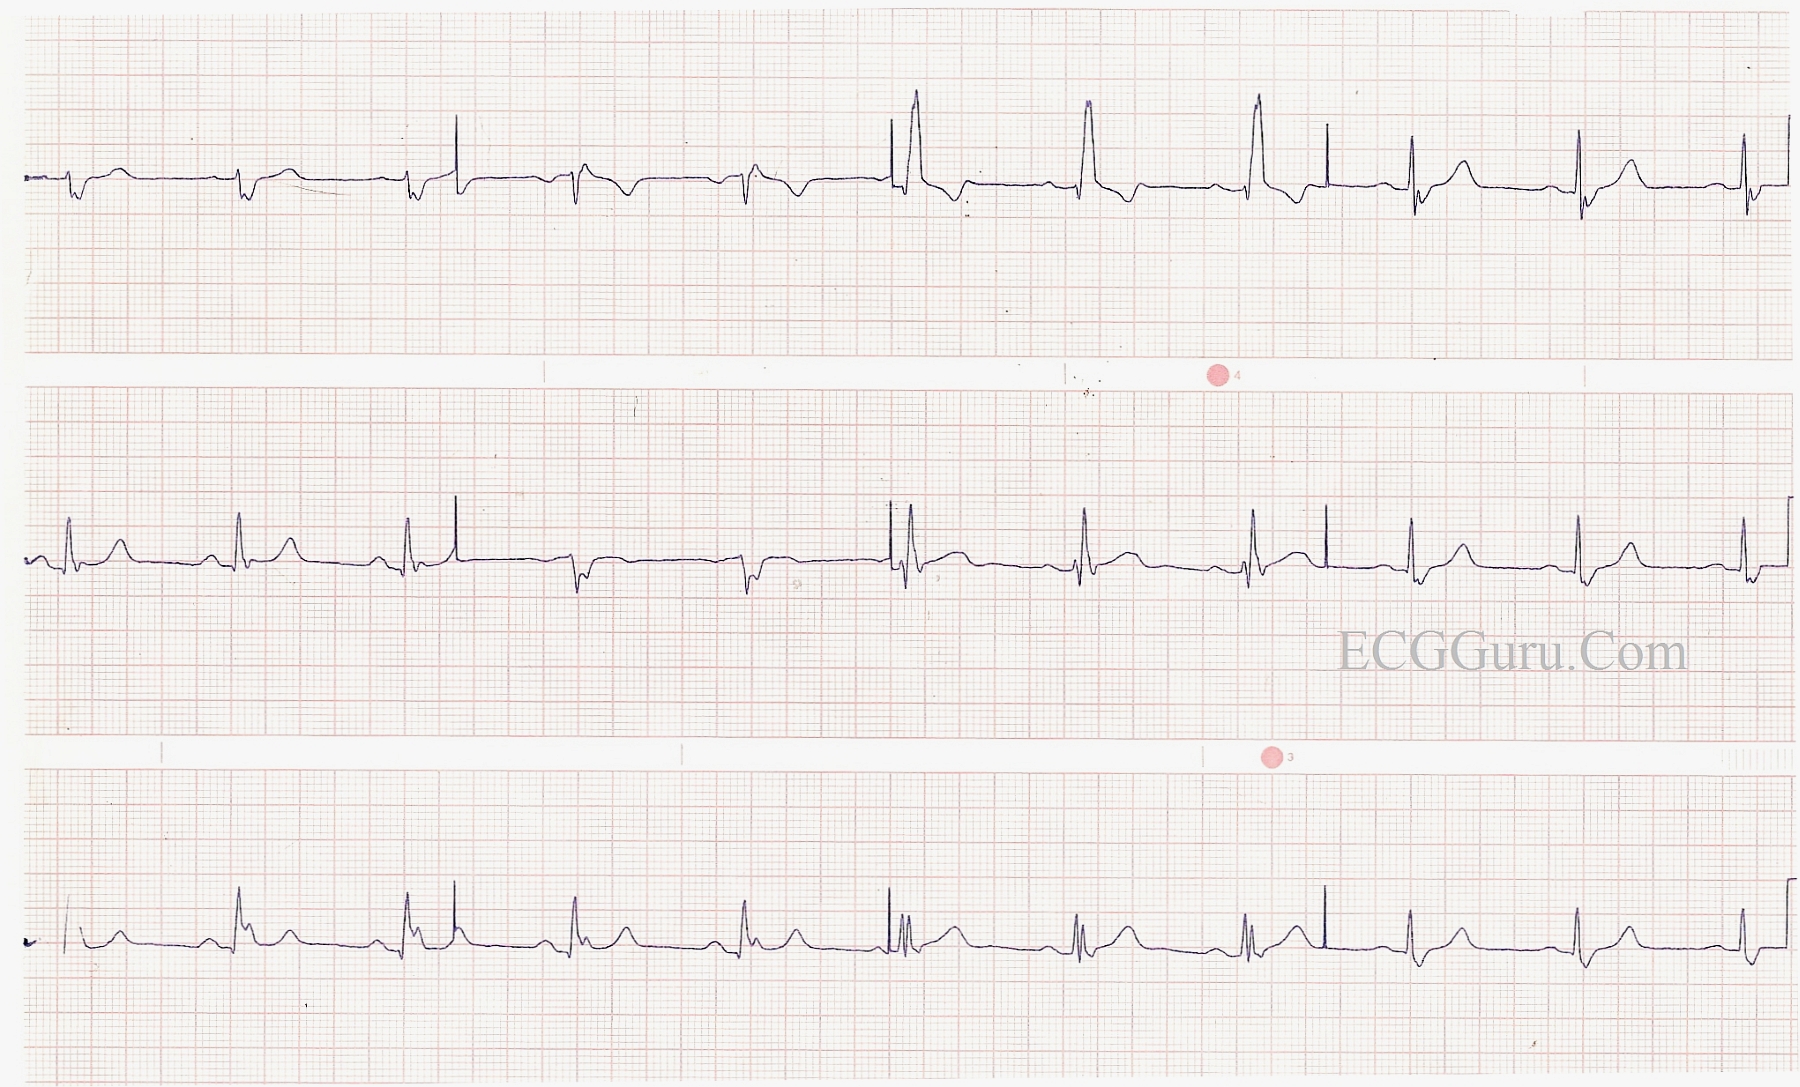
Lots of information in this ECG! The underlying rhythm is atrial fibrillation with a controlled rate. The QRS is .12 seconds in duration, with an rSR' pattern in V1 and a wide s wave in Leads I and V6, indicating right bundle branch block. In addition, the axis is leftward - Leads I and aVL are upright and Leads II, III, and aVF are negative. There is no other obvious reason for the left axis shift, and therefore, the diagnosis by exclusion is left anterior fascicular block. RBBB and LAFB often appear together, as the right bundle branch and the anterior fascicle of the left bundle share the same blood supply from the left coronary artery. ALSO, this patient has a right ventricular pacemaker, and is pacing appropriately when the atrial fib slows. Pacer spikes are not readily seen, but the width of the QRS, the axis of the wide QRS complexes (left), and the timing (after a pause) all support the paced rhythm diagnosis. V5 and V6 actually show a very tiny hint of a spike. The T wave inversions seen in the upright leads are common with RBBB, and are usually considered normal in this setting.