Displaying 11 - 20 of 26
Dawn's picture

Atrial Pacing With Right Bundle Branch Block

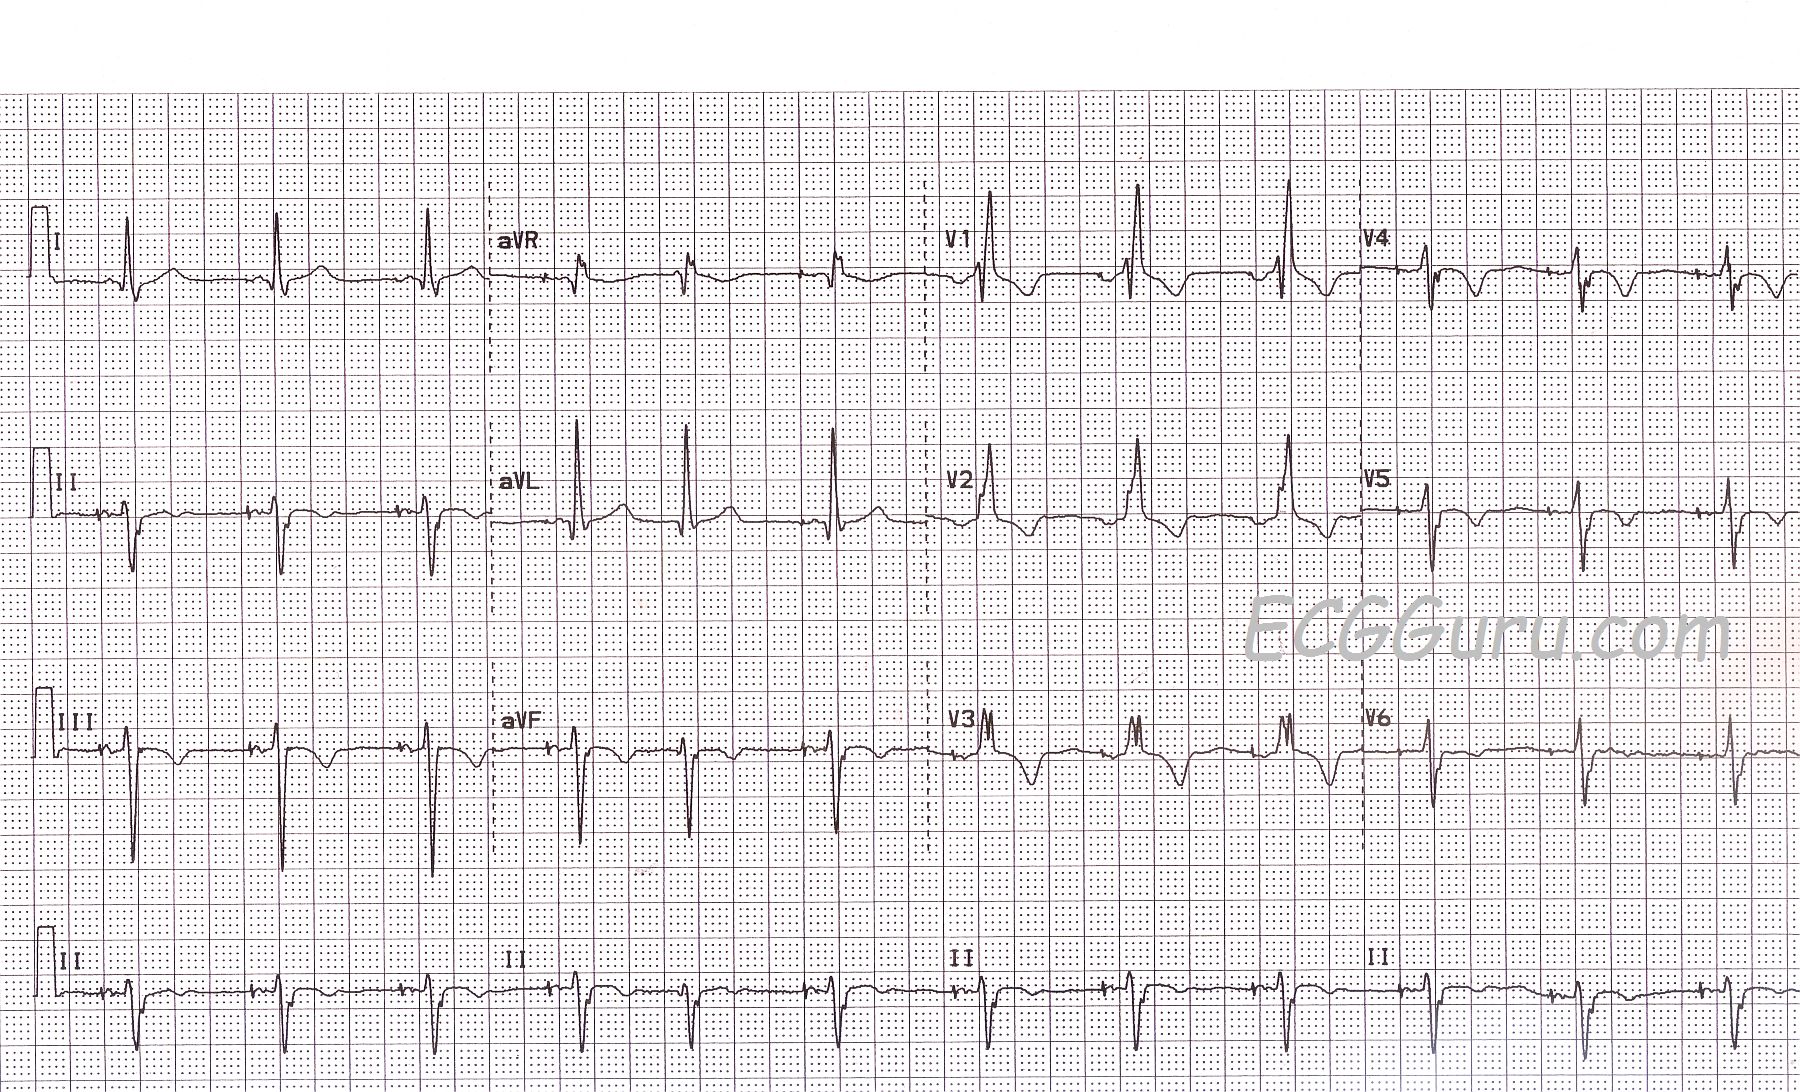
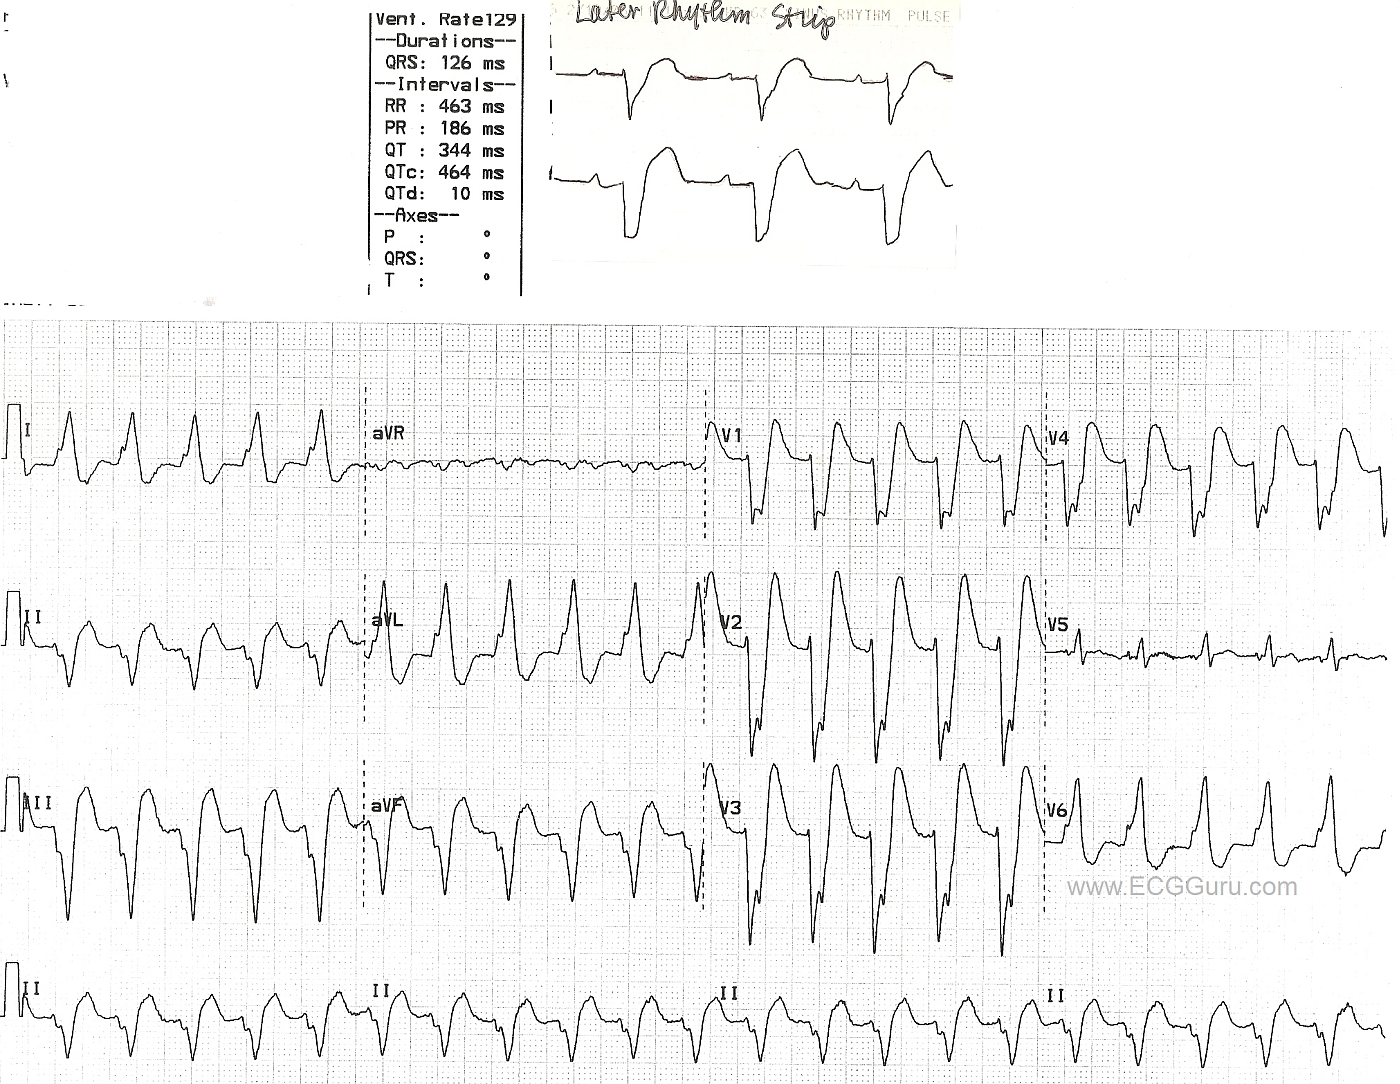
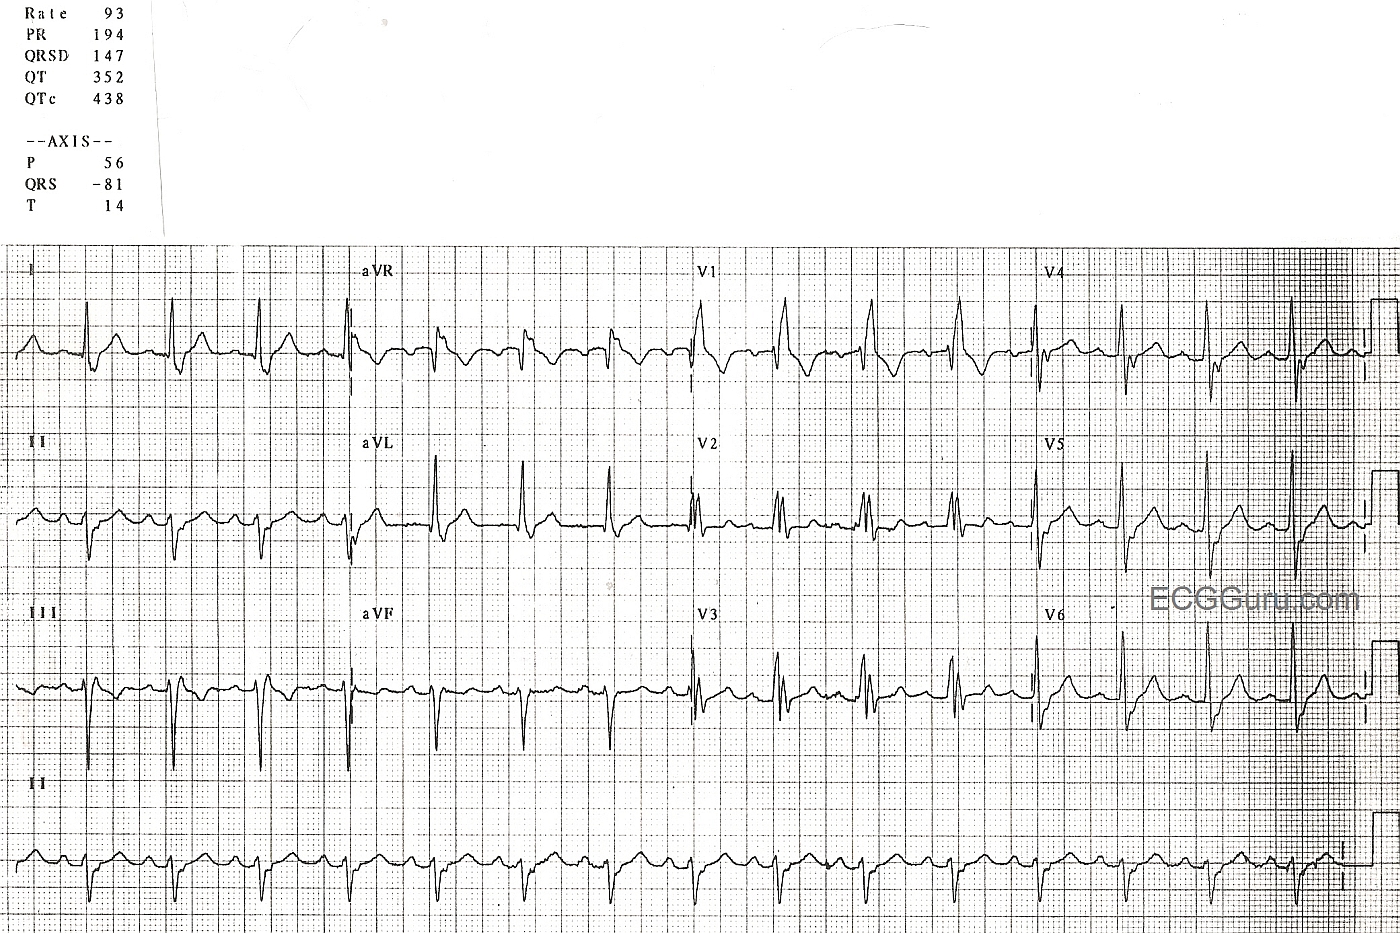
No instructor's collection should be without an atrial paced rhythm OR a right bundle branch block.  Here, you get both.  First, the atrial pacing.  This patient had a sinus node problem, but his AV conduction system was functional (if not perfect).  At this time, he is able to conduct impulses from the atria to the ventricles.  What he cannot do is reliably produce the impulse in his atria.   So, this pacemaker is currently pacing the right atrium, producing a paced "P" wave, which is then conducted to the ventricles.  The fifth beat on the strip shows a "native" beat - one produced by the patient.  No P wave is seen, so it is presumed to be a junctional beat.

As for conduction through the ventricles, there is a right bundle branch block.  The left bundle branch is ensuring that the ventricles receive the depolarization "message", and the ventricles are depolarizing and contracting.  However, the right ventricle gets the message a little late, since is arrives from the left ventricle, and not through a functioning right bundle branch.  This produces a terminal wave on each QRS that represents this delayed depolarization of the right ventricle.  In leads oriented to the left side of the heart, like I and V6, it is seen as a wide little S wave.  In V1, which is oriented to the patient's right, we see an R prime (R'), producing the easily-recognizable rSR' pattern of RBBB.

For your more advanced students, this patient has atypical T waves for RBBB.  Normally, the T waves axes should be OPPOSITE that of the terminal portion of the QRS.  So, Lead V1 correctly shows an inverted T wave, since the R' is a positive deflection.  There are inverted T waves in Leads III, aVF (II is biphasic), as well as in V4, V5, and V6.  We expected upright T waves here. Because we do not have clinical information for this patient, we will call them "non-specific" T wave changes, remembering that inverted T waves can be a sign of ischemia.

ALSO:  As noted in Dave Richley's comment below, there is a left axis deviation, with a negative Leads II, aVF and III, and a positive I and aVL.  This  indicates left anterior fascicular block, which is rather common with RBBB, since the right bundle branch and the left anterior fascicle share a blood supply. So, this person as a "bi-fascicular block". 


Dawn's picture

Atrial Flutter With 2:1 Conduction And Left Bundle Branch Block

This ECG is a two-for-one teaching opportunity.  This elderly woman presents with a tachycardia at about 120/min.  We do not have any other information about her complaints or past medical history.

Her ECG shows a wide-complex tachycardia.  The QRS complexes are about 124 ms (.12 sec.) wide.  On the most basic level, we should teach our students to consider ALL wide-complex tachycardias to be ventricular tachycardia until proven otherwise.  This ECG has many clues that it is NOT ventricular tachycardia.  Tiny P waves can be seen in V1, V2, and V3.   But, these are not the only P waves.  The atrial rate in this case is twice the ventricular rate, making the rhythm ATRIAL FLUTTER with 2:1 conduction.  The flutter rate is about 240/minute, slightly on the slow side for AFL.  Atrial flutter with 2:1 conduction is often missed, as every other P wave is hidden.  Look at aVR and Lead II in this case for signs of the regular flutter waves.  It is important to look in all 12 leads for signs of flutter waves in any tachycardia over 120/min.  Occasionally, you will get lucky, and the patient will conduct at a different ratio, such as 3:1 or 4:1, making the flutter waves much more visable.  Sometimes, the atrial flutter becomes apparent during carotid sinus massage or a Valsalva maneuver.

The QRS width, in this case, is due to left bundle branch block.  The criteria for LBBB are:  Wide QRS, Supraventricular Rhythm (in this case, atrial flutter), and a negative QRS in V1 with a positive QRS deflection in Leads I and V6.  The ST changes seen here are typical of LBBB:  ST depression in leads with upright QRS complexes and ST elevation in leads with downward QRS complexes.


Dawn's picture

Right Bundle Branch Block

This ECG shows a normal sinus rhythm at 73/min. and a right bundle branch block.  The diagnostic characteristics of RBBB are:  wide QRS (greater than .12 sec.), supraventricular rhythm (in this case NSR), and an rSR' pattern in V1 with a small, wide S wave in Leads I and V6.  The R' and small s waves represent the right ventricle depolarizing slightly AFTER the left ventricle.  In fact, in RBBB, each lead should look pretty normal at first, with a terminal right ventricular depolarization wave added to each QRS complex.  This is because the left ventricle depolalrizes normally.  In this patient, R waves progress fairly soon in the precordial leads (V1 through V2).  It is not known in this case if it is due to poor electrode placement or patient causes.

Dawn's picture

Left Bundle Branch Block

This ECG offers a good example of the left bundle branch block pattern.   * The QRS is wide at 144 ms.  * There is a supraventricular rhythm - in this case, normal sinus rhythm with beat number two a PAC, and a slightly prolonged PR interval.  * The QRS is negative in V1 and positive in V6 and also Lead I.  This satisfies the ECG criteria for left bundle branch block.

The main lesson this tracing offers for beginner or refresher students is the value of multi-lead assessment. Using only one or two leads, you may miss important information needed to correctly interpret the ECG.   In order to meet the LBBB criteria, we must show that there exists a supraventricular rhythm (not ventricular). One easy way to prove the rhythm is supraventricular is the presence of P waves.  In this ECG, P waves are very small, and are invisible in some leads, such as Lead I, aVL, Lead III, and aVF.  P waves can be seen well in Lead II and in the chest leads.  Some helpful hints, if viewing on a computer, enlarge the image to better see the P waves.  Look at the ECG machine's interpretation.  If a numerical PR interval is given, and a P wave axis, then the computer is finding P waves.   If you don't see them in one lead, try others.

For your more advanced students, ST elevation is common in wide-QRS rhythms, occuring in leads that have a negative QRS complex.  Conversely, ST depression will be seen in leads with wide, upright QRS complexes.  This makes the ECG with LBBB very confusing to read.  Evaluation of the ST segments should be deferred to experts.  Most EMS field protocols allow for a STEMI Alert to be called in LBBB only if the LBBB is known to be new-onset and the patient has obvious cardiac symptoms.  You can find many more examples of LBBB on this site, even LBBB with acute MI.   

Dawn's picture

Wide Complex Tachycardia: Left Bundle Branch Block With Subsequent Rhythm Strip

 This wide complex tachycardia has an initial rate of 129/min. It is difficult to discern if P waves are present, although the ECG machine does give us a PR interval. The ECG meets most of the criteria for left bundle branch block: wide QRS, negative QRS in V1, positive QRS in Lead I and V6.The axis is leftward, which is common in LBBB.  However, it is difficult to say for certain that this is a supraventricular rhythm. Later, however, the patient's rate slowed (see top strip), revealing P waves. When the rate slowed, the left bundle branch block pattern remained. That helps confirm the original interpretation of left bundle branch block. Interestingly, the BBB is not rate-related, in that it is still present at the slower rate.

Of course, it would be helpful to have a complete 12-Lead ECG after the rate slowed, and it would also be good to see the onset and/or offset of the fast rhythm, which would help to determine if this is a sinus tachycardia or a paroxysmal supraventricular tachycardia (PSVT).  We do not have clinical data to help us determine if a sinus tachycardia with a rate of around 130 / min. would be appropriate or expected in this patient.

Click on image, or, for best image quality, right click and SAVE image.


Dawn's picture

Right Bundle Branch Block With Left Posterior Fascicular Block

This is a good clear example of right bundle branch block with left posterior fascicular block.  The RBBB is diagnosed by the following criteria:  wide QRS (.12 sec), supraventricular rhythm (NSR), an rsR' pattern in V1, and wide little s waves in I and V6.  The LPFB is inferred by the right axis deviation (Lead III QRS is a bit taller than Lead II and Leads I and aVL are negative), and the fact that there is no other obvious cause for right axis shift noted in this patient.  This constitutes a BIFASCICULAR BLOCK.  The ventricles are being depolarized by way of the anterior fascicle.  In addition, there are slight ST elevations in many leads, with an upward coving in the anterior-septal leads (V1, V2, V3).  Depending upon the patient's history and presentation, this could represent a recent M.I. or pending issues. The borderline first-degree AV block may be of concern in this patient, since first-degree AVB is associated with progression of bifascicular block to complete heart block.  Reference:  Ann Card Anaest, 2010 Jan-Apr;13(1):7-15. doi: 10.4103/0971-9784.58828


Dawn's picture

Recent Anterior-Septal Wall M.I. With Right Bundle Branch Block

This is an ECG from a 95 year old man who was recovering from an anterior-septal wall M.I.  Other clinical data for this patient has been lost, except that he suffered a new right bundle branch block during this M.I.  The ECG shows pathological Q waves in V1, V2, and V3, consistent with permanent damage (necrosis) in the anterior septal wall.  The ST segments in those leads are coved upward.  Even though the J points are not elevated, this ST segment shape suggests recent injury.  The classic RBBB pattern is present:  wide QRS, rSR' pattern in V1, and wide little s waves in I and V6.  It is not known why the overall voltage is low in this patient.

Dawn's picture

Normal Sinus Rhythm With Aberrantly-Conducted PACs

This is a normal 12-Lead ECG with two PACs that are aberrantly conducted in a right bundle branch block pattern. (Sixth and ninth beats). In the PACs, the QRS is slightly wider than the normal beats.  The aberrantly-conducted beats have an rsR' pattern in V1, and a wide little S wave in aVL. No PACs are seen in Lead I to demonstrate the wide S wave.  This represents a right bundle branch block pattern, which is a common form of aberrancy, and is rate-related.  That is, the PAC occurs early in the cycle, catching the right bundle branch is a refractory state and unable to depolarize.  Slower beats are easily acommodated by the right bundle branch.

Dawn's picture

Right Bundle Branch Block With Left Anterior Fascicular Block

This is a nice, clear right bundle branch block pattern: wide QRS, supraventricular rhythm (NSR), and rSR' pattern in V1. Wide little s waves in Leads I and V6 are also diagnostic. The left axis deviation indicates a left anterior fascicular block, since there is no other apparent reason for the left axis deviation, such as pathological Q waves or LVH. Left anterior fascicular block is a diagnosis of exclusion, also considering that RBBB and LAFB are often seen together (bifascicular block), since the two fascicles have the same blood supply.


Dawn's picture

Sinus Rhythm With Left Bundle Branch Block, PVCs, and Fusion Beats


This is a great ECG for teaching your students about some of the different causes of wide QRS.  This 89 year old man has a sinus rhythm that is around 100 bpm, and his QRS is widened at 148 ms (.148 sec).  Leads I and V6 are positive, and Lead V1 is negative, meeting the criteria for left bundle branch block. There is a left axis deviation, which is common with LBBB, although it is not always this pronounced, indicating that there is possibly another cause for LAD.  In this ECG, there are also PVCs and probable fusion beats.  The 14th beat is a PVC.  Complexes 1, 6, and 9 are possibly fusion beats. Fusion can be described as an almost simultaneous sinus beat and ventricular beat.  The depolarization waves, one coming from the top of the heart and one coming from the bottom, meet and "fuse" on the ECG.  Fusion beats will have some characteristics of the supraventricular beats and some of the ventricular beats.  They are not significant except that fusion can be said to "prove" the existence of a ventricular pacemaker - either a natural pacemaker or an electronic one.

Do you see anything else interesting in this ECG?  How would YOU describe this rhythm?  Please do not hesitate to add your comments, or ask questions of the experts who contribute to this site.  We will respond quickly to all questions.

Pages

All our content is FREE & COPYRIGHT FREE for non-commercial use

Please be courteous and leave any watermark or author attribution on content you reproduce.