
Submitted by Dawn on Wed, 05/01/2013 - 16:06
QUESTION: Do you have any "tricks of the trade" for teaching complex ECG topics?
Our expert today is Dave Richley. 
Dave Richley worked as a clinical cardiac physiologist, in echo, pacing, Holter etc, for over 30 years in various hospitals in North-east England, but for the last few years he has been employed almost entirely in an educational capacity. He teaches undergraduate and postgraduate clinical physiology degree programmes at Sunderland and Newcastle Universities and is currently engaged in a project with the British Heart Foundation, the UK’s leading heart disease charity, to deliver courses in ECG interpretation to cardiac nurses. His particular interest within the field of electrocardiography is complex bradyarrhythmias and conduction disturbances.
"I believe that in this era of high-tech multi-modality imaging, the subtle and complex art of ECG interpretation has become something of a forgotten art and my mission is to see electrocardiography restored to its former and rightful pre-eminent position in diagnostic cardiology!" – Dave Richley
ANSWER:
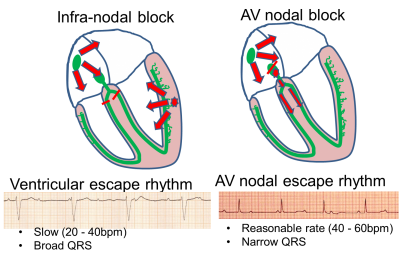
For teaching all but the simplest of topics I am increasingly using pictures. Verbal explanations of ECG phenomena, to those who are not that familiar with the sequence of electrical events and the anatomy of the conduction system in the heart, can be difficult to understand. I have therefore produced a simple picture of the heart on which I superimpose various arrows and other shapes, as appropriate, to help me illustrate various phenomena. Below is an attempt to explain with the help of simple diagrams the different ECG manifestations of complete AV block at the level of the AV node and below the AV node in the ventricles. I have no artistic ability and no special software – I make all my pictures within Powerpoint using the standard drawing tools available.
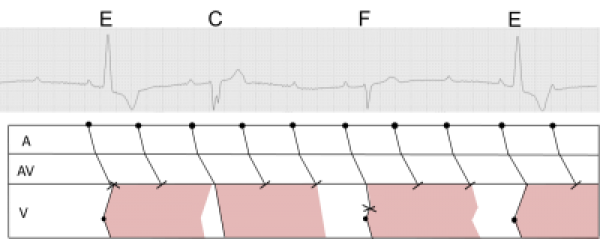
To explain more complex arrhythmias, I need more complex pictures, and I find that laddergrams serve this purpose very well. Convoluted verbal explanations of complicated arrhythmias may just cause bafflement. The ECG itself is merely a depiction of the sequence of depolarisation of the muscle mass of the atria and ventricles; crucially it does not explain conduction – or lack of conduction – directly; these phenomena must be inferred or deduced, and the laddergram is excellent for illustrating the origin and direction of propagation (or failure of propagation) of electrical impulses through the heart. Those inexperienced in ECG tend to assume that if a P wave is seen immediately before a QRS, this indicates that the atrial impulse is conducted to the ventricles. Of course, this is usually the case, but in AV dissociation this relationship between P wave and QRS may be purely coincidental. This is a phenomenon that can be illustrated very clearly with a laddergram. I have tried to use the laddergram below to illustrate what is happening in a case of high grade AV block, with the blocks of pink representing ventricular refractoriness. There are no rules governing laddergrams, just conventions, and I think that people should be free to construct them as they wish in order to illustrate the explanations they are trying to convey. The only absolute requirement is that the deflections of the ECG must be exactly simultaneous with the corresponding lines on the laddergram. There are several ways of constructing laddergrams; my own method is to produce them within Powerpoint by inserting shapes – mostly just straight lines – and copying and pasting them into the correct positions. With practice, this can be done quite quickly.
Related Terms:
All our content is FREE & COPYRIGHT FREE for non-commercial use
Please be courteous and leave any watermark or author attribution on content you reproduce.