
Submitted by Dawn on Wed, 09/23/2015 - 22:14
This ECG is from a 59-year-old man who was a patient in the Emergency Department with mild chest pain. He had a history of coronary artery disease. We have no other information about his medical history, medications, or outcome.
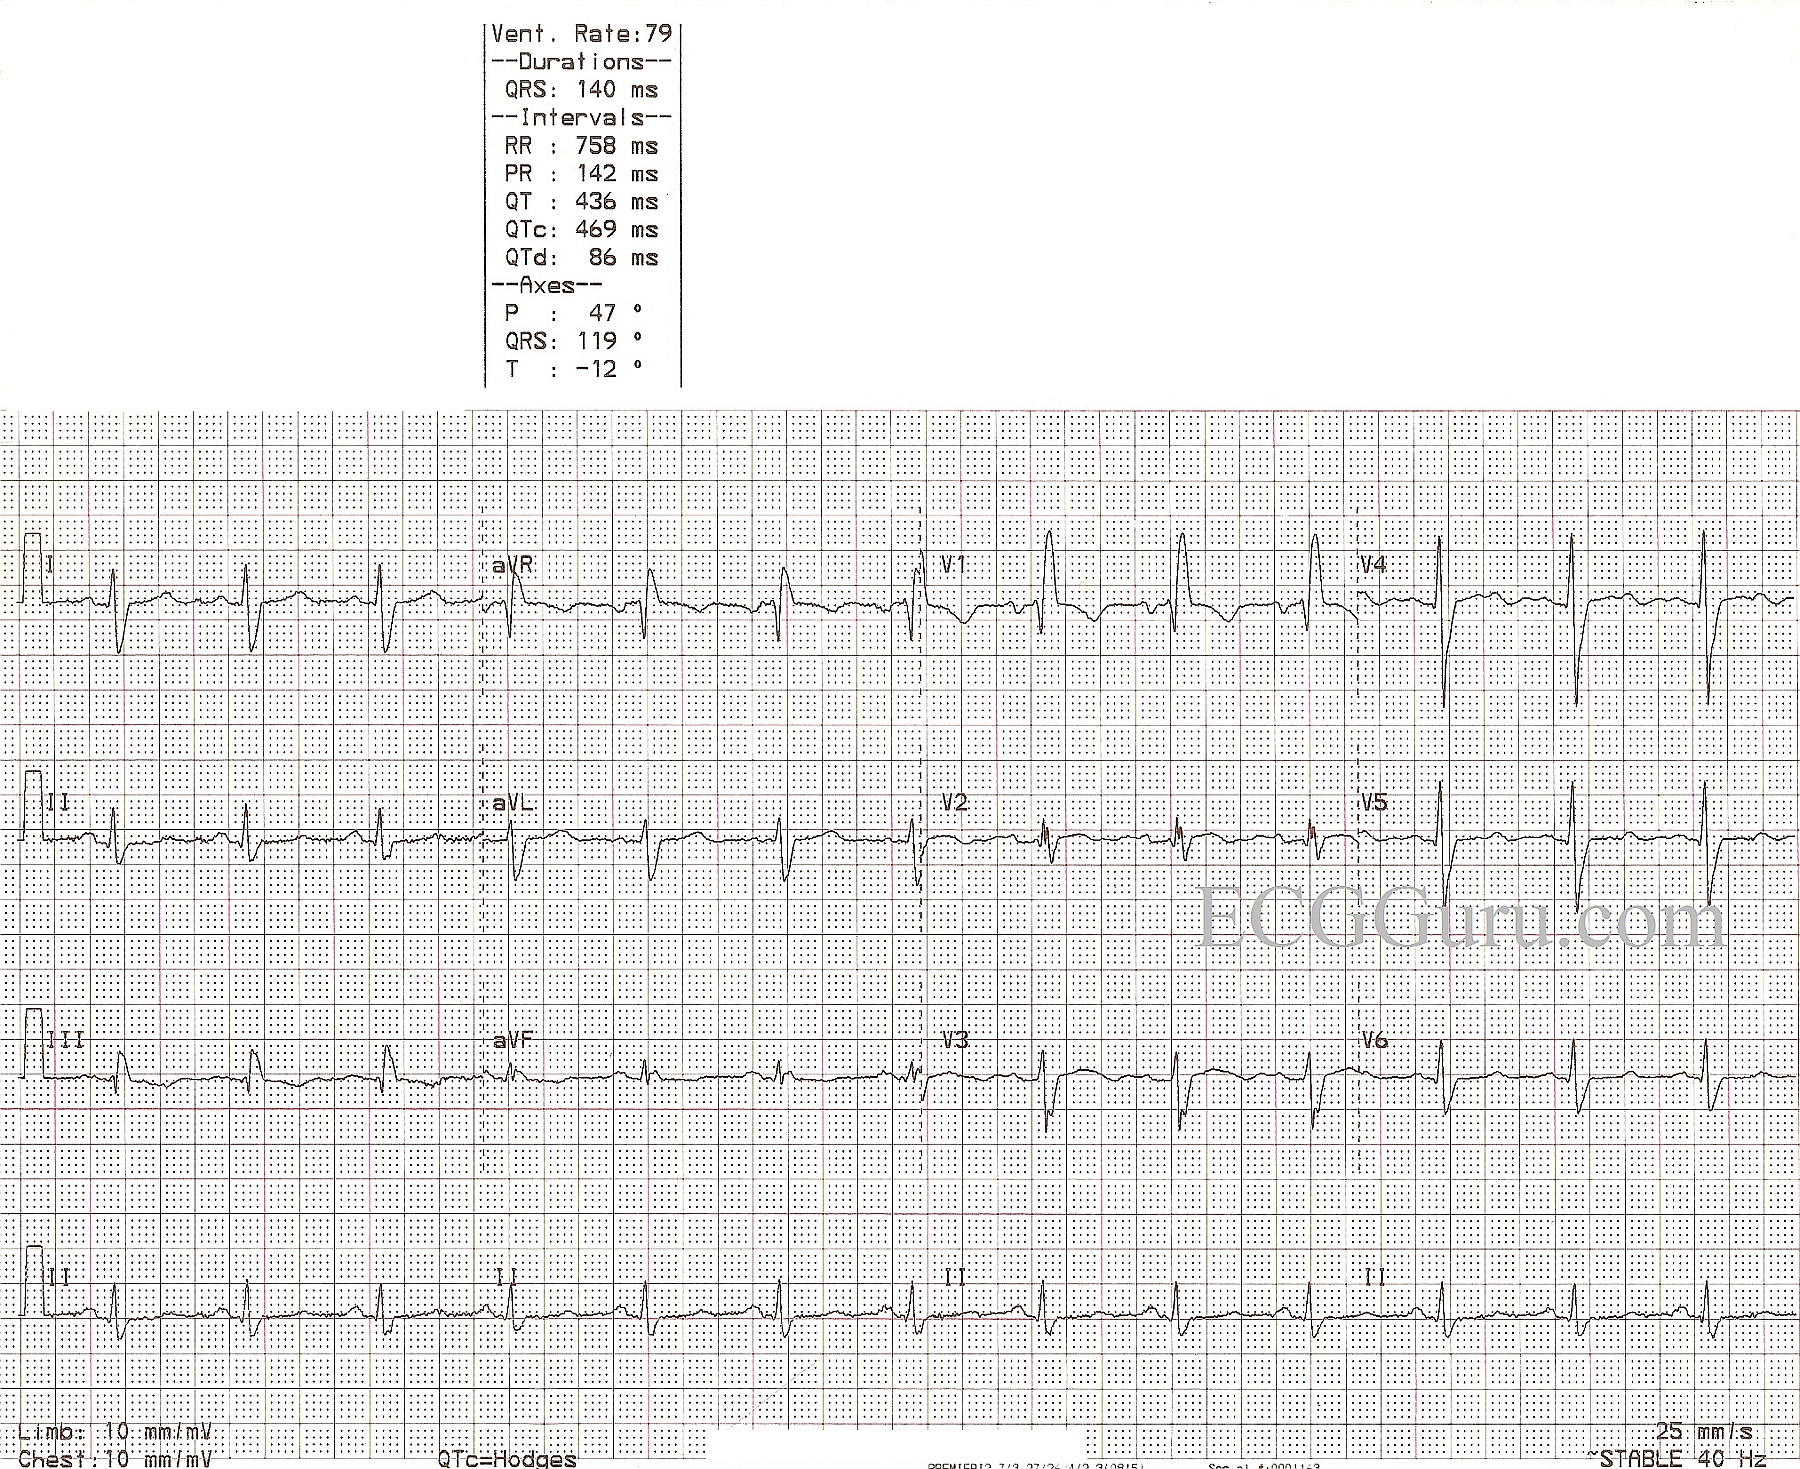
The ECG shows normal sinus rhythm and right bundle branch block. The ECG criteria for right bundle branch block are: 1) QRS wide at 120 ms or more (.12 sec. or more). 2) Supraventricular rhythm. 3) Terminal waves indicating that the right ventricle is depolarizing late. Because the right bundle branch is blocked, the left ventricle depolarizes first. The QRS begins in a normal fashion. The depolarization wave cannot access the right ventricle via the bundle branch, so it travels cell-to-cell across the right ventricle, causing a conduction delay. This delay in depolarizing the right ventricle is seen on the ECG as a separate, terminal wave on the QRS. In V1, it is seen as an R' wave, making the QRS have an rSR' pattern in most cases. In Leads I and V6, there will be a wide, slurred S wave, causing an Rs pattern. The frontal plane axis can be difficult to determine, as the first part of the QRS is from the left ventricle and the second part is from the right ventricle.
The causes of right bundle branch block are many. The website, Life In the Fastlane has a good quick reference.
This patient has a slightly prolonged QTc interval at 469 ms, for which we do not know the reason, lacking clinical information. The QT interval measures the total time it takes to depolarize and repolarize the myocardium, and it is measured from the beginning of the QRS to the end of the T wave. The QT interval lengthens naturally in slow rates, and shortens with faster rates. The QTc has been mathematically corrected to a rate of 60/min. A good rule of thumb is the QT interval should be less than half the RR interval of the preceding beat. A long QT interval (>500 ms) has been associated with increased risk of torsades de pointes.
Related Terms:
Rate this content:
All our content is FREE & COPYRIGHT FREE for non-commercial use
Please be courteous and leave any watermark or author attribution on content you reproduce.
Comments
QTc in RBBB
Just a small point, but the slight prolongation of the QTc could be due simply to the prolongation of the QRS, and it almost certainly, therefore, has no significance. The normal reference range of QTc does not apply when the QRS is prolonged, eg in bundle branch block.
Dave R
RBBB plus some subtle-but-real Changes of ? Significance ...
This week’s case brings up a number of interesting points. The clinical scenario is highly relevant — because it is of a 59-year old man who presented to an ED (Emergency Department) with “mild chest pain”. What “mild” means given that somehow the patient got to an ED is uncertain — but the “message” is that we have to take this as a history of “new chest discomfort” in a patient who presents for care to an ED. That is a VERY different scenario than interpreting an ECG like this one in an out-patient setting in a patient without symptoms …
My thoughts are the following:
— I’d LOVE to see a prior tracing. Alas, none is available …
— The rhythm is sinus. The QRS is wide due to RBBB. Although the QTc may be a bit long by usual standards — RBBB by itself may prolong the QT interval — so the slight amount that the QTc might be prolonged is probably not clinically relevant beyond the RBBB. Regarding chamber enlargement — there is a deep negative component to the P wave in lead V1 = LAA, but no criteria for ventricular enlargement.
— The interesting findings related to QRST Changes. I am uncertain if there is or is not a Q in lead III (seems to be present in the last complex, but not in the first two). By itself (even if present) — this is probably not significant. But there IS a Q wave in lead V2! I see a small-but-definite initial positive deflection in lead V1 — but loss of R wave with a q in V2, in conjunction with the ST-T changes I see (below) to me suggests there has been prior anterior infarction.
— There is ST coving, albeit not really elevation in lead V1. Normally, the J-point is down a bit in V1 with RBBB. That this is a real finding is suggested by ST coving in lead V2. It is hard to say what is T, biphasic T, upright or negative U wave in lead V3 … Similarly, there may be a U (or negative U wave) in V4. Otherwise, ST-T waves look a bit flat in several leads with shallow T inversion in lead III.
IMPRESSION: I suspect that there is nothing “new” going on. That said — We can NOT (in my opinion) be certain that nothing “new” is going on because: i) There IS a Q in V2 that shouldn’t be there; and ii) There IS ST coving beyond what we should see with simple RBBB in V1 and there IS ST coving with a hint of slight elevation in V2 that normally shouldn’t be there. My guess is that this is all residual changes from prior anterior infarction — but since this patient presented with NEW chest discomfort to an ED — the onus of proof is on US to prove that nothing new is occurring (rather than the other way around). Again — My guess is that nothing new is going on — but in the absence of 100% certainty of this, we need to evaluate the patient (ie, troponin, serial tracings, get ahold of old tracings, perhaps stat Echo — and a really careful history with follow-up over time).
Ken Grauer, MD www.kg-ekgpress.com [email protected]
No Q in V2 (in my opinion)
Another small point, but in contrast to Ken, I don't think there is a Q wave in V2. I think there is an initial R wave of the same size, and at the same time, as that in V1, followed by a very small S wave, then a fragmented R wave, then a second and deeper, broader S wave. My guess is that this multiple fragmentation of the QRS is due to old myocardial damage. Sorry to be so pedantic but I wanted to use the new fcaility to upload an image to illustrate my point! However, I cant' see my picture so maybe the upload was unsuccessful.
Dave R