
Submitted by Dawn on Tue, 11/12/2013 - 14:38
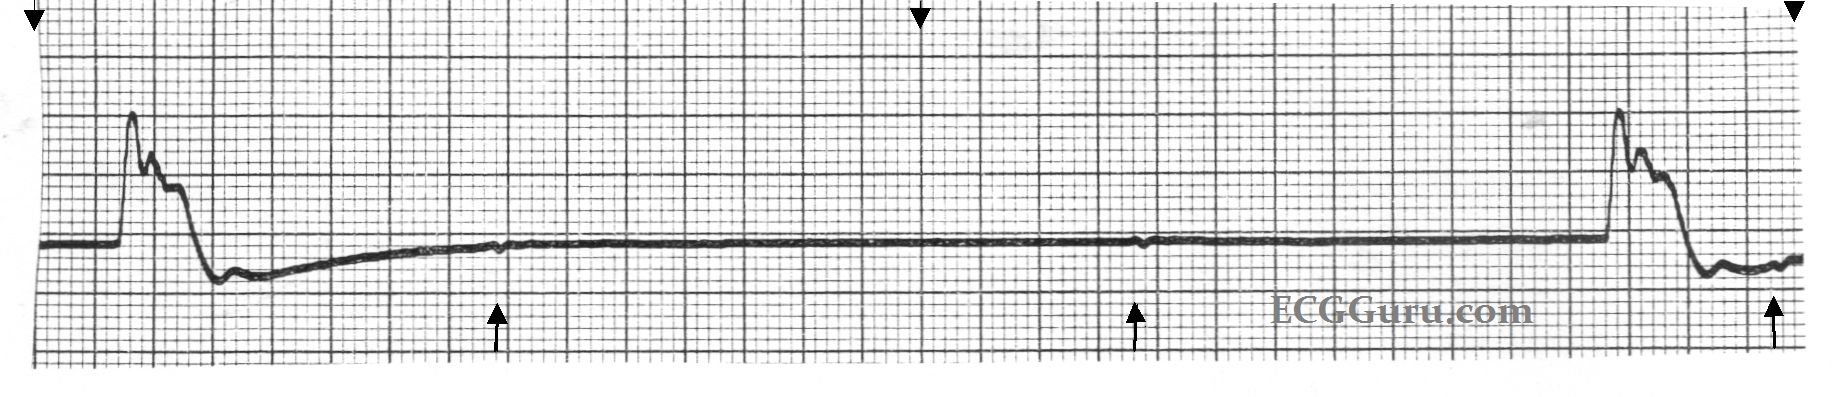
This six-second monitor strip was from a patient who was designated "Do Not Resuscitate", and whose heart rhythm was slowing dramatically. It shows an idioventricular escape rhythm, with very wide QRS complexes and only two complexes in six seconds. (The top arrows mark three-second segments.) If you look closely at the points marked by the lower arrows, you will see small, uniform, regular P waves. The mechanism leading to this agonal rhythm was complete heart block. A longer strip would show the P waves as all alike, and fairly regular, but slowing.
Related Terms:
Rate this content:
All our content is FREE & COPYRIGHT FREE for non-commercial use
Please be courteous and leave any watermark or author attribution on content you reproduce.
Comments
Slow IVR vs Agonal Code Rhythm
Good teaching example of a slow code rhythm. In addition to highlightlight what appears to be slow atrial activity - a few other teaching points might be made:
Ken Grauer, MD www.kg-ekgpress.com [email protected]