Displaying 21 - 30 of 57
Dawn's picture

ECG Basics: Sinus Rhythm With Ventricular Bigeminy

This rhythm strip offers two leads taken at the same time, Lead II and Lead V1.  The Lead II strip may not look "typical" to a beginning student, because the sinus beats are very small and biphasic.  This is due to an axis shift, which cannot be evaluated without more leads.

One of the best teaching opportunities in this strip is the concept of "underlying rhythm" with ectopy.  The underlying rhythm here is sinus.  But there are sinus P waves which are hidden, making the sinus rate twice what it appears to be.  The P waves are invisible in the Lead II strip, with baseline artifact making them even harder to see.  But in V1, we are able to find them at the end of the PVCs' T waves.  The sinus rhythm is a bit irregular toward the end of the strip.  There are probably many things a more advanced practitioner could say about this strip, but it usually requires more than one or two leads to do a complete evaluation.  For your basic student, it is a good example of sinus rhythm with ventricular bigeminy.

Dawn's picture

ECG Basics: Sinus Tachycardia

This is a good teaching strip on many levels.  At the BASIC level, we see a strip that clearly meets all the criteria for sinus tachycardia:  a regular rhythm over 100/min. with P waves that look normal and all look alike.  The rate is 110 per minute.  The PR interval is just at the upper limits of normal at .20 second, or 200 ms.  The QRS complex is within normal limits, but slightly wide at .10 seconds.

This strip is good for teaching rate determination by several different methods.  It is helpful that QRS complexes 1, 5, and 10 fall on the dark lines of the paper.

This is a Lead II rhythm strip, and it is helpful to show students that not ALL Lead II strips produce an upright QRS complex.  Of course, correct lead placement should be confirmed.  In this particular case, the patient had suffered an anterior - septal wall M.I., and has a left anterior hemiblock, also called left anterior fascicular block.  This shifts the frontal plane axis to the left, causing Lead II to have a negative QRS.  Axis can't be accurately determined from one lead, but axis shift explains the negative QRS in this strip.

Dawn's picture

ECG Basics: Sinus Bradycardia With A Premature Atrial Contraction

This strip shows an underlying sinus bradycardia with a rate less than 40/min.  There is one "premature" beat, which can be considered to be ectopic, because it interrupts an otherwise regular rhythm.  The interesting thing is that the premature beat is not terribly early - it is about 740 ms from the previous beat.  If all the beats were spaced like this, the heart rate would be about 84/min.  There is probably an element of "escape" here, in that the ectopic beat is able to express itself due to the slow rate.  A faster sinus rate would override this ectopic focus.  So, we could view this early beat as a help, rather than a problem.  The most important consideration here is to address the cause of the bradycardia, and treat appropriately. 

Dawn's picture

ECG Basics: Junctional Rhythm

This is an example of a junctional rhythm that is slower than what is considered "intrinsic rate" for the junction.  The rate is around 30 bpm.  We know this is a "supraventricular" rhythm because of the narrow QRS.  Junctional beats travel to the ventricles via the bundle branches, which provides very fast conduction, resulting in a narrow QRS complex.  The P waves can be seen at the end of each QRS.  They are upside-down in this Lead II rhythm strip, indicating retrograde conduction from the junctional pacemaker to the atria.

Clinically, the important thing when we encounter such a slow rate is to evaluate the patient's response to the rate.  If the patient is hypoperfused (pale, decreased level of consciousness, low BP), we need to act to increase the rate, regardless of the cause of the bradycardia.

Dawn's picture

ECG Basics: Normal Sinus Rhythm With Premature Ventricular Contractions

This ECG shows an underlying rhythm of normal sinus rhythm at a rate of 80 / min.  There are two premature ventricular contractions (PVCs).  The sinus rhythm actually continues uninterrupted, causing a “compensatory pause”.  If you march out the P waves, you may even see hints of the hidden P waves in the ST segments of the PVCs.  The P waves that occur in the ST segments of the PVCs land in the refractory period of the ventricles, and so are unable to continue into the ventricles and cause a QRS. 


It is also permissible to call these beats “ventricular premature beats (VPBs)” or “ventricular premature complexes (VPCs)”.  

Dawn's picture

ECG Basics: Paroxysmal Supraventricular Tachycardia Treated With Adenosine

This series of ECG rhythm strips shows a paroxysmal supraventricular tachycardia successfully treated with adenosine.  The patient was complaining of a rapid heart rate and palpitations, but was hemodynamically stable.  It is not known whether any parasympathetic stimulation, such as a Valsalva maneuver or carotid sinus massage, was used initially.   

The first rhythm strip shows a PSVT, presumably AV nodal reentrant tachycardia, at a rate of about 215 per minute.  (We originally indicated a rate of 240 per minute, but this was a typo). Using the simplist method of determining rate, the six-second method, we see 21, but almost 22, QRS complexes in six seconds. Differential diagnosis would include sinus tachycardia, but this rate is too fast for sinus tach, especially in a resting patient.  Also, sinus tach would slow down as the patient is rested or made more comfortable, and this rate did not vary.  Also, when confronted with a supraventricular tachycardia, one should also consider atrial flutter and atrial fibrillation.  This is somewhat slow for atrial flutter with 1:1 conduction, and that rhythm is much more rare than AVNRT. It is too regular for atrial fibrillation.  So, we are left with the probable diagnosis of paroxysmal supraventricular tachycardia.  The “paroxysmal” part is presumed since AVNRT has an abrupt onset, and the patient’s symptoms started suddenly. 

The second rhythm strip shows what happened after adenosine was administered.  The patient received first a 6 mg dose, rapid IV push.  When that was not effective, he received 12 mg rapid IV push.  The rhythm strip is typical of the first minute or so after adenosine administration.  Adenosine can cause transient AV blocks, escape rhythms, and ectopic irritability.  The half-life of adenosine is only 6 seconds, so the dysrhythmias and uncomfortable symptoms are short-lived.  In this strip, we see frequent PVCs and runs of V tach.  

Dawn's picture

ECG Basics: Paroxysmal Supraventricular Tachycardia

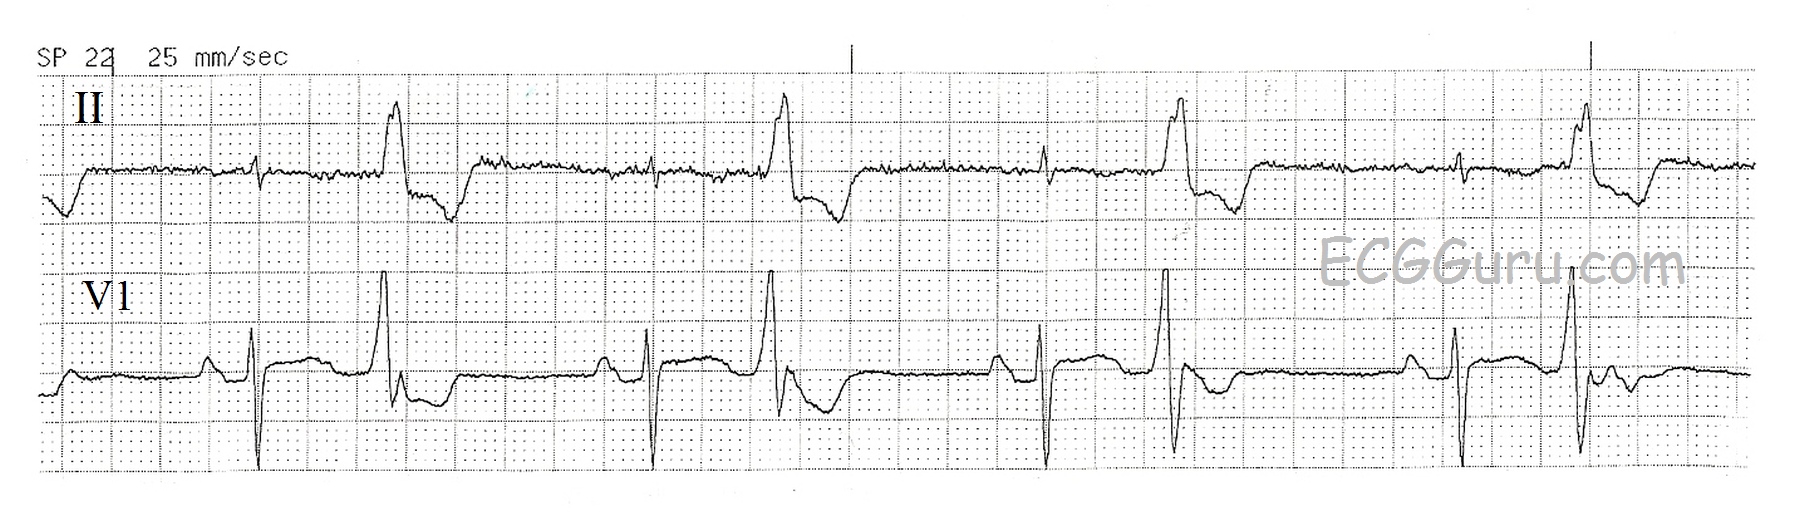
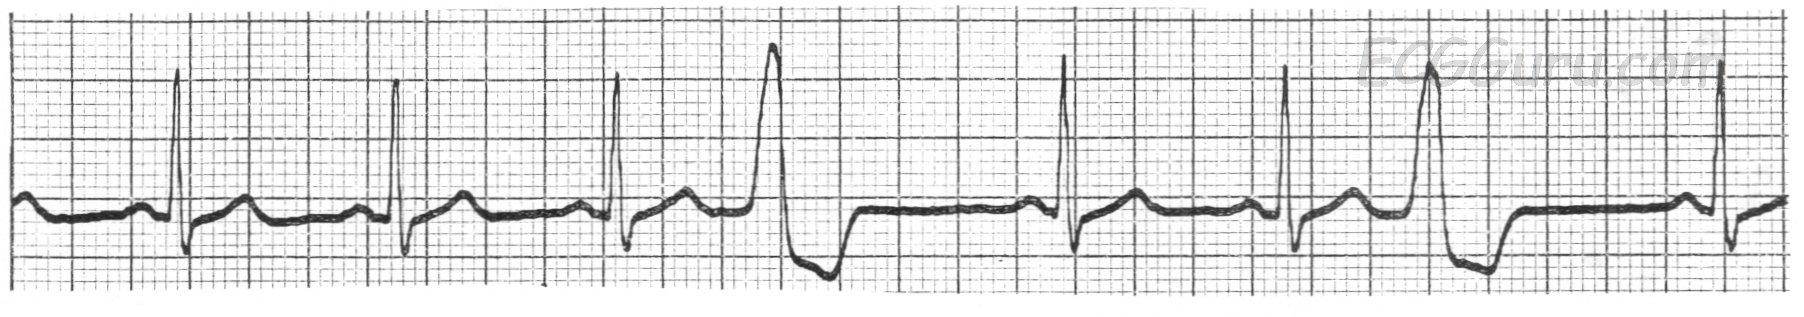
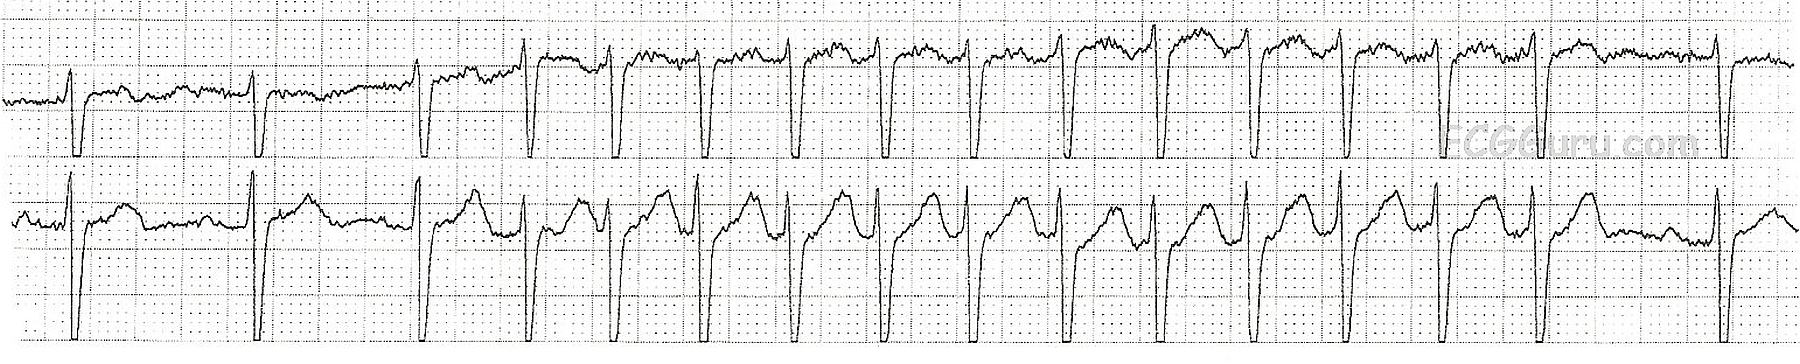
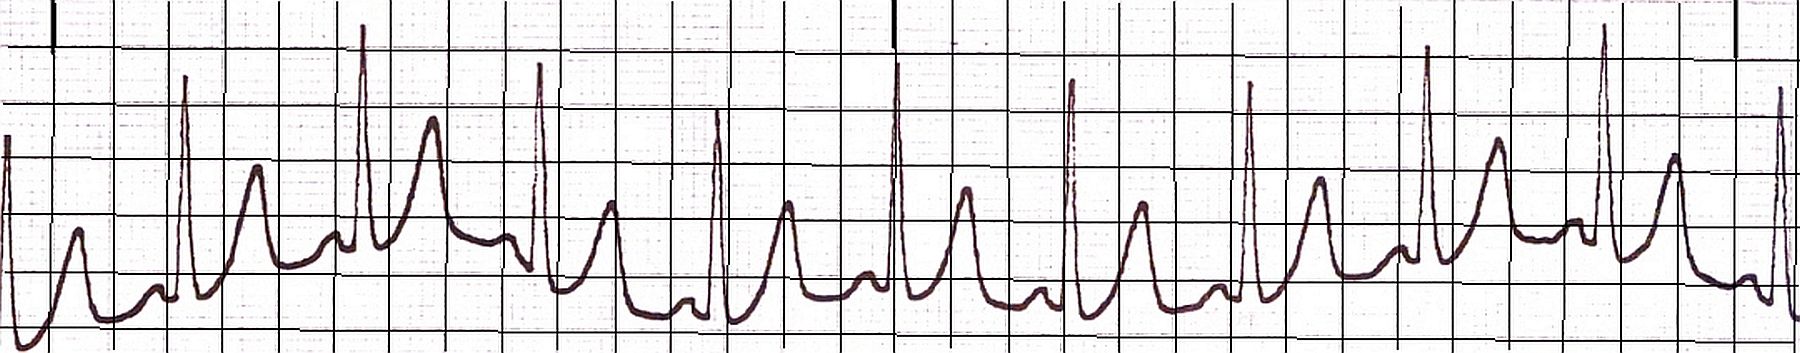
This two-lead rhythm strip clearly shows the transition from normal sinus rhythm to a paroxysmal supraventricular rhythm.  In this case, the arrhythmia is AV nodal reentrant tachycardia, AVNRT.  The rate of the first rhythm, NSR, is around 75 per minute.  The fourth beat on the strip is a PAC which initiates the paroxysm of tachycardia lasting 12 beats.  The arrhythmia terminates spontaneously at that point.  The tachycardia rate is about 150/min.

The topic of supraventricular tachycardias can be a very complex one to teach.  For an excellent example of a concise lesson geared toward Primary Practice physicians, go to Dr. Grauer's VIDEO - Part III of his Arrhythmia series.

To cover the important points for the beginner-level student:

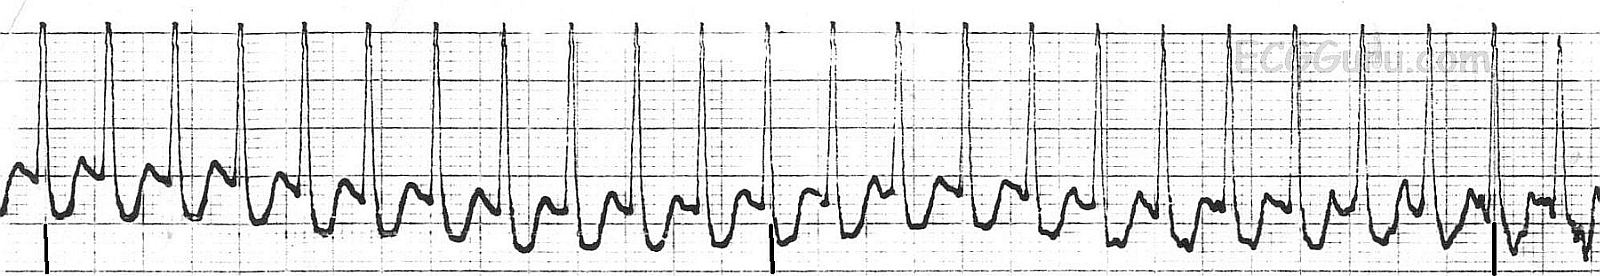
  *  It can be difficult to determine a rhythm is SVT if the rhythm is near 150 bpm and you DON'T see the beginning or end of the arrhythmia.  If the onset (or offset) is sudden, then this is not a sinus rhythm.  The sinus node speeds and slows more gradually - it doesn't change rates in one heartbeat.  This strip has an excellent view of BOTH the onset and the offset.

  *  The faster the rate, the more likely we are looking at a PSVT rather than sinus rhythm.  If a sinus tachycardia exists, we can almost ALWAYS see the reason for it in the patient's clinical situation.  We may see fever, dehydration, bleeding, fear, pain, exercise.  Therefore, a patient at rest with a rate of 150 would be suspect for PSVT.  A patient on a treadmill for 5 minutes would be considered to have a sinus rhythm.

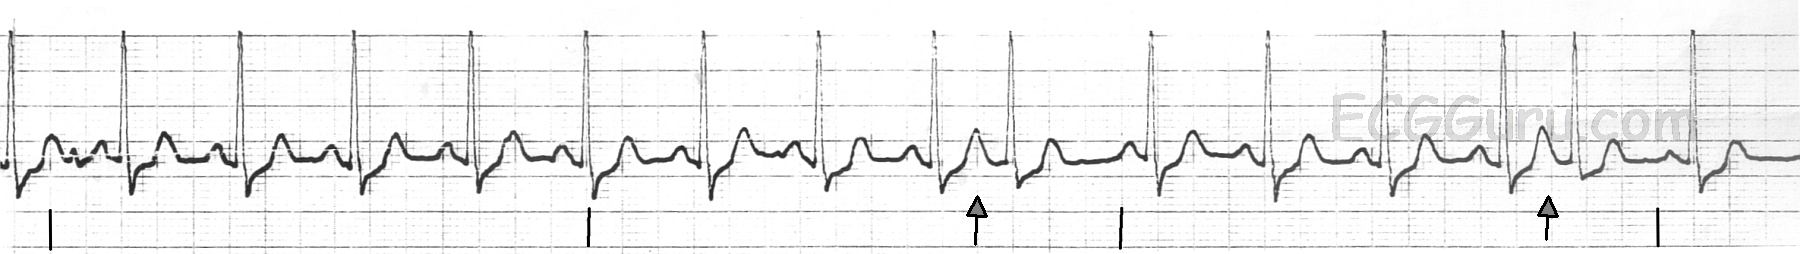
  *  Any patient with a rate around 150 per minute should be evaluated for ATRIAL FLUTTER with 2:1 conduction.  Atrial flutter often conducts at that ratio, because a rate of 150 is fairly easy for the AV node to conduct, whereas the instrinsic rate of atrial flutter (250-350) is not.  A 12-lead ECG makes it easier to search for tell-tale flutter waves.

Dawn's picture

ECG Basics: Ventricular Fibrillation Converted With Defibrillation

A good example of ventricular fibrillation converted by electric defibrillation to what appears to be a sinus rhythm.  There is significant artifact in the post-conversion strip, but the last beat on the strip appears to have a P-QRS-T sequence.

Of course, V Fib presents without pulses, and must be defibrillated as soon as possible.  Best results are achieved by defibrillating a perfused heart, so if there is any delay from onset of V Fib, CPR should be performed to perfuse the heart prior to defibrillation.

Dawn's picture

ECG Basics: Atrial Flutter With 2:1 Conduction Ratio, Rhythm strip

One of the most frequently misdiagnosed rhythms, atrial flutter with 2:1 conduction often masquerades as sinus tach.  Sinus tach usually has an obvious cause, such as exercise, severe hypovolemia, or age less than 6 months.  Atrial flutter usually produces flutter waves (P waves) at a rate of 250 - 350 per minute.  Therefore, a 2:1 conduction ratio would result in a heart rate of about 125 - 175 bpm).  

Often, students are taught about atrial flutter using an electronic rhythm generator or a book with limited illustrations, and they become acustomed to seeing atrial flutter with 3:1 or 4:1 conduction.  The flutter waves are very easy to see in such a situation.  However, the AV node, if not affected by medication, is usually well able to conduct at a rate of 150 or more.  Therefore, the physiological block that protects us from extreme rates will keep the heart rate around 150 bpm in atrial flutter.

This is a single rhythm strip.  It can be VERY helpful to look at multiple leads to look for flutter waves.  See this week's Instructors' Collection ECG of the WEEK for the SAME patient's 12-Lead ECG.  Also, your students should be reminded that sinus rhythms, including sinus tach, tend to change rates based on the needs of the patient.  For example, as a patient is treated for his/her condition, the rate may improve by slowing.  Conversely, if the condition becomes worse, or the patient is stressed, the rate may increase.  Atrial flutter, like all re-entry tachycardias, tends to stay at a steady rate unless the conduction ratio changes.

Show your students that the flutter waves are CONTINUOUS.  That is, they don't pause for the QRS.  The second illustration shows the flutter waves highlighted, to aid in seeing the continuous line of flutter waves.

Dawn's picture

ECG Basics: Baseline Artifact

This rhythm strip shows normal sinus rhythm, slightly on the fast side of normal at 95 bpm.  The baseline undulates up and down with the movements of the patient's chest as she breathes.  One way to correct this problem on a monitor strip is to move the limb electrodes away from the chest and onto the limbs.

Pages

All our content is FREE & COPYRIGHT FREE for non-commercial use

Please be courteous and leave any watermark or author attribution on content you reproduce.