
Submitted by jer5150 on Sun, 12/29/2013 - 09:52
Patient data: 64-year old man who, prior to this ECG, had been in normal sinus rhythm. Whatever your level of sophistication in rhythm interpretation (i.e., basic, intermediate, or advanced), this ECG has a little bit of something for everybody. Basic interpreters will undoubtedly recognize the dominant disturbance of rhythm. Intermediate interpreters will probably add more descriptors to their interpretation that will better describe the overall pattern. Advanced interpreters will recognize the unique nature of multilevel conduction and ratios. A laddergram will best elucidate the exact mechanism. I'd like to hear from all types of interpreters. 
Rate this content:
-

- jer5150's blog
- Log in or register to post comments
All our content is FREE & COPYRIGHT FREE for non-commercial use
Please be courteous and leave any watermark or author attribution on content you reproduce.
Comments
dual level AV nodal block
I’m not sure what level of interpretation this is - probably juvenile – but here goes:
The underlying rhythm is atrial flutter with an atrial rate of about 250bpm. Most of the time there is 3:1 conduction with a ventricular rate of about 83bpm. However, the ventricular rate is not completely regular, and the relationship between the flutter waves and the QRS complexes is not constant – the interval between the QRS and the flutter wave that immediately precedes it can be seen to be increasing in the long run of 3:1 conduction. This is the clue to the two ‘pauses’ in the ventricular rhythm: there must be Wenckeback block. Therefore I postulate that there is 3:1 conduction (or block) in the upper part of the AV node and Wenckeback block of these conducted impulses out of the lower part of the AV node. This would be an 8:7 Wenckebach block for the long run in the middle of the ECG.
I have tried to illustrate this with a somewhat crude laddergram (link below), although I don’t know how to correctly depict flutter waves and I don’t really know which flutter waves are the ones that conduct to the ventricles. I hope some of this makes sense!
https://www.dropbox.com/s/7t6v341vjz7f0jk/FB.png
Dave R
dual level block
The dual level block seems perfectly reasonable and very insightful to me. I had noticed the 3:1 conduction ratios and the 6:1 also, but it hadn't occurred to me that a dual level block could be the culprit. Your explanation makes perfect sense. I don't know whether your laddergram is technically correct or not, but it does get the point across.
Walter A. Mueller, CCT, CRAT
INTERPRETATION
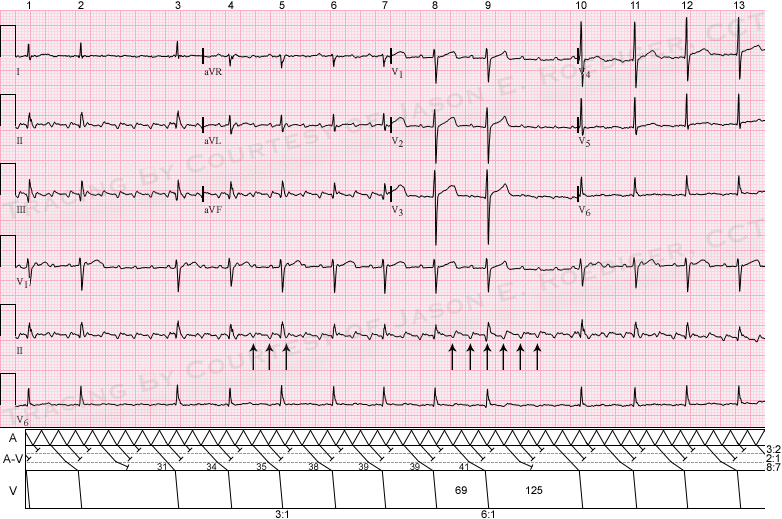
INTERPRETATION:(1.) Atrial flutter (rate about 267/min) with varying A-V conduction (mostly 3:1 ratios) reducing the ventricular rate to about 76/min.
(2.) Questionable old inferior infarction.
COMMENTS:
Atrial flutter with varying A-V conduction is not an uncommon finding in electrocardiography but usually most (if not all) of the ratios are even-numbered (e.g., 2:1, 4:1, 6:1, etc.). Usually there are only 2 anatomic levels of conduction in the A-V junction. What’s unusual here is the multi-level A-V conduction producing this pattern. Most atrial flutters demonstrate even ratios (e.g., 4:1 ) rather than odd ratios (e.g., 5:1). In this ECG, we have a combination of both (i.e., 3:1 and 6:1). Here, there are a total of 3 distinctly different anatomic levels of conduction in the A-V junction (see laddergram). In the laddergram, I have represented this by separating the A-V tier into 3 levels divided by dashed (broken) horizontal lines colored in grey. At the highest (top) level of the A-V junction, there is a constant 3:2 conduction. Those atrial impulses that succeed in traversing this top layer proceed to the middle level. In the middle level of the A-V junction, there is a constant 2:1 conduction. Again, those atrial impulses that successfully conduct through this middle layer continue their anterograde journey to the third (bottom) level of conduction. It is at the lowest level of the A-V junction that we encounter the progressively lengthening conduction that is characteristic of the Wenckebach phenomenon. Note the progressively lengthening F-R intervals (31, 34, 35, 38. 39, 39, and 41). There is an 8:7 Wenckebach period at the third and lowest level of the A-V junction. There are essentially 2 different ventricular cycles. The longest ventricular cycles (125) are less than twice the shortest ventricular cycles (69). This is also a common finding in the Wenckebach phenomenon.
Jason E. Roediger - Certified Cardiographic Technician (CCT)
[email protected]