Displaying 41 - 50 of 63
Dawn's picture

ECG Basics: Sinus Pause / Sinus Arrest

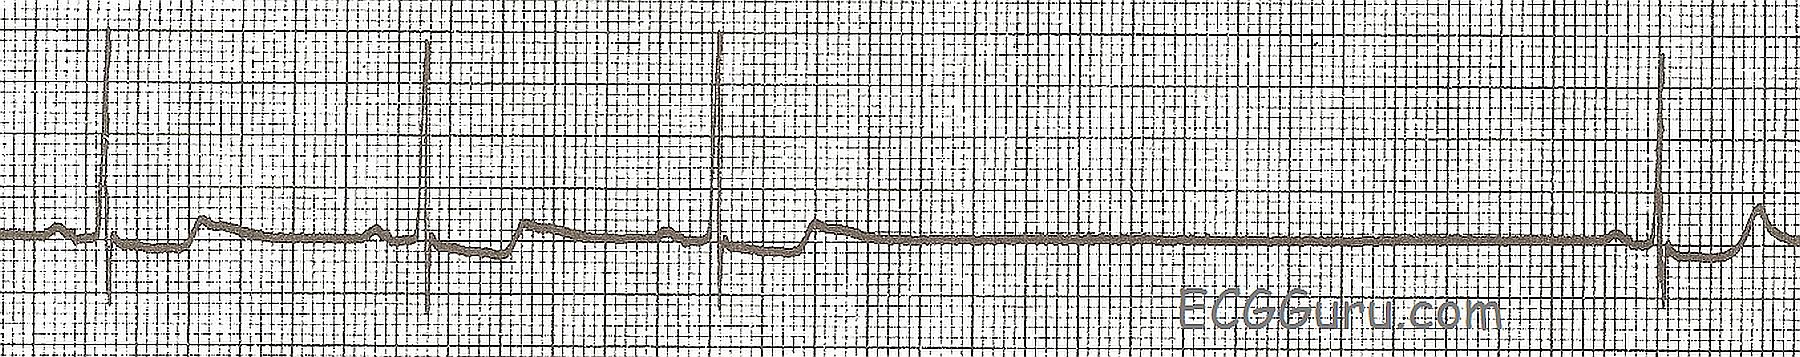
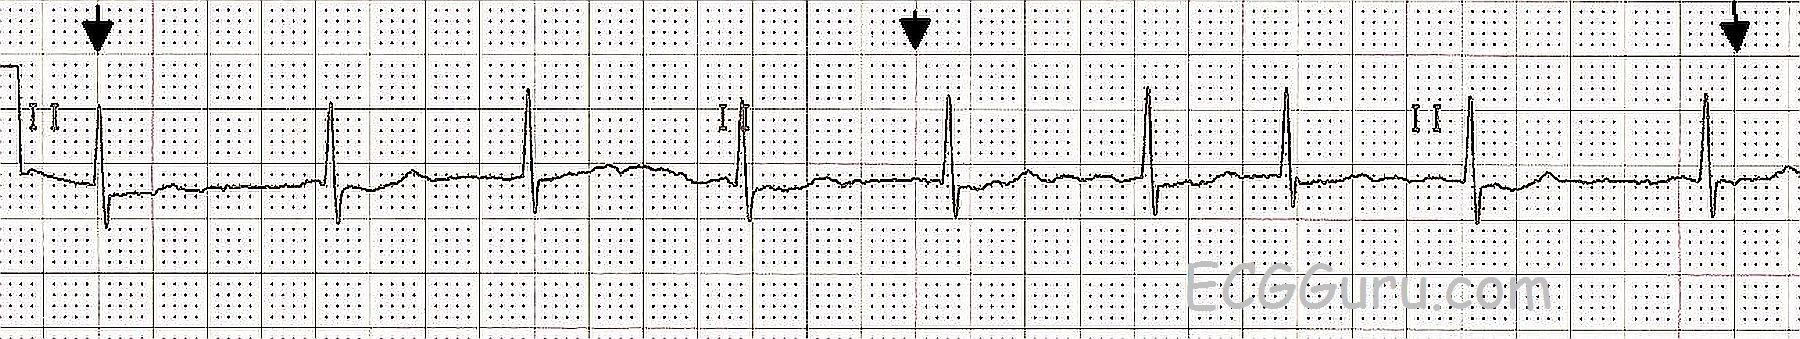
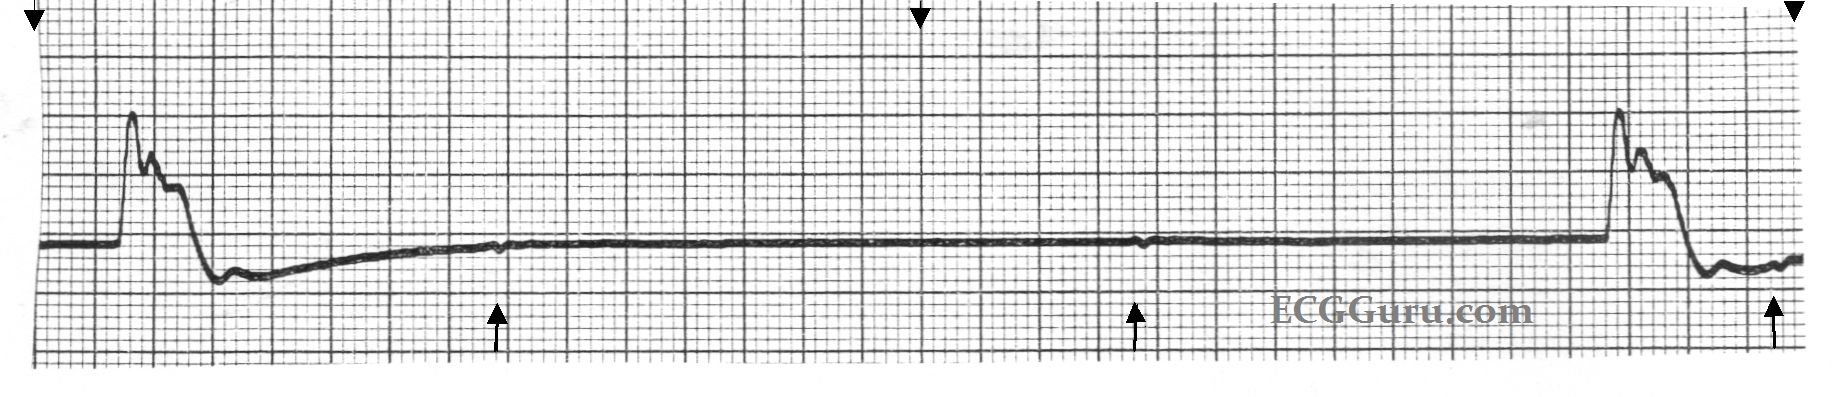
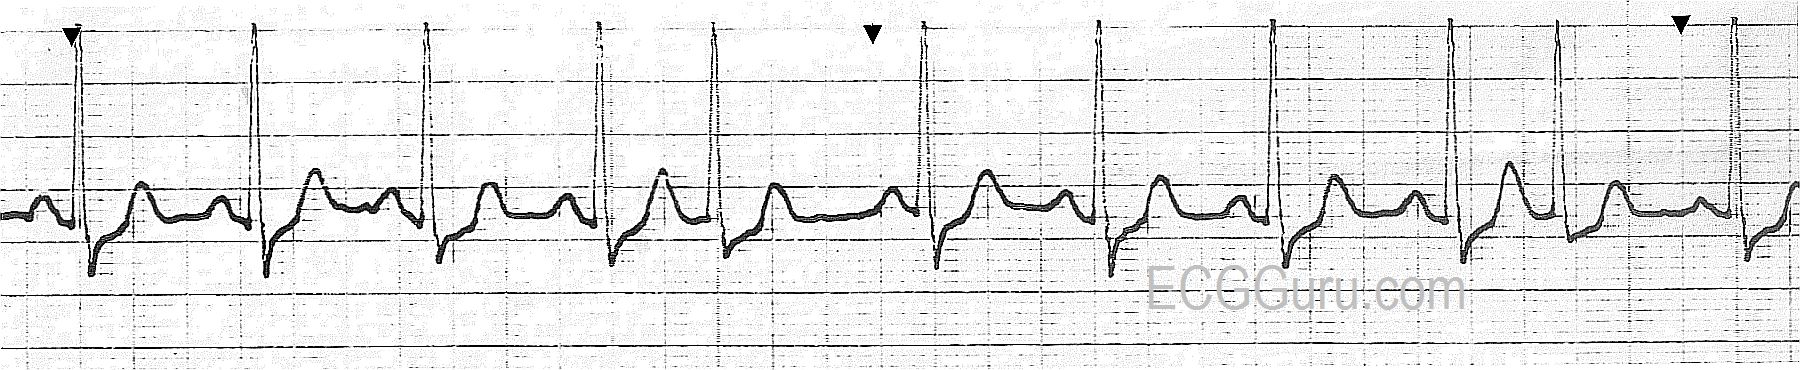
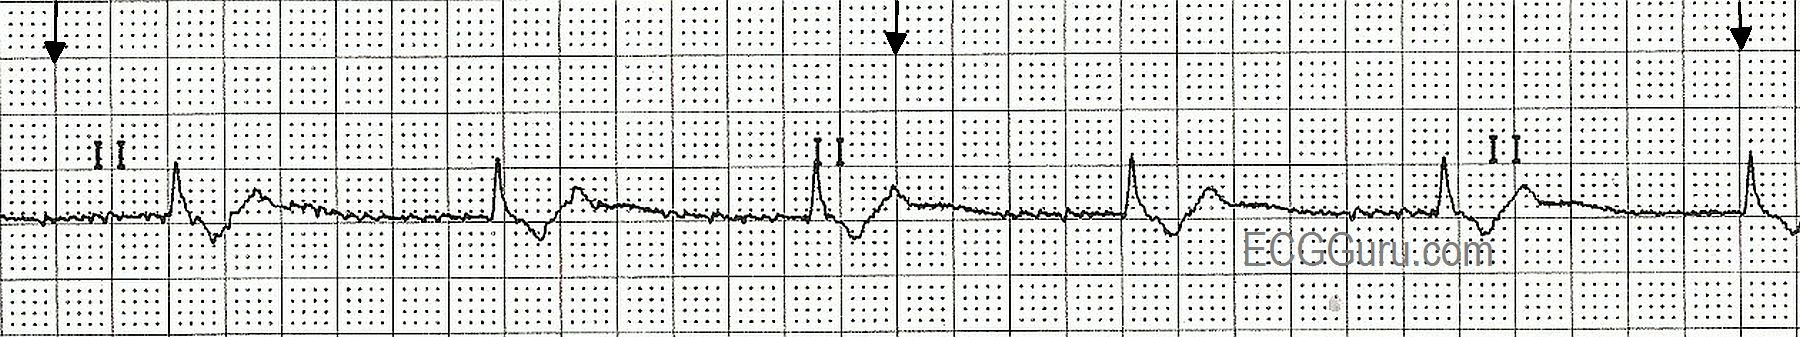
This example of sinus arrest, also called sinus pause, shows a spontaneous return to sinus rhythm.  There are many mechanisms by which pauses can occur on the ECG. One concept for beginner students to grasp is that, if the pause contains the equivalent of regular R-to-R intervals, and the first complex after the pause is "on time",  we can expect that the sinus node kept firing, but did not penetrate the atria (exit block). If the pause is irregular in length, with the first beat after the pause seeming to come in randomly, we can call this sinus arrest or pause, understanding that there are many different mechanisms that can be at work here. Because what little we can see of the underlying sinus rhythm is irregular, or speeding up, we cannot discern absolutely that this is sinus arrest. 

The bottom line for the patient, and for any level practitioner, is, "how is the patient tolerating this pause, and what does it mean to the patient's overall prognosis?  In the short term, the patient may require emergency pacing while the cause of the dysfunction is investigated. If pauses are long enough to lower cardiac output, they can cause fainting. More than a few automobile accidents have happened as a result of this type of dysrhythmia. 

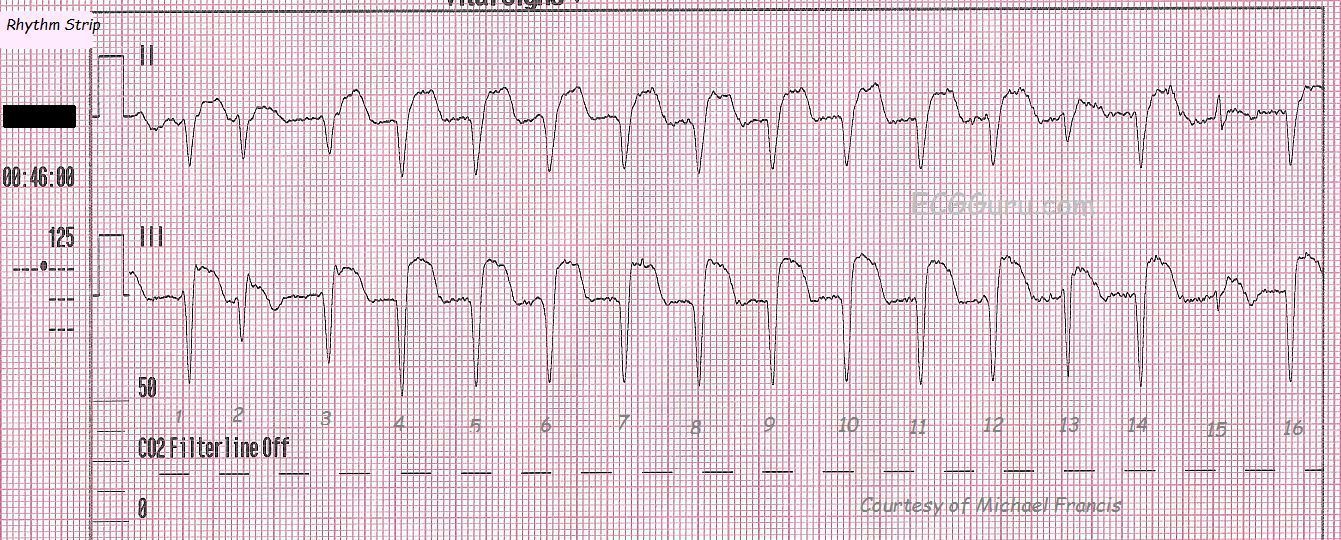
For more advanced students, this short rhythm strip (Lead II) reveals sloping ST depression, and indicates the urgent need for a 12-lead ECG and other tests. 


Dawn's picture

ECG Basics: Accelerated Idioventricular Rhythm

This rhythm strip is taken from a 67 year old man with chest pain who had ECG signs of inferior-posterior  wall M.I. upon the arrival of paramedics.  He had a recent (5 day) history of cardiac cath and stent placement.  During his treatment, his condition and ECG signs improved somewhat, and it was felt that he spontaneously reperfused during transport.  Often, during reperfusion of the heart after a total or near-total occlusion, dysrhythmias will appear.  They are usually transient.  This strip shows accelerated idioventricular rhythm.  The criteria are:  wide complex rhythm with no P waves associated, rate between 40 and 100 bpm.  The rate can go higher. Some people would prefer the term V Tach when the rate is over 100.  This rhythm, however, is not usually as sinister as V Tach.Sometimes, it can be difficult to differentiate AIVR from sinus rhythm with hidden P waves and a conduction defect such as bundle branch block, which widens the QRS.  Artifact such as we see here can obscure P waves, as can a very fast rate.  The real clue to this being AIVR is the "capture" beat - number 15 - at the end.  This is a sinus beat, proving that there is a separate underlying sinus rhythm.  Beat number 2 is a fusion beat - the ventricular beat coming from below has "collided" with the supraventricular depolarization wave from above (in this case a PAC).  The resulting QRS has characteristics of both beats.    This AIVR has taken over the heart, as the FASTEST PACEMAKER CONTROLS THE HEART.  To see a series of 12-lead ECGs from this patient, go to http://ecgguru.com/ecg/teaching-series-112213-inferior-posterior-wall-mi...

Dawn's picture

ECG Basics: Atrial Fibrillation With A Controlled Ventricular Response

Atrial fibrillation with a controlled ventricular response is often considered to be atrial fib that has been controlled with medication.  While this is often true, it is possible to see atrial fib with a ventricular rate between 50 and 100 bpm in a patient who has not been treated.  The hallmark signs of atrial fib are:  no P waves and irregularly-irregular rhythm.

Multiple, simultaneous leads are advised to be sure there are no P waves, and a long rhythm strip is often needed to prove the irregularly-irregular rhythm.  Remember, even though this rate is adequate (about 90 bpm), the loss of P waves means no "atrial kick".  The atria are not filling the ventricles with a forceful pumping action. Patients can lose a significant percentage - up to 25% - of their cardiac output because of this.  Coupled with the risk of stroke from the formation and embolization of blood clots from the sluggish circulation in the atria, it is much preferable to have sinus rhythm at the same rate.

Dawn's picture

ECG Basics: Idioventricular Escape Rhythm

This six-second monitor strip was from a patient who was designated "Do Not Resuscitate", and whose heart rhythm was slowing dramatically.  It shows an idioventricular escape rhythm, with very wide QRS complexes and only two complexes in six seconds. (The top arrows mark three-second segments.)  If you look closely at the points marked by the lower arrows, you will see small, uniform, regular P waves.  The mechanism leading to this agonal rhythm was complete heart block.  A longer strip would show the P waves as all alike, and fairly regular, but slowing.  

Dawn's picture

ECG Basics: Ventricular Fibrillation

A good example of ventricular fibrillation.  The patient is pulseless, CPR has been performed, and the ED staff is about to defibrillate.  Characteristics of V Fib are:  a chaotic, wavy baseline without clear P waves, QRS complexes, or T waves.  Baseline artifact (baseline going up and down) can be seen with CPR and other movement of the electrodes on the patient's body as resuscitation efforts are underway.  The patient will ALWAYS be unconscious and pulseless in V Fib.  If this rhythm is seen in a patient who is awake or has pulses, it is ARTIFACT - check your electrodes!  

Dawn's picture

ECG Basics: Paroxysmal Supraventricular Tachycardia Converted With Adenosine

Today, you get THREE strips for your basic classes!  The first shows a PSVT - paroxysmal supraventricular tachycardia at a rate of about 220/minute.  The QRS complexes are narrow, and the rhythm is regular.  In the second strip, we see the moment of conversion after a dose of 6 mg. of adenosine was administered by rapid I.V. infusion.  The re-entry cycle is broken, and the patient experiences many PVCs, including groups of two, three, and even four in a row.  Soon, however, the rhythm settles into sinus rhythm with PACs, and later, just sinus rhythm (not shown).  For your more advanced students, the second strip shows the PVCs interacting with the underlying sinus rhythm.  There are several fusion beats with varying degrees of fusion, and one can sometimes see a sinus P wave just before a PVC.  None of this is clinically significant in this patient, because the ventricular ectopy was a side effect of the treatment, and was self-limited.  It is a great strip for teaching, though! 

Dawn's picture

ECG Basics: Junctional Rhythm

This rhythm strip illustrates a junctional escape rhythm.  The sinus rhythm has slowed or stopped, and the junctional tissue has taken over as the pacemaker of the heart.  The "junction" is loosely defined as the area between the AV node and the Bundle of His.  The intrinsic rate of the pacemaking tissue in this area is 40 - 60 beats per minute.  This slow rate is usually overridden by the sinus node, and the junction is not allowed to express itself as a pacemaker.  Should the sinus node fail or fall below the junctional rate, the junction "escapes" and takes control of the heart.  The QRS complex in junctional rhythm will normally be narrow, because the impulse follows the bundle branches down through the ventricles in a normal fashion, resulting in quick and normal ventricular depolarization.  If the QRS complex is wide in a junctional rhythm, there is another, separate cause, such as bundle branch block.

 If the junctional impulse is able to penetrate the AV node and depolarlize the atria, the P wave will be deflected downward in Leads II, III, and aVF, as the impulse is travelling in a retrograde direction (backward).  The P wave could end up slightly before the QRS, during the QRS, or after the QRS. In this strip, the P waves are seen after the QRS complexes.

Dawn's picture

ECG Basics: Atrial Flutter With Variable Conduction

This is a good teaching strip for showing your students how to "see" the atrial activity separately from the ventricular activity.  The P waves, also called flutter waves, march out regularly at a rate of around 300/minute, which is typical of atrial flutter.  The conduction ratio is variable, and the intervals between the conducted P waves and the QRS complexes vary, as well, reflecting changing refractoriness of the AV node.  It is easy with this strip to "march out" the flutter waves, through the QRS complexes, and to show your students how the flutter waves are either visible, or "hiding" behind a QRS complex.  We have featured several atrial flutter examples on the ECG Guru recently.  Remember, you can also obtain rhythm strips for your basic students by cropping out the rhythm strips often found at the bottom of 12-lead ECGs.

Dawn's picture

ECG Basics: NIPS Procedure, ICD Test

This is a rhythm strip from a NIPS procedure (non-invasive programmed stimulaltion), which is a programming test for an implantable cardioverter defibrillator (ICD).  The test is done under light anesthesia, similar to that used for colonoscopy.   In this example, the patient is in normal sinus rhythm at the beginning of the procedure.  The pacemaker technician overdrives the patient's rate to observe the pacing function, then a stimulus is delivered to cause ventricular fibrillation (V Fib).  Initially, the ventricular rhythm is somewhat organized and coarse (V flutter), but it will rapidly deteriorate if not corrected.  Before it deteriorates, the ICD delivers a shock, and the patient's rhythm is restored.  In this example, bi-ventricular pacing was conducted for a few minutes before the patient resumed NSR.  The patient is then recovered from the anesthesia and discharged home.

For your students, this is a good example of the relative safety of shocking the well-perfused heart.  Although it is possible to put the heart into an intractable V Fib with this test, the ICD usually is able to convert the potentially lethal rhythm easily.  It is a good reminder that we need to perfuse the heart well before performing defibrillation on a person with unwitnessed cardiac arrest.

Dawn's picture

ECG Basics: Ventricular Tachycardia

An example of ventricular tachycardia in Lead II.  This patient's rate is about 190/min.  V Tach will have the following criteria:  Rate greater than 100/min, QRS duration greater than .12 sec. (120 ms), and no P wave associated with the QRS.

It can be difficult to distinguish V Tach from other wide-complex tachycardias without a 12-lead ECG, but all wide-complex tachycardias should be treated as V Tach until proven otherwise, as V Tach is a potentially lethal dysrhythmia.  V Tach can cause a severe reduction in cardiac output which can lead to V Fib and death.

Pages

All our content is FREE & COPYRIGHT FREE for non-commercial use

Please be courteous and leave any watermark or author attribution on content you reproduce.